Population and Household Projections Northeast Avalon ... - Finance
Population and Household Projections Northeast Avalon ... - Finance
Population and Household Projections Northeast Avalon ... - Finance

Create successful ePaper yourself
Turn your PDF publications into a flip-book with our unique Google optimized e-Paper software.
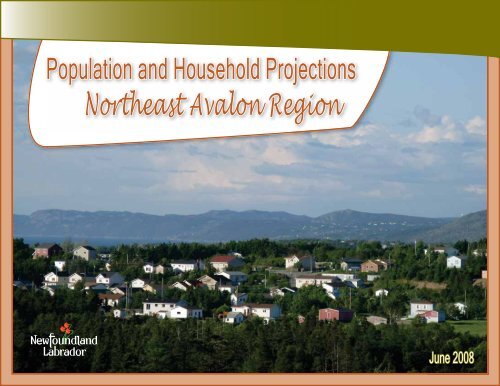
<strong>Population</strong> <strong>and</strong> <strong>Household</strong> <strong>Projections</strong><br />
<strong>Northeast</strong> <strong>Avalon</strong> Region<br />
June 2008
<strong>Population</strong> <strong>and</strong> <strong>Household</strong> <strong>Projections</strong><br />
for the <strong>Northeast</strong> <strong>Avalon</strong> Region<br />
Prepared By:<br />
Economic Research <strong>and</strong> Analysis Division<br />
Economics <strong>and</strong> Statistics Branch<br />
Department of <strong>Finance</strong><br />
P.O. Box 8700<br />
St. John’s, NL A1B 4J6<br />
Telephone: (709) 729-3255<br />
Facsimile: (709) 729-6944<br />
Website: www.economics.gov.nl.ca<br />
June 2008<br />
Economic Research <strong>and</strong> Analysis Division | www.economics.gov.nl.ca | 2
Contents<br />
1.0 Introduction .................................................................................... 1<br />
2.0 Methodology ................................................................................... 7<br />
3.0 <strong>Population</strong> <strong>and</strong> <strong>Household</strong> <strong>Projections</strong> ............................................. 9<br />
4.0 Summary ...................................................................................... 11<br />
5.0 Glossary ....................................................................................... 13<br />
6.0 Appendices ................................................................................... 15<br />
Appendix A ................................................................................... 17<br />
Appendix B ................................................................................... 21<br />
Appendix C ................................................................................... 23<br />
<strong>Population</strong> <strong>and</strong> <strong>Household</strong> <strong>Projections</strong><br />
for the <strong>Northeast</strong> <strong>Avalon</strong> Region<br />
1 | www.economics.gov.nl.ca | Economic Research <strong>and</strong> Analysis Division
<strong>Population</strong> <strong>and</strong> <strong>Household</strong> <strong>Projections</strong><br />
for the <strong>Northeast</strong> <strong>Avalon</strong> Region<br />
Economic Research <strong>and</strong> Analysis Division | www.economics.gov.nl.ca | 2
1.0 Introduction<br />
In January 2005, the provincial government announced a comprehensive<br />
review of the St. John’s Urban Region Regional Plan.<br />
The St. John’s Urban Region Regional Plan is the planning <strong>and</strong><br />
policy document that guides development <strong>and</strong> l<strong>and</strong> use for the<br />
<strong>Northeast</strong> <strong>Avalon</strong> Peninsula as far south as Witless Bay <strong>and</strong> south<br />
west as Holyrood including Bell Isl<strong>and</strong>. The Plan was approved in<br />
1976 <strong>and</strong> although there have been several amendments over<br />
the years, there had not been an extensive review since the Plan<br />
was implemented.<br />
As a part of the review, a Technical Planning Committee was<br />
established <strong>and</strong> it was this committee that asked the Economic<br />
Research <strong>and</strong> Analysis Division (ERAD) of the Department of<br />
<strong>Finance</strong> to prepare population <strong>and</strong> household projections for the<br />
<strong>Northeast</strong> <strong>Avalon</strong> Region.<br />
This report presents a review of past population <strong>and</strong> household<br />
trends for the <strong>Northeast</strong> <strong>Avalon</strong> Region as well as projections for<br />
the coming years. Historical data (census years) from 1981 to<br />
2006 are presented along with projections to 2026. The results<br />
are available by five-year age groups <strong>and</strong> gender for the region.<br />
The population <strong>and</strong> household projections in this report include<br />
the following municipalities: St. John’s, Mount Pearl, Conception<br />
Bay South, Paradise, Portugal Cove-St. Philip’s, Torbay, Holyrood,<br />
Logy Bay-Middle Cove-Outer Cove, Pouch Cove, Flatrock,<br />
Witless Bay, Bay Bulls, Petty Harbour-Maddox Cove, Bell Isl<strong>and</strong><br />
<strong>and</strong> Bauline.<br />
Holyrood<br />
Pouch Cove<br />
Flatrock<br />
Bauline<br />
Torbay<br />
Bell Isl<strong>and</strong><br />
Portugal Cove-St. Philip's<br />
St. John's<br />
Paradise<br />
Mount Pearl<br />
Conception Bay South<br />
Logy Bay-Middle Cove-Outer Cove<br />
Petty Harbour-Maddox Cove<br />
<strong>Population</strong> <strong>and</strong> <strong>Household</strong> <strong>Projections</strong><br />
for the <strong>Northeast</strong> <strong>Avalon</strong> Region<br />
In the process of preparing the population projections, the ERAD<br />
conducted consultations with various municipal officials for their<br />
knowledge of ongoing <strong>and</strong> potential future developments in their<br />
respective areas. Discussions revolved around present <strong>and</strong> future<br />
potential commercial <strong>and</strong> residential development prospects for<br />
each town/city.<br />
Department of <strong>Finance</strong><br />
Newfoundl<strong>and</strong> & Labrador Statistics Agency<br />
Witless Bay<br />
Bay Bulls<br />
RW08_111v1<br />
May 9, 2008<br />
1 | www.economics.gov.nl.ca | Economic Research <strong>and</strong> Analysis Division
Using historic data, the information collected in consultation with<br />
municipal officials <strong>and</strong> ERAD's long-term economic forecast, three<br />
scenarios (high, medium <strong>and</strong> low) were produced for population<br />
<strong>and</strong> households in the region.<br />
Total Fertility Rate<br />
<strong>Population</strong> <strong>and</strong> <strong>Household</strong> <strong>Projections</strong><br />
for the <strong>Northeast</strong> <strong>Avalon</strong> Region<br />
The time periods available for historical data vary by geography <strong>and</strong><br />
indicator. Most provincial level data are available back to the early<br />
1970s. However, data regarding population <strong>and</strong> occupied dwellings<br />
for the <strong>Northeast</strong> <strong>Avalon</strong> Region are available from census<br />
years 1981 to 2006, while birth, death <strong>and</strong> net-migration data are<br />
only available from 1991 to 2005.<br />
1.1 Past Trends<br />
Background<br />
Changes in a region’s population can be disaggregated into components.<br />
Births <strong>and</strong> in-migration increase the size of the population<br />
while deaths <strong>and</strong> out-migration decrease the population. Fertility<br />
rates <strong>and</strong> births are influenced by factors such as new birth control<br />
methods, changing societal values regarding gender equality <strong>and</strong><br />
children, <strong>and</strong> increased female labour force participation. The number<br />
of deaths generally depends on the age structure <strong>and</strong> life expectancies<br />
in a population. Factors influencing births <strong>and</strong> deaths tend to<br />
be stable from year-to-year <strong>and</strong> change slowly over time. However,<br />
in- <strong>and</strong> out-migration tends to be driven by the health of the local<br />
economy relative to other jurisdictions. Relative economic conditions<br />
can change from year-to-year <strong>and</strong> as a result annual net-migration<br />
(in less out) numbers can, <strong>and</strong> very often do, change dramatically<br />
from one year to the next. Combined, these demographic factors<br />
determine the overall size <strong>and</strong> make-up of the population.<br />
Statistics Canada; Economic Research <strong>and</strong> Analysis Division, Department of <strong>Finance</strong><br />
Natural <strong>Population</strong> Change, <strong>Northeast</strong> <strong>Avalon</strong><br />
Natural <strong>Population</strong> Change<br />
The demographics of Newfoundl<strong>and</strong> <strong>and</strong> Labrador have changed<br />
significantly over the past four decades. The Total Fertility Rate 1 (TFR)<br />
has declined sharply from 4.6 in the mid 1960s to about 1.3 today.<br />
The TFR in the <strong>Northeast</strong> <strong>Avalon</strong> Region has followed the provincial<br />
Statistics Canada; Economic Research <strong>and</strong> Analysis Division, Department of <strong>Finance</strong><br />
1.<br />
The number of births per women of childbearing age at current fertility rates.<br />
Economic Research <strong>and</strong> Analysis Division | www.economics.gov.nl.ca | 2
trend since 1991 declining from roughly 1.5 in 1991 to roughly 1.3<br />
in recent years.<br />
Net Migration, <strong>Northeast</strong> <strong>Avalon</strong><br />
Provincial births have fallen along with fertility rates, declining from<br />
around 15,000 annually in the early 1960s to about 4,300 last<br />
year. Over the past 15 years births in the <strong>Northeast</strong> <strong>Avalon</strong> have<br />
also declined, dropping from near 2,500 in 1991 to roughly 1,900<br />
in 2005.<br />
With the provincial population aging, the number of deaths have<br />
increased, rising from around 3,000 annually in the 1960s to<br />
about 4,500 last year. Deaths in the <strong>Northeast</strong> <strong>Avalon</strong> increased<br />
modestly over the past 15 years increasing from approximately<br />
1,200 in 1991 to roughly 1,400 in 2005.<br />
The combination of declining births <strong>and</strong> increasing deaths means<br />
that provincial natural population change has declined from an<br />
annual increase of roughly 12,000 in the 1960s to a decrease of<br />
roughly 200 last year. Similar trends were observed in the <strong>Northeast</strong><br />
<strong>Avalon</strong> Region where natural population change declined from<br />
1,300 in 1991 to roughly 500 in 2005.<br />
Net Migration <strong>and</strong> <strong>Population</strong><br />
The population of Newfoundl<strong>and</strong> <strong>and</strong> Labrador declined steadily<br />
from 1992 to 2007. The collapse of the fishery in 1992 was followed<br />
by a period of high out-migration in the mid to late 1990s.<br />
High out-migration <strong>and</strong> a low fertility rate contributed to large<br />
population declines. Out-migration slowed in the 2002 to 2004<br />
period, but it increased again in the 2005 to 2007 period as major<br />
construction projects were completed <strong>and</strong> the dem<strong>and</strong> for labour in<br />
other provinces (e.g., Alberta) increased. Recent quarterly numbers<br />
for the second half of 2007 <strong>and</strong> the first half of 2008 show signs<br />
of an improvement with preliminary numbers indicating net in-migration<br />
to the province. This is most likely due to the strong performance<br />
of the province's economy <strong>and</strong> renewed optimism about<br />
future opportunities, in particular oil <strong>and</strong> gas.<br />
The <strong>Northeast</strong> <strong>Avalon</strong> Region lost people due to net out-migration<br />
between 1991 <strong>and</strong> 2001; however, unlike the province as a whole,<br />
the losses were not high enough to cause significant population<br />
Economic Research <strong>and</strong> Analysis Division, Department of <strong>Finance</strong><br />
declines. In fact, things turned around between 2001 <strong>and</strong> 2006 with<br />
net in-migration <strong>and</strong> natural increase both contributing to population<br />
growth. Table 1 illustrates the total population of each community located<br />
in the <strong>Northeast</strong> <strong>Avalon</strong> Region according to the census counts<br />
from Statistics Canada for all census years from 1981 to 2006. As<br />
is evident from Table 1, the population of the region has generally<br />
increased over the 25 year period from 1981 to 2006. There was a<br />
slight decline in population between 1996 <strong>and</strong> 2001, but population<br />
grew in each of the other census periods. The most recent population<br />
growth, between 2001 <strong>and</strong> 2006, is likely due to strong growth<br />
in the local economy <strong>and</strong> the continuation of a general trend towards<br />
urbanization.<br />
The combination of natural gains <strong>and</strong> in-migration from rural areas<br />
have increased the <strong>Northeast</strong> <strong>Avalon</strong> Region population even as<br />
the provincial population declined. A large portion of the <strong>Northeast</strong><br />
<strong>Avalon</strong> Region is comprised of the City of St. John’s <strong>and</strong> the suburban<br />
area around St. John's. The City of St. John’s has recorded a<br />
1.3% decline in population between 1981 <strong>and</strong> 2006 due to household<br />
aging <strong>and</strong> out-migration. As a result, the population growth for<br />
the <strong>Northeast</strong> <strong>Avalon</strong> Region has been largely due to the population<br />
gains in the City of Mount Pearl <strong>and</strong> the suburban communities of<br />
<strong>Population</strong> <strong>and</strong> <strong>Household</strong> <strong>Projections</strong><br />
for the <strong>Northeast</strong> <strong>Avalon</strong> Region<br />
3 | www.economics.gov.nl.ca | Economic Research <strong>and</strong> Analysis Division
Table 1 – Total <strong>Population</strong> (Census Counts) by Community from 1981-2006<br />
<strong>Population</strong> <strong>and</strong> <strong>Household</strong> <strong>Projections</strong><br />
for the <strong>Northeast</strong> <strong>Avalon</strong> Region<br />
1981 1986 1991 1996 2001 2006<br />
Actual Change<br />
1981-2006<br />
Percentage Change<br />
1981-2006<br />
Holyrood 1,789 2,115 2,075 2,090 1,905 2,005 216 12.1%<br />
Conception Bay South 14,405 16,295 17,590 19,265 19,770 21,965 7,560 52.5%<br />
Paradise 3,309 5,826 7,376 7,960 9,600 12,585 9,276 280.3%<br />
Portugal Cove-St. Philips 3,855 4,768 5,471 5,770 5,870 6,575 2,720 70.6%<br />
Bell Isl<strong>and</strong> 4,861 4,610 4,185 3,595 3,080 2,780 -2,081 -42.8%<br />
Bauline 423 417 385 380 365 380 -43 -10.2%<br />
Pouch Cove 1,896 1,961 1,976 1,885 1,670 1,760 -136 -7.2%<br />
Flatrock 808 885 1,045 1,085 1,135 1,215 407 50.4%<br />
Torbay 3,534 3,886 4,707 5,230 5,470 6,280 2,746 77.7%<br />
Logy Bay-Middle Cove-Outer Cove 1,163 1,366 1,885 1,880 1,875 1,975 812 69.8%<br />
St. John's 101,974 103,083 104,635 101,935 99,180 100,650 -1,324 -1.3%<br />
Mount Pearl 17,487 20,293 23,690 25,520 24,960 24,670 7,183 41.1%<br />
Petty Harbour-Maddox Cove 853 975 975 955 950 915 62 7.3%<br />
Bay Bulls 1,150 1,115 1,065 1,065 1,015 1,080 -70 -6.1%<br />
Witless Bay 1,058 1,020 1,065 1,115 1,060 1,070 12 1.1%<br />
TOTAL 158,565 168,616 178,125 179,730 177,905 185,905 27,340 17.2%<br />
Statistics Canada<br />
Conception Bay South, Paradise, Portugal Cove-St. Philips, Torbay,<br />
Logy Bay-Middle Cove-Outer Cove <strong>and</strong> Flatrock.<br />
As outlined in Table 1, the population of Paradise <strong>and</strong> Torbay has<br />
increased by approximately 280% <strong>and</strong> 78% respectively over the<br />
25 year period. There were also significant gains in population in<br />
Mount Pearl, Conception Bay South, Flatrock, Logy Bay-Middle<br />
Cove-Outer Cove <strong>and</strong> Portugal Cove-St. Philips.<br />
The popularity of suburban life has increased significantly over the<br />
last two decades. The relatively cheaper cost of residential real<br />
estate was a driving factor in the beginning stages of each suburb.<br />
This was followed by major infrastructure developments which made<br />
living in these communities more convenient. The addition of major<br />
roadways, such as the downtown arterial <strong>and</strong> the Outer Ring Road<br />
has dramatically increased the accessibility of these communities.<br />
Some of these areas now provide major shopping centres <strong>and</strong> other<br />
businesses to satisfy the dem<strong>and</strong>s of a growing local population.<br />
The <strong>Northeast</strong> <strong>Avalon</strong> Region also includes some communities that<br />
are considered more rural. They are generally less accessible from<br />
the City of St. John’s <strong>and</strong> tend to have smaller populations. Communities<br />
such as Bay Bulls, Bauline, Bell Isl<strong>and</strong>, <strong>and</strong> Witless Bay have<br />
seen declines or little change in their population compared to 1981,<br />
Economic Research <strong>and</strong> Analysis Division | www.economics.gov.nl.ca | 4
ut most show improvements from 2001 to 2006 due, in part, to<br />
new highway infrastructure <strong>and</strong> strong regional economic growth.<br />
<strong>Population</strong> Change <strong>and</strong> Headship Rates 2 for the<br />
<strong>Northeast</strong> <strong>Avalon</strong> Region by Age Group<br />
<strong>Household</strong>s<br />
In addition to trends in population, the change in households over<br />
time is valuable to planners <strong>and</strong> administrators. The number <strong>and</strong><br />
composition of households in the region can help to inform policies,<br />
involving transportation, water <strong>and</strong> sewer infrastructure, residential<br />
construction <strong>and</strong> recreation services among others.<br />
Table 2 illustrates the total number of households in the <strong>Northeast</strong><br />
<strong>Avalon</strong> Region according to the census conducted by Statistics<br />
Canada from 1981-2006.<br />
An increase in the <strong>Northeast</strong> <strong>Avalon</strong> Region population resulted in<br />
an increase in the number of households. However, declining births<br />
<strong>and</strong> aging of the population caused the average household size to<br />
* Headship Rate for the St. John's CMA<br />
decline. As a result, the number of households grew much faster<br />
than the population. For example, total population in the region<br />
increased by 17% between 1981 <strong>and</strong> 2006<br />
while the number of households increased<br />
C d E R h dA l<br />
by 62%. Most of these gains were in households<br />
headed by people 45 years of age or<br />
<strong>Avalon</strong> Region, 1981-2006<br />
older. This reflects the increasing age of the<br />
baby boomers <strong>and</strong> aging of the population<br />
in general.<br />
1981 1986 1991 1996 2001 2006<br />
Statistics Canada; Economic Research <strong>and</strong> Analysis Division, Department of <strong>Finance</strong><br />
Table 2 – Total Occupied Dwellings for the <strong>Northeast</strong><br />
Actual<br />
Change<br />
1981-2006<br />
Percentage<br />
Change<br />
1981-2006<br />
<strong>Household</strong>s 44,955 49,710 57,101 62,190 66,667 72,595 27,640 61.5%<br />
Average<br />
<strong>Household</strong> Size 3.5 3.4 3.1 2.9 2.7 2.6 -1.0 -27.4%<br />
Statistics Canada<br />
<strong>Population</strong> <strong>and</strong> <strong>Household</strong> <strong>Projections</strong><br />
for the <strong>Northeast</strong> <strong>Avalon</strong> Region<br />
2.<br />
The headship rate for each age group is simply the number of households<br />
headed by a person in this age group divided by the total number of people in<br />
that age group.<br />
5 | www.economics.gov.nl.ca | Economic Research <strong>and</strong> Analysis Division
Historical data for the age distribution of the head of each household<br />
in the <strong>Northeast</strong> <strong>Avalon</strong> Region are not available for each<br />
community in the region. However, statistics for the St. John’s<br />
Census Metropolitan Area (CMA) can be used to examine trends in<br />
the region. The St. John’s CMA includes all the communities in the<br />
<strong>Northeast</strong> <strong>Avalon</strong> Region with the exception of Holyrood <strong>and</strong> Bell<br />
Isl<strong>and</strong>.<br />
<strong>Population</strong> <strong>and</strong> <strong>Household</strong> <strong>Projections</strong><br />
for the <strong>Northeast</strong> <strong>Avalon</strong> Region<br />
The total number of households in the St. John’s CMA has increased<br />
by approximately 62% from 1981 to 2006, but the<br />
composition of total population <strong>and</strong> households in the area has<br />
shifted. As can be seen in Table 3 below, a significant increase was<br />
recorded in the number of households headed by people in the<br />
45 to 64 age groups while the number of households headed by<br />
people under 34 years declined. The trend toward smaller families<br />
(e.g. fewer children) <strong>and</strong> more single person dwellings were the<br />
main factors behind declining average household size. There are a<br />
number of factors behind the increase in single person households<br />
including growth in the number of divorced people <strong>and</strong> seniors<br />
living alone.<br />
Table 3 – <strong>Household</strong>s By Age of<br />
<strong>Household</strong> Head - St. John’s CMA<br />
1981 1991 1996 2001 2006<br />
Actual<br />
Change<br />
1981-2006<br />
Percentage<br />
Change<br />
1981-2006<br />
Under 25 2,670 2,935 2,640 2,925 2,910 240 9.0%<br />
25-34 12,250 13,100 12,525 11,065 11,155 -1,095 -8.9%<br />
35-44 11,675 14,080 15,405 15,745 15,560 3,885 33.3%<br />
45-54 7,340 9,480 12,100 14,575 15,890 8,550 116.5%<br />
55-64 6,320 6,595 7,460 9,260 12,350 6,030 95.4%<br />
65-74 5,050 5,655 5,820 6,190 7,090 2,040 40.4%<br />
75+ 2,600 3,380 4,220 5,070 5,700 3,100 119.2%<br />
Statistics Canada<br />
Economic Research <strong>and</strong> Analysis Division | www.economics.gov.nl.ca | 6
2.0 Methodology<br />
2.1 Assumptions<br />
This report involved projecting 5 year age cohorts by employing assumptions<br />
about cohort survival/retention rates <strong>and</strong> fertility rates.<br />
This projection method used information <strong>and</strong> assumptions about<br />
fertility, mortality <strong>and</strong> migration to determine population for each<br />
time period. Low, medium <strong>and</strong> high scenarios were produced for<br />
the region by varying the assumptions.<br />
2.1.1 Fertility Rates<br />
For the low scenario, fertility rates continue to decline from the<br />
<strong>Northeast</strong> <strong>Avalon</strong> Region rate of 1.3 in 2005 to 1.1 in 2026.<br />
For the medium scenario, fertility rates remain constant at the average<br />
historical levels at 1.3.<br />
For the high scenario, fertility rates increase from the current <strong>Northeast</strong><br />
<strong>Avalon</strong> Region rate of 1.3 in 2005 to 1.5 by 2026.<br />
2.1.2 Net Migration <strong>and</strong> Mortality Rates<br />
Assumptions regarding mortality <strong>and</strong> net-migration were combined<br />
into one variable labeled the cohort survival/retention rate.<br />
This rate includes the net effects of deaths <strong>and</strong> migration on each<br />
cohort. Each cohort, other than the 0 to 4 year olds, which is<br />
determined by fertility rates, was assigned a rate based on some<br />
combination of 20 year trends or recent trends.<br />
For the low scenario, future cohort survival/retention rates were<br />
projected to remain at 20 year historical levels.<br />
2.2 Rationale for Assumptions<br />
2.2.1 Fertility<br />
In the low scenario fertility rates are assumed to continue to decline.<br />
There are several rationales for possible future declines in the fertility<br />
rate. Individuals are having fewer children due to increased education<br />
<strong>and</strong> labour force participation of women, better birth control,<br />
changing social attitudes regarding gender equity <strong>and</strong> women having<br />
children later in life. In the medium scenario, fertility rates remain<br />
constant. This is quite plausible considering that they are the lowest<br />
in the country.<br />
An increase in the fertility rate in the <strong>Northeast</strong> <strong>Avalon</strong> Region is<br />
projected in the high scenario. One factor that may contribute to<br />
this increase is the growing incomes <strong>and</strong> economic opportunities in<br />
the region. All other provinces in Canada have a higher fertility rate<br />
than the <strong>Northeast</strong> <strong>Avalon</strong> Region <strong>and</strong> as incomes <strong>and</strong> employment<br />
increase, fertility rates could rise to rates experienced in other regions<br />
of the country. The high scenario assumes that the region’s fertility<br />
rate increases to coincide more closely with the rest of the country.<br />
2.2.2 Mortality <strong>and</strong> Net Migration (Cohort Survival/Retention)<br />
Historical levels of net migration in the region show that individuals<br />
leaving outweighed individuals migrating in during the 1991 to 2001<br />
period, but net in-migration occurred between 2001 <strong>and</strong> 2006. In<br />
the low scenario, the average of these historical migration trends<br />
are assumed to continue through the projected years as a result of<br />
the completion of major construction projects (e.g. oil projects) <strong>and</strong><br />
the propensity for the province’s skilled labour to migrate to other<br />
provinces.<br />
<strong>Population</strong> <strong>and</strong> <strong>Household</strong> <strong>Projections</strong><br />
for the <strong>Northeast</strong> <strong>Avalon</strong> Region<br />
For the medium scenario, future cohort survival/retention rates<br />
were a combination of recent trends <strong>and</strong> historical values.<br />
For the high scenario, future cohort survival/retention rates were<br />
assumed to continue recent trends.<br />
For the medium scenario, net migration rates were set halfway<br />
between historical averages (low scenario) <strong>and</strong> recent trends (high<br />
scenario). This increase may occur as a result of major construction<br />
projects in the region, increasing local job opportunities due to retirements,<br />
<strong>and</strong>/or the growing number of individuals who reside in the<br />
province but work elsewhere in the country.<br />
7 | www.economics.gov.nl.ca | Economic Research <strong>and</strong> Analysis Division
The high scenario assumes migration rates continue at recent<br />
trends (2001 to 2006). This scenario could unfold as several<br />
major projects are developed in the province <strong>and</strong> the number of<br />
people who reside in but work outside the province continues to<br />
grow.<br />
2.3 Description of <strong>Population</strong> Scenarios<br />
Below is a summary of the assumptions for each scenario presented<br />
in this report.<br />
<strong>Population</strong> <strong>and</strong> <strong>Household</strong> <strong>Projections</strong><br />
for the <strong>Northeast</strong> <strong>Avalon</strong> Region<br />
For the low scenario we combine a declining fertility rate <strong>and</strong> a<br />
cohort survival/retention rate based on historical data. The medium<br />
scenario includes a constant fertility rate <strong>and</strong> a cohort survival<br />
rate based on a combination of recent trends <strong>and</strong> historical data.<br />
The high scenario includes the assumptions of an increasing fertility<br />
rate <strong>and</strong> recent trends for cohort survival/retention.<br />
Table 4 – Scenario Descriptions<br />
Fertility Rate<br />
Cohort Survival/<br />
Retention<br />
Low Scenario 1.1 (decreasing) Historical<br />
Medium Scenario 1.3 (constant) Recent Trends/Historical<br />
High Scenario 1.5 (increasing) Recent Trends<br />
2.4 <strong>Household</strong> <strong>Projections</strong><br />
The population projections, in conjunction with 2006 headship<br />
rates, were used to project the number of households in the<br />
<strong>Northeast</strong> <strong>Avalon</strong> Region. <strong>Household</strong>s were projected by applying<br />
the 2006 age-specific headship rates to corresponding population<br />
age groups for all three population scenarios (high, medium <strong>and</strong><br />
low).<br />
Economic Research <strong>and</strong> Analysis Division | www.economics.gov.nl.ca | 8
3.0 <strong>Population</strong> <strong>and</strong> <strong>Household</strong> Projection Results<br />
3.1 <strong>Population</strong><br />
Three different population scenarios for the <strong>Northeast</strong> <strong>Avalon</strong><br />
Region were produced using various assumptions for fertility <strong>and</strong><br />
cohort survival/retention rates.<br />
Total <strong>Population</strong> <strong>Northeast</strong> <strong>Avalon</strong>, 1981 to 2026p<br />
Table 5 – Total Projected <strong>Population</strong> Under<br />
Three Scenarios<br />
<strong>Population</strong><br />
in 2006<br />
2011 2016 2021 2026<br />
Low Scenario 185,905 189,408 187,908 184,671 179,958<br />
Medium Scenario 185,905 192,616 197,466 199,944 200,820<br />
High Scenario 185,905 197,518 205,894 213,738 220,760<br />
Table 5 presents three different population projection scenarios for<br />
the <strong>Northeast</strong> <strong>Avalon</strong> Region. It shows that the region’s population<br />
will grow over the projection period in both the medium <strong>and</strong> high<br />
scenarios. However, the low scenario projects a gradual decrease<br />
in the population over the 2006-2026 period.<br />
The high scenario’s assumptions of a high fertility rate <strong>and</strong> high net<br />
in-migration increase the population of the region from 185,525<br />
in 2006 to 220,760 in 2026. This represents an increase of approximately<br />
19% over the last census count in 2006.<br />
The medium scenario projects a smaller increase in the population.<br />
A constant fertility rate <strong>and</strong> a combination of historical <strong>and</strong><br />
recent trends for migration increase the population to 200,820<br />
in 2026, representing an increase of about 8% over the 2006<br />
Census.<br />
Statistics Canada; Economic Research <strong>and</strong> Analysis Division, Department of <strong>Finance</strong><br />
the projected time period. The low scenario gradually decreases the<br />
population to roughly 179,960 in 2026, a decline of about 3% from<br />
2006. However, by 2011, there is a slight increase of approximately<br />
2% before the population begins to decline.<br />
3.2 <strong>Household</strong>s<br />
Using the population projections <strong>and</strong> the 2006 historical headship<br />
rates for the region the number of households are projected under<br />
each of the three scenarios from 2006 to 2026. Table 6 shows that<br />
the region’s households will grow in all three scenarios. However,<br />
there is a slight decrease projected between 2021 <strong>and</strong> 2026 under<br />
the low scenario.<br />
<strong>Population</strong> <strong>and</strong> <strong>Household</strong> <strong>Projections</strong><br />
for the <strong>Northeast</strong> <strong>Avalon</strong> Region<br />
A decline in the fertility rate <strong>and</strong> historical cohort/retention rates<br />
project a modest decrease in the population of the region over<br />
9 | www.economics.gov.nl.ca | Economic Research <strong>and</strong> Analysis Division
Table 6 – Total Projected <strong>Household</strong>s<br />
<strong>Population</strong> Change 2006 to 2026p by Age Group<br />
<strong>Household</strong>s<br />
in 2006<br />
2011 2016 2021 2026<br />
Low Scenario 72,651 76,487 78,182 78,552 78,002<br />
Medium Scenario 72,651 77,692 82,082 84,766 86,361<br />
High Scenario 72,651 80,000 85,754 90,359 94,095<br />
<strong>Population</strong> <strong>and</strong> <strong>Household</strong> <strong>Projections</strong><br />
for the <strong>Northeast</strong> <strong>Avalon</strong> Region<br />
The number of households in the region grows at a higher rate<br />
than the population under all three scenarios. The high scenario<br />
shows population growth of 19% between 2006 <strong>and</strong> 2026 but<br />
the number of households increase by 30%. Under the medium<br />
scenario, households increase by approximately 19% while the<br />
population increases by about 8%. Under the low scenario,<br />
households increase by 7% while the population decreases by<br />
approximately 3%. There is also significant aging of the population<br />
with more <strong>and</strong> more of the primary household maintainers<br />
over the age of 60.<br />
The increase in households is due to the population gain in age<br />
groups 55 years <strong>and</strong> over where headship rates are the highest.<br />
At the same time the size of the population less than 25 years,<br />
Total <strong>Household</strong>s <strong>Northeast</strong> <strong>Avalon</strong>, 1981 to 2026p<br />
Statistics Canada; Economic Research <strong>and</strong> Analysis Division, Department of <strong>Finance</strong><br />
where headship rates are very low, is actually declining. The chart<br />
above shows the population gains in the 55 <strong>and</strong> over age groups.<br />
The growth in older age groups is due to aging baby boomers while<br />
low fertility rates <strong>and</strong> declining births reduce younger age groups.<br />
The increase in the older age groups occurs in all scenarios while<br />
the number of households headed by younger age groups decrease<br />
under all three scenarios.<br />
As household formation outpaces population growth there is a natural<br />
decline in average household size. This occurs as the incidences<br />
of one-person <strong>and</strong> two-person households increase in the region.<br />
As the baby boomers continue to age <strong>and</strong> their children mature <strong>and</strong><br />
leave home, two-person households become more common. In<br />
addition, the death of a spouse in an older household will result in<br />
more one-person households as the population ages.<br />
Statistics Canada; Economic Research <strong>and</strong> Analysis Division, Department of <strong>Finance</strong><br />
Economic Research <strong>and</strong> Analysis Division | www.economics.gov.nl.ca | 10
4.0 Summary<br />
History<br />
<strong>Population</strong> in the <strong>Northeast</strong> <strong>Avalon</strong> Region increased from 1981<br />
to 2006 while the population of the province decreased. Migration<br />
of generally young people from rural areas for educational <strong>and</strong><br />
economic opportunities has favoured the <strong>Northeast</strong> <strong>Avalon</strong> Region.<br />
Most of the population gains in the <strong>Northeast</strong> <strong>Avalon</strong> Region from<br />
1981 to 2006 were in suburban areas. New infrastructure <strong>and</strong> the<br />
preference for suburban lifestyles were the driving forces behind the<br />
gains in suburban population. In the 1980s, the downtown arterial<br />
led to population gains in the City of Mount Pearl <strong>and</strong> the completion<br />
of the Outer Ring Road in 1998 greatly enhanced commuter<br />
access to Conception Bay South <strong>and</strong> Paradise.<br />
The number of households has increased along with the region’s<br />
population. However, the number of households has been growing<br />
at a much faster rate than the population. An aging population<br />
<strong>and</strong> an increased prevalence of single person households<br />
were the main factors behind the stronger growth in the number of<br />
households.<br />
Future<br />
<strong>Population</strong><br />
Future population growth of the <strong>Northeast</strong> <strong>Avalon</strong> Region will depend<br />
on fertility <strong>and</strong> migration trends. Medium <strong>and</strong> high scenarios<br />
for the region predict further population growth over the 2006 to<br />
2026 period with total growth of 8% <strong>and</strong> 19% respectively. The<br />
low scenario predicts modest population decline as the population<br />
ages. The population continues to age under all scenarios due to<br />
low fertility rates <strong>and</strong> aging baby boomers.<br />
<strong>Household</strong>s<br />
The number of households in the region grows over the projection<br />
period under all three scenarios as aging of the population con-<br />
tinues to reduce the average household size. As a result, the rate of<br />
household growth continues to be higher than the rate of population<br />
growth. <strong>Household</strong> growth is modest under the low scenario (8%),<br />
but significant under the high scenario (30%). <strong>Household</strong> formation<br />
<strong>and</strong> population growth are projected to continue in areas with l<strong>and</strong><br />
available for development within short commuting distances to St.<br />
John's. Recent growth centres such as Torbay, Paradise, <strong>and</strong> Conception<br />
Bay South are expected to have continued growth in their<br />
populations in the coming years.<br />
<strong>Population</strong> <strong>and</strong> <strong>Household</strong> <strong>Projections</strong><br />
for the <strong>Northeast</strong> <strong>Avalon</strong> Region<br />
11 | www.economics.gov.nl.ca | Economic Research <strong>and</strong> Analysis Division
<strong>Population</strong> <strong>and</strong> <strong>Household</strong> <strong>Projections</strong><br />
for the <strong>Northeast</strong> <strong>Avalon</strong> Region<br />
Economic Research <strong>and</strong> Analysis Division | www.economics.gov.nl.ca | 12
5.0 Glossary<br />
Baby Boomer: A person born between 1947 - 1966. This was<br />
a 20 year period of higher than normal fertility <strong>and</strong> birth rates<br />
throughout the industrial world.<br />
Cohort: A group of subjects from a given population defined by<br />
experiencing an event (typically birth) in a particular time span.<br />
Cohort Survival/Retention Rate: The percentage of each age group<br />
that survives/is retained over a 5 year period. For example, if there<br />
are 1,000 people in the 15-24 age group (cohort) in 2001, <strong>and</strong><br />
there are 800 in this same cohort (20-24 age group) in 2006, the<br />
survival/retention rate for that cohort is simply 800/1000 = 80%.<br />
Demographics: Characteristics of the population, such as size, age<br />
distribution, vital statistics (i.e., births, deaths), geographic dispersion<br />
<strong>and</strong> mobility (i.e., migration).<br />
Headship Rate: The number of households headed by a person in<br />
a particular age group divided by the total number of people in<br />
that age group.<br />
Natural <strong>Population</strong> Change: The number of births minus the number<br />
of deaths in an area.<br />
Net migration: The difference between the number of individuals<br />
coming into an area (in-migration) <strong>and</strong> the number of people leaving<br />
an area (out-migration) over a period of time.<br />
<strong>Population</strong> <strong>and</strong> <strong>Household</strong> <strong>Projections</strong><br />
for the <strong>Northeast</strong> <strong>Avalon</strong> Region<br />
St. John’s CMA: Includes all the communities within the <strong>Northeast</strong><br />
<strong>Avalon</strong> Region with the exception of Holyrood <strong>and</strong> Bell Isl<strong>and</strong>.<br />
Total Fertility Rate: The number of births per women of childbearing<br />
age (15-49) at current fertility rates.<br />
13 | www.economics.gov.nl.ca | Economic Research <strong>and</strong> Analysis Division
<strong>Population</strong> <strong>and</strong> <strong>Household</strong> <strong>Projections</strong><br />
for the <strong>Northeast</strong> <strong>Avalon</strong> Region<br />
Economic Research <strong>and</strong> Analysis Division | www.economics.gov.nl.ca | 14
<strong>Population</strong> <strong>and</strong> <strong>Household</strong> <strong>Projections</strong><br />
for the <strong>Northeast</strong> <strong>Avalon</strong> Region<br />
6.0 Appendices<br />
15 | www.economics.gov.nl.ca | Economic Research <strong>and</strong> Analysis Division
<strong>Population</strong> <strong>and</strong> <strong>Household</strong> <strong>Projections</strong><br />
for the <strong>Northeast</strong> <strong>Avalon</strong> Region<br />
Economic Research <strong>and</strong> Analysis Division | www.economics.gov.nl.ca | 16
Appendix A - <strong>Population</strong> <strong>Projections</strong><br />
<strong>Population</strong> <strong>Projections</strong> - <strong>Northeast</strong> <strong>Avalon</strong> Regional Plan Area Scenario 1 - Low<br />
<strong>Population</strong> by Gender <strong>and</strong> Five Year Age Groups, 1986 to 2026<br />
Total 0 - 4 5 - 9 10 - 14 15 - 19 20 - 24 25 -29 30 - 34 35 - 39 40 - 44 45 - 49 50 - 54 55 - 59 60 - 64 65- 69 70 - 74 75 - 79 80 - 84 85 - 89 90 +<br />
1986 168,665 12,630 13,325 14,105 14,950 17,275 15,850 14,865 13,440 10,555 7,815 6,740 6,290 5,645 5,165 4,300 2,835 1,535 900 445<br />
1991 178,210 12,070 12,900 13,495 14,705 16,665 16,830 15,860 14,895 13,335 10,520 7,730 6,470 5,950 5,235 4,540 3,530 2,065 885 530<br />
1996 179,675 10,365 12,095 13,015 13,730 15,220 14,670 15,730 15,410 14,715 13,055 10,135 7,300 6,105 5,375 4,645 3,735 2,570 1,285 520<br />
2001 177,975 9,265 10,220 11,905 12,940 14,370 12,575 13,435 15,210 15,030 14,425 12,665 9,740 6,970 5,625 4,820 3,815 2,725 1,575 665<br />
2006 185,845 9,370 9,895 10,700 12,490 14,400 13,130 13,085 13,870 15,585 15,195 14,400 12,585 9,585 6,665 5,180 4,095 2,995 1,785 835<br />
2011 189,410 8,961 9,718 10,127 11,086 13,905 13,246 13,024 13,103 13,912 15,508 15,076 14,067 12,249 9,013 6,060 4,313 3,140 1,929 973<br />
2016 187,910 8,437 9,120 9,805 10,279 11,723 12,472 12,832 12,812 12,941 13,759 15,170 14,541 13,446 11,381 7,979 4,971 3,200 1,955 1,087<br />
2021 184,670 7,676 8,563 9,159 9,900 10,748 10,592 12,131 12,618 12,607 12,765 13,449 14,624 13,894 12,497 10,080 6,568 3,681 1,978 1,140<br />
2026 179,957 6,824 7,801 8,598 9,259 10,310 9,847 10,409 11,961 12,412 12,428 12,493 12,987 13,996 12,905 11,080 8,300 4,885 2,294 1,168<br />
Males 0 - 4 5 - 9 10 - 14 15 - 19 20 - 24 25 -29 30 - 34 35 - 39 40 - 44 45 - 49 50 - 54 55 - 59 60 - 64 65- 69 70 - 74 75 - 79 80 - 84 85 - 89 90 +<br />
1986 82,410 6,460 6,825 7,295 7,515 8,400 7,660 7,250 6,625 5,235 3,935 3,335 3,030 2,760 2,340 1,775 1,095 500 245 130<br />
1991 86,875 6,075 6,620 6,935 7,570 8,015 8,160 7,680 7,325 6,575 5,240 3,935 3,180 2,835 2,445 1,945 1,320 675 240 105<br />
1996 86,600 5,265 6,125 6,655 6,950 7,400 7,050 7,430 7,385 7,180 6,400 4,980 3,645 2,940 2,435 2,030 1,440 825 365 100<br />
2001 85,180 4,760 5,175 6,045 6,545 6,865 6,050 6,345 7,170 7,185 6,970 6,195 4,780 3,405 2,635 2,075 1,535 890 425 130<br />
2006 88,860 4,790 5,100 5,430 6,265 6,890 6,210 6,285 6,530 7,375 7,250 6,965 6,110 4,660 3,195 2,370 1,640 1,115 510 170<br />
2011 90,297 4,570 4,996 5,226 5,568 6,601 6,254 6,145 6,298 6,549 7,316 7,187 6,772 5,872 4,260 2,844 1,842 1,148 653 196<br />
2016 88,925 4,303 4,680 5,048 5,245 5,574 5,878 5,983 6,037 6,208 6,473 7,148 6,885 6,388 5,245 3,585 2,155 1,208 628 254<br />
2021 86,648 3,915 4,395 4,704 5,044 5,183 4,975 5,680 5,873 5,929 6,116 6,318 6,849 6,491 5,707 4,417 2,715 1,413 661 263<br />
2026 83,597 3,480 4,005 4,416 4,700 4,972 4,679 4,851 5,603 5,764 5,837 5,979 6,063 6,469 5,794 4,800 3,343 1,784 781 277<br />
Females 0 - 4 5 - 9 10 - 14 15 - 19 20 - 24 25 -29 30 - 34 35 - 39 40 - 44 45 - 49 50 - 54 55 - 59 60 - 64 65- 69 70 - 74 75 - 79 80 - 84 85 - 89 90 +<br />
1986 86,255 6,170 6,500 6,810 7,435 8,875 8,190 7,615 6,815 5,320 3,880 3,405 3,260 2,885 2,825 2,525 1,740 1,035 655 315<br />
1991 91,335 5,995 6,280 6,560 7,135 8,650 8,670 8,180 7,570 6,760 5,280 3,795 3,290 3,115 2,790 2,595 2,210 1,390 645 425<br />
1996 93,075 5,100 5,970 6,360 6,780 7,820 7,620 8,300 8,025 7,535 6,655 5,155 3,655 3,165 2,940 2,615 2,295 1,745 920 420<br />
2001 92,795 4,505 5,045 5,860 6,395 7,505 6,525 7,090 8,040 7,845 7,455 6,470 4,960 3,565 2,990 2,745 2,280 1,835 1,150 535<br />
2006 96,985 4,580 4,795 5,270 6,225 7,510 6,920 6,800 7,340 8,210 7,945 7,435 6,475 4,925 3,470 2,810 2,455 1,880 1,275 665<br />
2011 99,113 4,391 4,722 4,901 5,518 7,304 6,992 6,879 6,805 7,363 8,192 7,889 7,295 6,377 4,753 3,216 2,471 1,992 1,276 777<br />
2016 98,985 4,134 4,440 4,757 5,034 6,149 6,594 6,849 6,775 6,733 7,286 8,022 7,656 7,058 6,136 4,394 2,816 1,992 1,327 833<br />
2021 98,022 3,761 4,168 4,455 4,856 5,565 5,617 6,451 6,745 6,678 6,649 7,131 7,775 7,403 6,790 5,663 3,853 2,268 1,317 877<br />
2026 96,360 3,344 3,796 4,182 4,559 5,338 5,168 5,558 6,358 6,648 6,591 6,514 6,924 7,527 7,111 6,280 4,957 3,101 1,513 891<br />
<strong>Population</strong> <strong>and</strong> <strong>Household</strong> <strong>Projections</strong><br />
for the <strong>Northeast</strong> <strong>Avalon</strong> Region<br />
17 | www.economics.gov.nl.ca | Economic Research <strong>and</strong> Analysis Division
<strong>Population</strong> <strong>Projections</strong> - <strong>Northeast</strong> <strong>Avalon</strong> Regional Plan Area Scenario 2 - Medium<br />
<strong>Population</strong> <strong>and</strong> <strong>Household</strong> <strong>Projections</strong><br />
for the <strong>Northeast</strong> <strong>Avalon</strong> Region<br />
<strong>Population</strong> by Gender <strong>and</strong> Five Year Age Groups, 1986 to 2026<br />
Total 0 - 4 5 - 9 10 - 14 15 - 19 20 - 24 25 -29 30 - 34 35 - 39 40 - 44 45 - 49 50 - 54 55 - 59 60 - 64 65- 69 70 - 74 75 - 79 80 - 84 85 - 89 90 +<br />
1986 168,665 12,630 13,325 14,105 14,950 17,275 15,850 14,865 13,440 10,555 7,815 6,740 6,290 5,645 5,165 4,300 2,835 1,535 900 445<br />
1991 178,210 12,070 12,900 13,495 14,705 16,665 16,830 15,860 14,895 13,335 10,520 7,730 6,470 5,950 5,235 4,540 3,530 2,065 885 530<br />
1996 179,675 10,365 12,095 13,015 13,730 15,220 14,670 15,730 15,410 14,715 13,055 10,135 7,300 6,105 5,375 4,645 3,735 2,570 1,285 520<br />
2001 177,975 9,265 10,220 11,905 12,940 14,370 12,575 13,435 15,210 15,030 14,425 12,665 9,740 6,970 5,625 4,820 3,815 2,725 1,575 665<br />
2006 185,845 9,370 9,895 10,700 12,490 14,400 13,130 13,085 13,870 15,585 15,195 14,400 12,585 9,585 6,665 5,180 4,095 2,995 1,785 835<br />
2011 192,616 9,355 9,906 10,274 11,192 14,090 13,517 13,369 13,453 14,129 15,661 15,241 14,257 12,434 9,108 6,150 4,388 3,175 1,944 973<br />
2016 197,466 9,374 9,784 10,034 10,418 12,300 14,082 13,328 13,530 13,714 14,167 15,638 15,089 14,085 11,868 8,372 5,187 3,355 2,066 1,075<br />
2021 199,945 9,163 9,787 9,847 10,105 11,213 12,445 13,754 13,457 13,716 13,715 14,071 15,403 14,792 13,382 10,792 7,048 3,935 2,150 1,170<br />
2026 200,818 8,714 9,567 9,839 9,917 10,823 11,581 12,245 13,833 13,600 13,686 13,604 13,855 15,103 14,017 12,169 9,103 5,363 2,558 1,241<br />
Males 0 - 4 5 - 9 10 - 14 15 - 19 20 - 24 25 -29 30 - 34 35 - 39 40 - 44 45 - 49 50 - 54 55 - 59 60 - 64 65- 69 70 - 74 75 - 79 80 - 84 85 - 89 90 +<br />
1986 82,410 6,460 6,825 7,295 7,515 8,400 7,660 7,250 6,625 5,235 3,935 3,335 3,030 2,760 2,340 1,775 1,095 500 245 130<br />
1991 86,875 6,075 6,620 6,935 7,570 8,015 8,160 7,680 7,325 6,575 5,240 3,935 3,180 2,835 2,445 1,945 1,320 675 240 105<br />
1996 86,600 5,265 6,125 6,655 6,950 7,400 7,050 7,430 7,385 7,180 6,400 4,980 3,645 2,940 2,435 2,030 1,440 825 365 100<br />
2001 85,180 4,760 5,175 6,045 6,545 6,865 6,050 6,345 7,170 7,185 6,970 6,195 4,780 3,405 2,635 2,075 1,535 890 425 130<br />
2006 88,860 4,790 5,100 5,430 6,265 6,890 6,210 6,285 6,530 7,375 7,250 6,965 6,110 4,660 3,195 2,370 1,640 1,115 510 170<br />
2011 91,849 4,771 5,094 5,298 5,626 6,696 6,404 6,302 6,452 6,665 7,369 7,265 6,859 5,956 4,319 2,893 1,871 1,154 659 196<br />
2016 93,768 4,781 5,038 5,150 5,332 5,937 6,631 6,269 6,337 6,639 6,670 7,336 7,119 6,695 5,533 3,859 2,243 1,276 667 256<br />
2021 94,315 4,673 5,047 5,059 5,147 5,499 5,932 6,438 6,288 6,483 6,634 6,606 7,162 6,891 6,168 4,824 2,968 1,495 721 280<br />
2026 93,987 4,444 4,932 5,063 5,057 5,289 5,587 5,787 6,441 6,405 6,466 6,565 6,451 6,937 6,330 5,364 3,712 1,979 865 313<br />
Females 0 - 4 5 - 9 10 - 14 15 - 19 20 - 24 25 -29 30 - 34 35 - 39 40 - 44 45 - 49 50 - 54 55 - 59 60 - 64 65- 69 70 - 74 75 - 79 80 - 84 85 - 89 90 +<br />
1986 86,255 6,170 6,500 6,810 7,435 8,875 8,190 7,615 6,815 5,320 3,880 3,405 3,260 2,885 2,825 2,525 1,740 1,035 655 315<br />
1991 91,335 5,995 6,280 6,560 7,135 8,650 8,670 8,180 7,570 6,760 5,280 3,795 3,290 3,115 2,790 2,595 2,210 1,390 645 425<br />
1996 93,075 5,100 5,970 6,360 6,780 7,820 7,620 8,300 8,025 7,535 6,655 5,155 3,655 3,165 2,940 2,615 2,295 1,745 920 420<br />
2001 92,795 4,505 5,045 5,860 6,395 7,505 6,525 7,090 8,040 7,845 7,455 6,470 4,960 3,565 2,990 2,745 2,280 1,835 1,150 535<br />
2006 96,985 4,580 4,795 5,270 6,225 7,510 6,920 6,800 7,340 8,210 7,945 7,435 6,475 4,925 3,470 2,810 2,455 1,880 1,275 665<br />
2011 100,767 4,584 4,812 4,976 5,566 7,394 7,113 7,067 7,001 7,464 8,292 7,976 7,398 6,478 4,789 3,257 2,517 2,021 1,285 777<br />
2016 103,698 4,593 4,746 4,884 5,086 6,363 7,451 7,059 7,193 7,075 7,497 8,302 7,970 7,390 6,335 4,513 2,944 2,079 1,399 819<br />
2021 105,630 4,490 4,740 4,788 4,958 5,714 6,513 7,316 7,169 7,233 7,081 7,465 8,241 7,901 7,214 5,968 4,080 2,440 1,429 890<br />
2026 106,831 4,270 4,635 4,776 4,860 5,534 5,994 6,458 7,392 7,195 7,220 7,039 7,404 8,166 7,687 6,805 5,391 3,384 1,693 928<br />
Economic Research <strong>and</strong> Analysis Division | www.economics.gov.nl.ca | 18
<strong>Population</strong> <strong>Projections</strong> - <strong>Northeast</strong> <strong>Avalon</strong> Regional Plan Area Scenario 3 - High<br />
<strong>Population</strong> by Gender <strong>and</strong> Five Year Age Groups, 1986 to 2026<br />
Total 0 - 4 5 - 9 10 - 14 15 - 19 20 - 24 25 -29 30 - 34 35 - 39 40 - 44 45 - 49 50 - 54 55 - 59 60 - 64 65- 69 70 - 74 75 - 79 80 - 84 85 - 89 90 +<br />
1986 168,665 12,630 13,325 14,105 14,950 17,275 15,850 14,865 13,440 10,555 7,815 6,740 6,290 5,645 5,165 4,300 2,835 1,535 900 445<br />
1991 178,210 12,070 12,900 13,495 14,705 16,665 16,830 15,860 14,895 13,335 10,520 7,730 6,470 5,950 5,235 4,540 3,530 2,065 885 530<br />
1996 179,675 10,365 12,095 13,015 13,730 15,220 14,670 15,730 15,410 14,715 13,055 10,135 7,300 6,105 5,375 4,645 3,735 2,570 1,285 520<br />
2001 177,975 9,265 10,220 11,905 12,940 14,370 12,575 13,435 15,210 15,030 14,425 12,665 9,740 6,970 5,625 4,820 3,815 2,725 1,575 665<br />
2006 185,845 9,370 9,895 10,700 12,490 14,400 13,130 13,085 13,870 15,585 15,195 14,400 12,585 9,585 6,665 5,180 4,095 2,995 1,785 835<br />
2011 197,517 9,975 10,239 10,137 10,836 13,937 15,579 13,319 13,993 14,655 15,947 15,225 14,582 12,758 9,445 6,226 4,460 3,210 1,998 996<br />
2016 205,895 10,672 10,627 10,349 10,081 11,604 14,877 15,166 13,940 14,550 14,851 15,890 15,298 14,650 12,459 8,795 5,324 3,487 2,160 1,115<br />
2021 213,736 10,839 11,428 10,706 10,355 10,868 12,783 14,735 15,622 14,460 14,730 14,797 15,932 15,333 14,266 11,621 7,511 4,177 2,354 1,219<br />
2026 220,762 10,668 11,651 11,526 10,746 11,199 12,251 12,883 15,179 16,205 14,642 14,680 14,843 15,993 14,902 13,322 9,945 5,926 2,861 1,340<br />
Males 0 - 4 5 - 9 10 - 14 15 - 19 20 - 24 25 -29 30 - 34 35 - 39 40 - 44 45 - 49 50 - 54 55 - 59 60 - 64 65- 69 70 - 74 75 - 79 80 - 84 85 - 89 90 +<br />
1986 82,410 6,460 6,825 7,295 7,515 8,400 7,660 7,250 6,625 5,235 3,935 3,335 3,030 2,760 2,340 1,775 1,095 500 245 130<br />
1991 86,875 6,075 6,620 6,935 7,570 8,015 8,160 7,680 7,325 6,575 5,240 3,935 3,180 2,835 2,445 1,945 1,320 675 240 105<br />
1996 86,600 5,265 6,125 6,655 6,950 7,400 7,050 7,430 7,385 7,180 6,400 4,980 3,645 2,940 2,435 2,030 1,440 825 365 100<br />
2001 85,180 4,760 5,175 6,045 6,545 6,865 6,050 6,345 7,170 7,185 6,970 6,195 4,780 3,405 2,635 2,075 1,535 890 425 130<br />
2006 88,860 4,790 5,100 5,430 6,265 6,890 6,210 6,285 6,530 7,375 7,250 6,965 6,110 4,660 3,195 2,370 1,640 1,115 510 170<br />
2011 94,298 5,087 5,299 5,220 5,470 6,791 7,448 6,222 6,676 7,047 7,568 7,206 6,942 6,113 4,500 2,910 1,835 1,128 623 213<br />
2016 98,009 5,443 5,493 5,341 5,167 5,690 7,220 7,160 6,450 7,075 7,154 7,498 7,112 6,888 5,867 4,048 2,236 1,255 649 263<br />
2021 101,299 5,528 5,896 5,516 5,313 5,380 6,188 7,105 7,290 6,812 7,187 7,106 7,396 7,045 6,601 5,265 3,110 1,544 735 282<br />
2026 104,136 5,441 6,008 5,931 5,513 5,587 5,964 6,182 7,242 7,696 6,924 7,152 7,021 7,343 6,740 5,918 4,049 2,159 934 332<br />
Females 0 - 4 5 - 9 10 - 14 15 - 19 20 - 24 25 -29 30 - 34 35 - 39 40 - 44 45 - 49 50 - 54 55 - 59 60 - 64 65- 69 70 - 74 75 - 79 80 - 84 85 - 89 90 +<br />
1986 86,255 6,170 6,500 6,810 7,435 8,875 8,190 7,615 6,815 5,320 3,880 3,405 3,260 2,885 2,825 2,525 1,740 1,035 655 315<br />
1991 91,335 5,995 6,280 6,560 7,135 8,650 8,670 8,180 7,570 6,760 5,280 3,795 3,290 3,115 2,790 2,595 2,210 1,390 645 425<br />
1996 93,075 5,100 5,970 6,360 6,780 7,820 7,620 8,300 8,025 7,535 6,655 5,155 3,655 3,165 2,940 2,615 2,295 1,745 920 420<br />
2001 92,795 4,505 5,045 5,860 6,395 7,505 6,525 7,090 8,040 7,845 7,455 6,470 4,960 3,565 2,990 2,745 2,280 1,835 1,150 535<br />
2006 96,985 4,580 4,795 5,270 6,225 7,510 6,920 6,800 7,340 8,210 7,945 7,435 6,475 4,925 3,470 2,810 2,455 1,880 1,275 665<br />
2011 103,219 4,888 4,940 4,917 5,366 7,146 8,131 7,097 7,317 7,608 8,379 8,019 7,640 6,645 4,945 3,316 2,625 2,082 1,375 783<br />
2016 107,886 5,229 5,134 5,008 4,914 5,914 7,657 8,006 7,490 7,475 7,697 8,392 8,186 7,762 6,592 4,747 3,088 2,232 1,511 852<br />
2021 112,437 5,311 5,532 5,190 5,042 5,488 6,595 7,630 8,332 7,648 7,543 7,691 8,536 8,288 7,665 6,356 4,401 2,633 1,619 937<br />
2026 116,626 5,227 5,643 5,595 5,233 5,612 6,287 6,701 7,937 8,509 7,718 7,528 7,822 8,650 8,162 7,404 5,896 3,767 1,927 1,008<br />
<strong>Population</strong> <strong>and</strong> <strong>Household</strong> <strong>Projections</strong><br />
for the <strong>Northeast</strong> <strong>Avalon</strong> Region<br />
19 | www.economics.gov.nl.ca | Economic Research <strong>and</strong> Analysis Division
<strong>Population</strong> <strong>and</strong> <strong>Household</strong> <strong>Projections</strong><br />
for the <strong>Northeast</strong> <strong>Avalon</strong> Region<br />
Economic Research <strong>and</strong> Analysis Division | www.economics.gov.nl.ca | 20
Appendix B - <strong>Household</strong> <strong>Projections</strong><br />
Scenario 1 - Low<br />
<strong>Household</strong> <strong>Projections</strong> - <strong>Northeast</strong> <strong>Avalon</strong> Regional Plan Area<br />
Primary <strong>Household</strong> Maintainer by Five Year Age Groups, 2006 to 2026<br />
Total < 25 25 - 34 35 - 44 45 - 54 55 - 64 65 - 74 75 +<br />
2006 72,651 2,984 11,307 15,896 16,367 12,821 7,388 5,888<br />
2011 76,487 2,822 11,324 14,601 16,854 15,153 9,410 6,323<br />
2016 78,182 2,587 10,903 13,918 15,910 16,034 11,962 6,868<br />
2021 78,552 2,412 9,792 13,590 14,447 16,251 13,875 8,185<br />
2026 78,002 2,242 8,730 13,123 13,733 15,334 14,672 10,168<br />
Scenario 2 - Medium<br />
<strong>Household</strong> <strong>Projections</strong> - <strong>Northeast</strong> <strong>Avalon</strong> Regional Plan Area<br />
Primary <strong>Household</strong> Maintainer by Five Year Age Groups, 2006 to 2026<br />
Total < 25 25 - 34 35 - 44 45 - 54 55 - 64 65 - 74 75 +<br />
2006 72,651 2,984 11,307 15,896 16,367 12,821 7,388 5,888<br />
2011 77,692 2,876 11,590 14,907 17,022 15,365 9,535 6,397<br />
2016 82,082 2,719 11,814 14,729 16,382 16,703 12,574 7,161<br />
2021 84,766 2,622 11,293 14,652 15,333 17,173 14,921 8,772<br />
2026 86,361 2,556 10,277 14,782 15,068 16,428 16,073 11,177<br />
Scenario 3 - High<br />
<strong>Household</strong> <strong>Projections</strong> - <strong>Northeast</strong> <strong>Avalon</strong> Regional Plan Area<br />
Primary <strong>Household</strong> Maintainer by Five Year Age Groups, 2006 to 2026<br />
Total < 25 25 - 34 35 - 44 45 - 54 55 - 64 65 - 74 75 +<br />
2006 72,651 2,984 11,307 15,896 16,367 12,821 7,388 5,888<br />
2011 80,000 2,887 12,459 15,506 17,176 15,705 9,794 6,473<br />
2016 85,754 2,788 12,961 15,393 16,964 17,062 13,226 7,360<br />
2021 90,359 2,832 11,878 16,212 16,367 17,730 16,019 9,321<br />
2026 94,095 2,914 10,849 16,965 16,214 17,543 17,347 12,263<br />
<strong>Population</strong> <strong>and</strong> <strong>Household</strong> <strong>Projections</strong><br />
for the <strong>Northeast</strong> <strong>Avalon</strong> Region<br />
21 | www.economics.gov.nl.ca | Economic Research <strong>and</strong> Analysis Division
<strong>Population</strong> <strong>and</strong> <strong>Household</strong> <strong>Projections</strong><br />
for the <strong>Northeast</strong> <strong>Avalon</strong> Region<br />
Economic Research <strong>and</strong> Analysis Division | www.economics.gov.nl.ca | 22
Appendix C - Births, Deaths <strong>and</strong> Natural <strong>Population</strong> Change<br />
Births, Deaths <strong>and</strong> Natural<br />
<strong>Population</strong> Change -<br />
<strong>Northeast</strong> <strong>Avalon</strong> Regional Plan<br />
Area, 1991 to 2005<br />
Births Deaths<br />
Natural<br />
<strong>Population</strong><br />
Change<br />
1991 2,548 1,224 1,325<br />
1992 2,342 1,209 1,134<br />
1993 2,241 1,169 1,073<br />
1994 2,120 1,274 847<br />
1995 2,054 1,249 805<br />
1996 2,058 1,219 839<br />
1997 2,042 1,279 764<br />
1998 1,867 1,394 473<br />
1999 1,766 1,274 492<br />
2000 1,905 1,324 581<br />
2001 1,855 1,314 541<br />
2002 1,785 1,285 500<br />
2003 1,861 1,325 536<br />
2004 1,872 1,326 546<br />
2005 1,877 1,387 490<br />
Community Accounts<br />
<strong>Population</strong> <strong>and</strong> <strong>Household</strong> <strong>Projections</strong><br />
for the <strong>Northeast</strong> <strong>Avalon</strong> Region<br />
23 | www.economics.gov.nl.ca | Economic Research <strong>and</strong> Analysis Division
<strong>Population</strong> <strong>and</strong> <strong>Household</strong> <strong>Projections</strong><br />
<strong>Northeast</strong> <strong>Avalon</strong> Region<br />
Economics <strong>and</strong> Statistics Branch<br />
Department of <strong>Finance</strong><br />
Tel: (709) 729-3255<br />
Fax: (709) 729-6944<br />
E-mail: infoera@gov.nl.ca<br />
www.economics.gov.nl.ca