download PPT
download PPT
download PPT

Create successful ePaper yourself
Turn your PDF publications into a flip-book with our unique Google optimized e-Paper software.
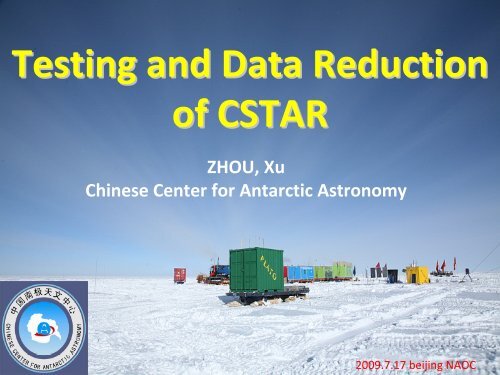
Testing and Data Reduction<br />
of CSTAR<br />
ZHOU, Xu<br />
Chinese Center for Antarctic Astronomy<br />
2009.7.17 beijing NAOC
Chinese Small Telescope Array (CSTAR)<br />
• 4 telescopes with diameter 15cm, 1Kx1K CCD<br />
each, 5x5 square degrees view, all point to the<br />
south pole (near the zenith ).<br />
• With g, r, i and none filters, without any<br />
mechanical moveable instrument.<br />
• Constant observation for more than 4 months,<br />
take pictures every 20s.
Science Purposes<br />
• Site Testing: Transparency, background light,<br />
cloud, etc.<br />
• Statistic of the variables in this area.<br />
• Variables with photometer and color, etc.<br />
• Light curves of variables<br />
• SNe, Novae, Orphan afterglows of γoutburst.<br />
• Search for extrasolar planets.
The CSTAR enclosure in<br />
Xnglong Station of NAOC<br />
The optical Design of<br />
CSTAR
The transmission curve of CSTAR filters
The Quantum Efficiency of the CCD
低 温 测 试 CCD 相 机 和 两 种 宽 温 工 控 机 组 合<br />
( 国 家 天 文 台 空 间 实 验 室 2007 年 2 月 1 日 )<br />
陈 志 远<br />
蒋 兆 基<br />
周 旭<br />
吴 江 华<br />
李 奇 生
Andor CCD 相 机 可 以 在 ‐80.0 摄 氏 度 工 作<br />
该 工 空 机 组 合 在 ‐30 度 低 温 下 无 法 启 动
高 原 低 压 低 温 数 据 采 集 系 统 整 体 测 试<br />
地 点 : 卡 拉 苏 ( 中 国 哈 萨 克 斯 坦 边 境 )<br />
中 午 将 相 机 对 准 北 极<br />
交 换 工 控 机 组 合<br />
数 据 采 集 系 统 室 外 部 分<br />
数 据 采 集 系 统 室 内 部 分
The CSTAR Control Computers
CSTAR 试 观 测<br />
江 苏 盱 眙
CSTAR 试 观 测<br />
河 北 兴 隆
The Flat‐fields of the four CSTAR telescopes
The further Flat‐fields correction of the four CSTAR telescopes
An Image of North pole and the variables detected
The Andor DV435 1kx1k frame transfer CCD
The images of the Bias of four CSTAR Cameras
Astronomical Instruments at Departure Station
CSTAR installed at Dome A
2009 年 1 月
An Image from CSTAR
The comparison of the USNO‐B1 i magnitudes and the CSTAR<br />
i‐band instrument magnitude of 25 stars. We can use the<br />
mean subtraction to do the flux calibration for the CSTAR<br />
images.
The magnitude differences between two images. The error<br />
bar represent dispersion in RMS. The two lines represent the<br />
mag=0.1, which is corresponding to the limiting magnitude at<br />
S/N=10.
The limiting magnitude distribution for one whole day<br />
images on May 12, 2008
The integrated exposure time of the CSTAR for each month.
The<br />
position<br />
of<br />
variable<br />
objects
A Binary !
10 days variation of sky brightness
The variation of atmospheric extinction
The Statistics of the Atmospheric Extinction
The Statistics of Sky Background brightness
Relation between Sky brightness and Moon<br />
sky = 20.23 ‐ 10^(‐1.386 + 1.065*m)
Relation between Sky Brightnes and Sun level:<br />
sky = 20.29 ‐ 10^(‐0.6421 + 0.01931*s