View a Sample of The Lean Enterprise Memory Jogger - Goal - QPC
View a Sample of The Lean Enterprise Memory Jogger - Goal - QPC
View a Sample of The Lean Enterprise Memory Jogger - Goal - QPC

You also want an ePaper? Increase the reach of your titles
YUMPU automatically turns print PDFs into web optimized ePapers that Google loves.
IMPROVING THE WAY ORGANIZATIONS RUN
<strong>Lean</strong><br />
<strong>Enterprise</strong><br />
MEMORY<br />
JOGGER TM<br />
THE<br />
Create Value<br />
and<br />
Eliminate Waste<br />
throughout<br />
Your<br />
Company<br />
Richard L. MacInnes<br />
Net Results Inc.<br />
First Edition<br />
GOAL/<strong>QPC</strong>
<strong>The</strong> <strong>Lean</strong> <strong>Enterprise</strong> <strong>Memory</strong> <strong>Jogger</strong><br />
© 2002 by GOAL/<strong>QPC</strong><br />
All rights reserved.<br />
Reproduction <strong>of</strong> any part <strong>of</strong> this publication without<br />
the written permission <strong>of</strong> GOAL/<strong>QPC</strong> is prohibited.<br />
Cathy Kingery, Editor<br />
Carolann Scherer, Graphics<br />
Michele Kierstead, Cover Design, Icons, Layout<br />
Bob Page, Project Manager, GOAL/<strong>QPC</strong><br />
Julie MacInnes, Project Manager, Net Results Inc.<br />
Brian Wiley, Project Contributor, Net Results Inc.<br />
GOAL/<strong>QPC</strong><br />
2 Manor Parkway, Salem, NH 03079-2841<br />
800-643-4316 or 603-890-8800<br />
Fax: 603-870-9122<br />
E-mail: service@goalqpc.com<br />
Web site: www.goalqpc.com<br />
Printed in the United States <strong>of</strong> America<br />
First Edition 10 9 8 7 6 5 4 3 2 1<br />
ISBN 1-57681-045-3
Table <strong>of</strong> Contents<br />
Introduction .................................................................. 1<br />
<strong>The</strong> <strong>Goal</strong>s <strong>of</strong> the <strong>Lean</strong> <strong>Enterprise</strong> .............................. 3<br />
Mapping the Value Stream ...................................... 15<br />
Visual Management ................................................... 29<br />
Error Pro<strong>of</strong>ing ............................................................. 39<br />
Quick Changeover ..................................................... 55<br />
Standard Operations ................................................. 63<br />
One-Piece Flow ........................................................... 79<br />
<strong>The</strong> Kanban System ................................................... 93<br />
Total Productive Maintenance ............................... 107<br />
<strong>Lean</strong> Metrics .............................................................. 123<br />
Glossary ..................................................................... 157
Chapter 1<br />
Introduction<br />
What is a lean enterprise?<br />
Many companies today are becoming lean enterprises<br />
by replacing their outdated mass-production systems<br />
with lean systems to improve quality, eliminate waste,<br />
and reduce delays and total costs.<br />
A lean system emphasizes the prevention <strong>of</strong> waste: any<br />
extra time, labor, or material spent producing a product<br />
or service that doesn’t add value to it. A lean system’s<br />
unique tools, techniques, and methods can help your<br />
organization reduce costs, achieve just-in-time delivery,<br />
and shorten lead times.<br />
A lean enterprise fosters a company culture in which all<br />
employees continually improve their skill levels and<br />
production processes. And because lean systems are<br />
customer focused and driven, a lean enterprise’s<br />
products and services are created and delivered in the<br />
right amounts, to the right location, at the right time,<br />
and in the right condition. Products and services are<br />
produced only for a specific customer order rather than<br />
being added to an inventory.<br />
A lean system allows production <strong>of</strong> a wide variety <strong>of</strong><br />
products or services, efficient and rapid changeover<br />
among them as needed, efficient response to fluctuating<br />
demand, and increased quality.<br />
©2002 GOAL/<strong>QPC</strong><br />
Introduction<br />
1
How to use this book<br />
This book will explain what you need to know to<br />
transform your organization into a lean enterprise. <strong>The</strong><br />
specific information you will learn includes the following:<br />
• Concepts and definitions you need to know<br />
• Skills you need to develop<br />
• Tools you need to use<br />
• Steps you need to take<br />
This information will help you and your team work together<br />
systematically toward your lean-enterprise goals.<br />
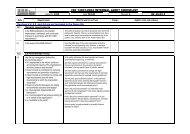
What do the icons mean?<br />
Topics <strong>of</strong> special interest to engineering<br />
staff or team leaders are marked with this<br />
icon. Operators may choose to skip these<br />
sections.<br />
TEAM<br />
LEADER<br />
Topics that are best addressed by an entire<br />
team working together are marked with<br />
this icon.<br />
2 Introduction<br />
©2002 GOAL/<strong>QPC</strong>
Chapter 2<br />
<strong>The</strong> <strong>Goal</strong>s <strong>of</strong> the<br />
<strong>Lean</strong> <strong>Enterprise</strong><br />
Your organization can apply lean methods and<br />
techniques to your product-production and business<br />
processes to deliver better value to your customers. A<br />
lean initiative has four main goals:<br />
<strong>Goal</strong> #1: Improve quality.<br />
Quality is the ability <strong>of</strong> your products or services to<br />
conform to your customers’ wants and needs (also<br />
known as expectations and requirements). Product and<br />
service quality is the primary way a company stays<br />
competitive in the marketplace.<br />
<strong>Goal</strong> #2: Eliminate waste.<br />
Waste is any activity that takes up time, resources, or<br />
space but does not add value to a product or service. An<br />
activity adds value when it transforms or shapes raw<br />
material or information to meet your customers’<br />
requirements. Some activities, such as moving materials<br />
during product production, are necessary but do not<br />
add value. A lean organization’s primary goal is to<br />
deliver quality products and services the first time and<br />
every time. As a lean enterprise, you accomplish this by<br />
eliminating all activities that are waste and then targeting<br />
areas that are necessary but do not add value.<br />
<strong>Goal</strong> #3: Reduce lead time.<br />
Lead time is the total time it takes to complete a series<br />
<strong>of</strong> tasks within a process. Some examples are the period<br />
between the receipt <strong>of</strong> a sales order and the time the cus-<br />
©2002 GOAL/<strong>QPC</strong><br />
<strong>The</strong> <strong>Goal</strong>s <strong>of</strong> the <strong>Lean</strong> <strong>Enterprise</strong><br />
3
Chapter 3<br />
Mapping the<br />
Value Stream<br />
What is a value stream?<br />
<strong>The</strong> term value stream refers to all the activities your<br />
company must do to design, order, produce, and deliver<br />
its products or services to customers. A value stream<br />
has three main parts:<br />
• <strong>The</strong> flow <strong>of</strong> materials, from receipt from suppliers<br />
to delivery to customers.<br />
• <strong>The</strong> transformation <strong>of</strong> raw materials into<br />
finished goods.<br />
• <strong>The</strong> flow <strong>of</strong> information that supports and<br />
directs both the flow <strong>of</strong> materials and the<br />
transformation <strong>of</strong> raw materials into finished<br />
goods.<br />
<strong>The</strong>re are <strong>of</strong>ten several value streams operating within<br />
a company; value streams can also involve more than<br />
one company.<br />
What is a value stream map, and what<br />
does it do?<br />
A value stream map uses simple graphics or icons to<br />
show the sequence and movement <strong>of</strong> information,<br />
materials, and actions in your company’s value stream.<br />
It helps employees understand how the separate parts<br />
<strong>of</strong> their company’s value stream combine to create<br />
products or services.<br />
©2002 GOAL/<strong>QPC</strong><br />
Mapping the Value Stream<br />
15
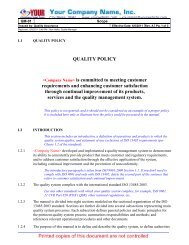
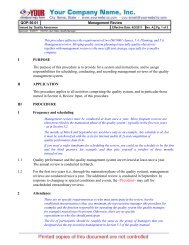
<strong>Sample</strong> <strong>Lean</strong> Manufacturing Icons<br />
1. Visual management. Shows that visual<br />
management techniques (see chapter 4, -V=<br />
“Visual Management,” for details) have<br />
been applied.<br />
2. Error pro<strong>of</strong>ing. Shows that error-pro<strong>of</strong>ing<br />
techniques (see chapter 5, “Error-Pro<strong>of</strong>ing,” D<br />
for details) have been applied.<br />
3. Quick changeover. Indicates that quick<br />
changeover techniques (see chapter 6,<br />
“Quick Changeover,” for details) have<br />
been applied.<br />
4. Product and process standards. Shows that<br />
your company’s product and process Standards<br />
standards are in place.<br />
5. Stretch objectives. Shows where stretch<br />
Stretch<br />
objectives for fostering improvement<br />
have been set for specific operations or for the<br />
value stream as a whole.<br />
6. Performance boards. Indicates that<br />
process objectives and results have been<br />
posted in an operation’s work area.<br />
7. Constraining operation. Shows which<br />
operation(s) constrains, or limits, the<br />
progress <strong>of</strong> the value stream.<br />
Q C<br />
Performance<br />
Boards<br />
©2002 GOAL/<strong>QPC</strong><br />
Mapping the Value Stream<br />
23
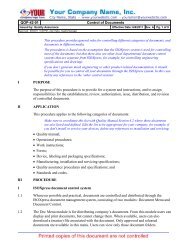
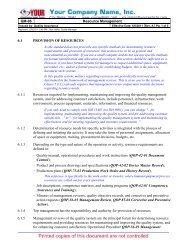
A <strong>Sample</strong> Value Stream<br />
ABC<br />
Glass<br />
40K Cases<br />
Tues.<br />
&<br />
Thurs.<br />
Filler<br />
Bottles<br />
5 days<br />
1<br />
Standards<br />
C/T = 210 BPM<br />
C/O = 30 min.<br />
Uptime = 85%<br />
27,000 sec. avail.<br />
EPE = 1 week<br />
<strong>Sample</strong> Value Stream Map<br />
3-Month<br />
Forecast<br />
Weekly<br />
Update<br />
Bottling Process<br />
Production<br />
Control<br />
MRP<br />
Weekly<br />
Schedule<br />
Weekly<br />
Order<br />
Daily Ship<br />
Schedule<br />
Nypro<br />
Sales<br />
Forecast<br />
Daily<br />
Hot Orders<br />
Performance<br />
Boards<br />
State Street<br />
Distributor<br />
18,400.cases/mo.<br />
-12,000.“SC”<br />
-6,400.“US”<br />
Case = 12 bottles<br />
2 shifts<br />
1×<br />
daily<br />
1<br />
Capper Labeler<br />
Q C<br />
Standards<br />
D<br />
Standards<br />
1<br />
Neck Bander Case Labeler Shipping<br />
Standards<br />
100 SC 100 SC 75 SC 300 SC 425K SC<br />
1<br />
Standards<br />
C/T = 240 BPM<br />
C/O = 3 min.<br />
Uptime = 100%<br />
1 shift<br />
27,000 sec. avail.<br />
C/T = 300 BPM<br />
C/O = 10 min.<br />
Uptime = 80%<br />
1 shift<br />
27,000 sec. avail.<br />
C/T = 200 BPM<br />
C/O = 3 min.<br />
Uptime = 100%<br />
1 shift<br />
27,000 sec. avail.<br />
C/T = 300 BPM<br />
C/O = 30 sec.<br />
Uptime = 100%<br />
1 shift<br />
27,000 sec. avail.<br />
24 Mapping the Value Stream<br />
©2002 GOAL/<strong>QPC</strong>
3. Informative inspections. Informative inspections<br />
provide timely information about a defect so that<br />
root-cause analysis can be done and the production<br />
process can be adjusted before significant numbers<br />
<strong>of</strong> defects are created.<br />
Typically, these inspections are done close enough<br />
to the time <strong>of</strong> the occurrence <strong>of</strong> the defect so that<br />
action can be taken to prevent further defects<br />
from occurring.<br />
<strong>The</strong>re are two types <strong>of</strong> informative inspections.<br />
<strong>The</strong>y are as follows:<br />
• Successive inspections. <strong>The</strong>se inspections are<br />
performed after one operation in the production<br />
process is completed, by employees who<br />
perform the next operation in the process.<br />
Feedback can be provided as soon as any defects<br />
are detected (which is preferable) or simply<br />
tracked and reported later. It is always better to<br />
report defects immediately.<br />
• Self-inspections. Operators perform selfinspections<br />
at their own workstations. If an<br />
operator finds a defect in a product or part, he/<br />
she sets it aside and takes action to ensure that<br />
other defective products or parts are not passed on<br />
to the next operation. <strong>The</strong> root cause <strong>of</strong> the defect is<br />
then determined and corrected. Often this involves<br />
putting error-pro<strong>of</strong>ing measures and devices in<br />
place to prevent the problem from recurring.<br />
Tip Industrial engineering studies have shown<br />
that human visual inspection is only about 85%<br />
effective. Similar inaccuracies happen when<br />
humans directly measure physical properties,<br />
such as pressure, temperature, time, and distance.<br />
Use electronic or mechanical inspection devices<br />
to achieve better accuracy.<br />
42 Error Pro<strong>of</strong>ing<br />
©2002 GOAL/<strong>QPC</strong>
• Alarms that an operator activates when he/she<br />
detects an error.<br />
• Checklists, which are written or graphical<br />
reminders <strong>of</strong> tasks, materials, events, and so on.<br />
Such industrial sensing devices are the most versatile<br />
error-pro<strong>of</strong>ing tools available for work processes.<br />
Once such a device detects an unacceptable<br />
condition, it either warns the operator <strong>of</strong> the<br />
condition or automatically takes control <strong>of</strong> the<br />
function <strong>of</strong> the equipment, causing it to stop or<br />
correct itself. <strong>The</strong>se warning and control steps, known<br />
as regulatory functions, are explained more below.<br />
<strong>The</strong>se sensing devices can detect object characteristics<br />
by using both contact and non-contact<br />
methods. Contact sensors include micro-switches<br />
and limit switches; non-contact methods include<br />
transmitting and reflecting photoelectric switches.<br />
Setting functions describe specific attributes that sensing<br />
devices need to inspect. All <strong>of</strong> the four setting functions<br />
listed below are effective error-detection methods:<br />
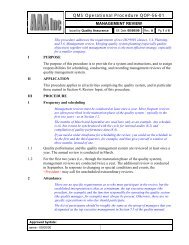
1. Contact methods involve inspecting for physical<br />
characteristics <strong>of</strong> an object, such as size, shape, or<br />
color, to determine if any abnormalities exist.<br />
Example: A sensor receives a reflective signal (sparks)<br />
only when the flintwheel is installed correctly.<br />
Sparks<br />
Flintwheel<br />
Flintwheel<br />
Correct<br />
Flint<br />
Wrong<br />
Flint<br />
Figure courtesy <strong>of</strong> Allen Bradley<br />
©2002 GOAL/<strong>QPC</strong><br />
Error Pro<strong>of</strong>ing<br />
45