Profile of Alcohol and Drug Indicators- Hillsborough County
Profile of Alcohol and Drug Indicators- Hillsborough County
Profile of Alcohol and Drug Indicators- Hillsborough County

Create successful ePaper yourself
Turn your PDF publications into a flip-book with our unique Google optimized e-Paper software.
December<br />
2009<br />
<strong>Pr<strong>of</strong>ile</strong> <strong>of</strong> <strong>Alcohol</strong> <strong>and</strong> <strong>Drug</strong> <strong>Indicators</strong><br />
for <strong>Hillsborough</strong><br />
<strong>County</strong>, Florida<br />
Kathleen A. Moore, Ph.D.<br />
M. Scott Young, Ph.D.<br />
Mental Health Law <strong>and</strong> Policy<br />
College <strong>of</strong> Behavioral <strong>and</strong> Community<br />
Sciences<br />
University <strong>of</strong> South Florida<br />
Ellen Snelling<br />
Sue Carrigan<br />
Tampa <strong>Alcohol</strong> Coalition<br />
<strong>Pr<strong>of</strong>ile</strong> <strong>of</strong> <strong>Alcohol</strong> <strong>and</strong> <strong>Drug</strong> <strong>Indicators</strong> t December 2009 t 1
For more information about TAC or the <strong>Pr<strong>of</strong>ile</strong> <strong>of</strong><br />
<strong>Alcohol</strong> <strong>and</strong> <strong>Drug</strong> <strong>Indicators</strong>, please contact:<br />
Tampa <strong>Alcohol</strong> Coalition<br />
PO Box 290383<br />
Tampa, FL 33687<br />
Ellen Snelling<br />
TAC Co-Chair<br />
813-731-2696<br />
er.snelling@verizon.net<br />
Sue Carrigan<br />
TAC Co-Chair<br />
813-334-0619<br />
suecarrigan@aol.com<br />
Genie Short, Chair <strong>of</strong> the<br />
<strong>Hillsborough</strong> <strong>County</strong> Anti <strong>Drug</strong> Alliance<br />
727-542-3537<br />
genieshort_pip@msn.com<br />
tampa alcohol coalition<br />
www.tampatac.org<br />
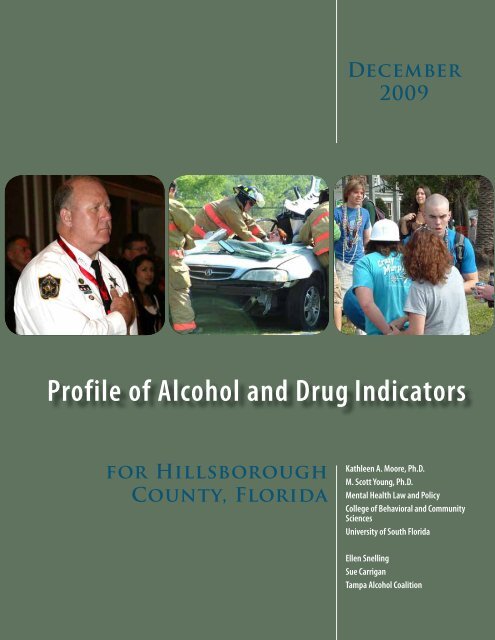
Cover Photographs (left to right)<br />
• Deputy Larry Morrell representing the <strong>Hillsborough</strong> <strong>County</strong> Sheriff’s<br />
Office 3 D DUI squad at the 2008 Mothers Against Drunk Driving<br />
National Convention<br />
• A mock impaired driving crash conducted at Blake High School to teach<br />
students about the dangers <strong>of</strong> drinking <strong>and</strong> driving<br />
• Law enforcement <strong>of</strong>ficers making an arrest for underage possession <strong>of</strong><br />
alcoholic beverages at the 2008 Gasparilla Parade<br />
The Tampa <strong>Alcohol</strong> Coalition (TAC) is a community coalition<br />
with over 100 members. TAC’s mission is to prevent underage <strong>and</strong><br />
other high-risk drinking in <strong>Hillsborough</strong> <strong>County</strong>. Concerns about<br />
underage drinking <strong>and</strong> alcohol-related fatalities led the <strong>Hillsborough</strong><br />
<strong>County</strong> Anti <strong>Drug</strong> Alliance (HCADA) to create a subcommittee<br />
called the <strong>Alcohol</strong> Prevention Task Force in September 2001.<br />
The Task Force was renamed Tampa <strong>Alcohol</strong> Coalition (TAC) in<br />
2004. TAC’s primary mission is to prevent underage <strong>and</strong> high-risk<br />
drinking, <strong>and</strong> reduce alcohol-related consequences in <strong>Hillsborough</strong><br />
<strong>County</strong>. HCADA is a non-pr<strong>of</strong>it organization that strives to support<br />
<strong>and</strong> strengthen community substance abuse prevention/ treatment<br />
efforts to eradicate the illegal use <strong>of</strong> alcohol <strong>and</strong> other drugs in<br />
<strong>Hillsborough</strong> <strong>County</strong>.<br />
TAC strives to increase awareness about the consequences <strong>of</strong><br />
underage drinking <strong>and</strong> high risk drinking in our community. The<br />
Coalition advocates for effective alcohol policies. TAC supports<br />
consistent enforcement <strong>of</strong> underage drinking laws. Members<br />
collaborate with local <strong>and</strong> state organizations, agencies, media <strong>and</strong><br />
<strong>of</strong>ficials in their efforts to prevent high risk drinking <strong>and</strong> impaired<br />
driving.<br />
Acknowledgements<br />
This research project was conducted as part <strong>of</strong> a community<br />
substance abuse assessment for the <strong>Hillsborough</strong> <strong>County</strong> Anti<br />
<strong>Drug</strong> Alliance <strong>and</strong> the Tampa <strong>Alcohol</strong> Coalition. The participation<br />
<strong>and</strong> feedback <strong>of</strong> a number <strong>of</strong> individuals have been crucial in<br />
the completion <strong>of</strong> this project. We would like to express our<br />
appreciation to all who have contributed. James N. Hall, Director<br />
<strong>of</strong> the Center for the Study <strong>and</strong> Prevention <strong>of</strong> Substance Abuse,<br />
Nova Southeastern University, provided us with valuable resources,<br />
guidance <strong>and</strong> technical assistance. Several local agencies contributed<br />
data, including the <strong>Hillsborough</strong> <strong>County</strong> Medical Examiner,<br />
<strong>Hillsborough</strong> <strong>County</strong> State Attorney’s Office, <strong>Hillsborough</strong> <strong>County</strong><br />
Sheriff’s Office, Tampa Police Department, <strong>and</strong> the Division <strong>of</strong><br />
<strong>Alcohol</strong>ic Beverage <strong>and</strong> Tobacco, Tampa <strong>of</strong>fice. Thanks to Carrie<br />
Wagner for her assistance with the graphic design <strong>and</strong> layout <strong>of</strong> this<br />
report. Finally, thanks to the Department <strong>of</strong> Children <strong>and</strong> Families<br />
for helping fund this research project <strong>and</strong> publication.<br />
www.hcada.com<br />
December Page 2 t 2009 <strong>Pr<strong>of</strong>ile</strong> <strong>of</strong> <strong>Alcohol</strong> <strong>and</strong> <strong>Drug</strong> <strong>Indicators</strong> t December 2008
Table <strong>of</strong> Contents<br />
Acknowledgements............................................................................................................................ 2<br />
Overview........................................................................................................................................... 5<br />
<strong>Hillsborough</strong> <strong>County</strong> Anti <strong>Drug</strong> Alliance <strong>and</strong> Tampa <strong>Alcohol</strong> Coalition Accomplishments..............................9<br />
<strong>Alcohol</strong> Outlet <strong>Indicators</strong>...............................................................................................................................11<br />
Criminal Justice <strong>Indicators</strong>.............................................................................................................................12<br />
General Population Surveys: Adult Prevalence Rates.......................................................................................14<br />
General Population Surveys: Adolescent Prevalence Rates...............................................................................16<br />
Mortality Data................................................................................................................................................22<br />
Treatment Data..............................................................................................................................................27<br />
Appendix A - <strong>Hillsborough</strong> <strong>County</strong> Sheriff’s Office (HCSO) <strong>and</strong> Tampa Police Department<br />
Figure/Maps...................................................................................................................................... 28<br />
List <strong>of</strong> Tables<br />
Table 1. Number <strong>of</strong> <strong>Hillsborough</strong> <strong>County</strong> Active <strong>Alcohol</strong> Licenses, by License Type............................. 11<br />
Table 2. Uniform Crime Report <strong>Alcohol</strong>- <strong>and</strong> <strong>Drug</strong>-Related Offense <strong>and</strong> Arrest Data.......................... 12<br />
Table 3. Local Law Enforcement <strong>and</strong> State Attorney’s Office <strong>Alcohol</strong>- <strong>and</strong> <strong>Drug</strong>-Related Offense<br />
<strong>and</strong> Arrest Data....................................................................................................................... 13<br />
Table 4. Behavioral Risk Factor Surveillance System Data..................................................................... 14<br />
Table 5. District National Household Survey on <strong>Drug</strong> Use <strong>and</strong> Health (NSDUH) Prevalence Data..... 15<br />
Table 6. Youth Risk Behavior Surveillance System <strong>Alcohol</strong> <strong>and</strong> <strong>Drug</strong> Data............................................ 16<br />
Table 7. Students Reporting Lifetime Use <strong>of</strong> Selected <strong>Drug</strong>s................................................................. 17<br />
Table 8. <strong>Hillsborough</strong> <strong>County</strong> Students Reporting Lifetime Use <strong>of</strong> Selected <strong>Drug</strong>s............................... 18<br />
Table 9. <strong>Hillsborough</strong> <strong>County</strong> Students Reporting Past 30-Day Use <strong>of</strong> Selected <strong>Drug</strong>s......................... 19<br />
Table 10. Students Reporting Past 30-Day Use <strong>of</strong> Selected <strong>Drug</strong>s........................................................... 20<br />
Table 11. Mean Age <strong>of</strong> First Substance Use among <strong>Hillsborough</strong> <strong>County</strong> Students................................. 21<br />
Table 12. Percent <strong>of</strong> <strong>Hillsborough</strong> <strong>County</strong> Students Reporting <strong>Drug</strong>-Related Behavior........................... 21<br />
Table 13. <strong>Hillsborough</strong> <strong>County</strong> <strong>Drug</strong>-Related Deaths by Lethal/Non-Lethal Levels................................ 22<br />
Table 14. <strong>Alcohol</strong>-Related Crashes, Injuries <strong>and</strong> Fatalities....................................................................... 23<br />
Table 15. 2006 <strong>Hillsborough</strong> <strong>County</strong> Medical Examiner Autopsy Data on Persons Aged 15 to 24.......... 25<br />
Table 16. Community Health Assessment Resource Tool Set (CHARTS), <strong>Hillsborough</strong> <strong>County</strong> Data.... 26<br />
Table 17. Admission to <strong>Hillsborough</strong> <strong>County</strong> Substance Abuse Treatment Providers............................... 27<br />
<strong>Pr<strong>of</strong>ile</strong> <strong>of</strong> <strong>Alcohol</strong> <strong>and</strong> <strong>Drug</strong> <strong>Indicators</strong> t December 2009 t 3
List <strong>of</strong> Figures<br />
Figure 1. Comparison <strong>of</strong> <strong>Hillsborough</strong>, Pinellas <strong>and</strong> Orange <strong>County</strong> DUI Arrests................................ 12<br />
Figure 2. Comparison <strong>of</strong> <strong>Hillsborough</strong>, Pinellas <strong>and</strong> Orange Counties <strong>Drug</strong>/Narcotic Arrest................ 12<br />
Figure 3. Comparison <strong>of</strong> <strong>Hillsborough</strong>, Pinellas <strong>and</strong> Orange Counties Liquor Law Violations.............. 13<br />
Figure 4. Number <strong>of</strong> <strong>Hillsborough</strong> <strong>County</strong> DUI Arrests........................................................................ 13<br />
Figure 5. Past 30-Day Middle <strong>and</strong> High School <strong>Alcohol</strong> Use: <strong>Hillsborough</strong> <strong>County</strong> vs. Statewide......... 20<br />
Figure 6. Past 30-Day Middle <strong>and</strong> High School Binge Drinking: <strong>Hillsborough</strong> <strong>County</strong> vs. Statewide... 20<br />
Figure 7. Comparison <strong>of</strong> <strong>Hillsborough</strong> <strong>County</strong> <strong>Drug</strong>-Related Deaths by Lethal Level........................... 23<br />
Figure 8. Comparison <strong>of</strong> <strong>Hillsborough</strong>, Pinellas <strong>and</strong> Orange Counties <strong>Alcohol</strong>-Related Crashes........... 24<br />
Figure 9. Comparison <strong>of</strong> <strong>Hillsborough</strong>, Pinellas <strong>and</strong> Orange Counties <strong>Alcohol</strong>-Related Injuries............ 24<br />
Figure 10. Comparison <strong>of</strong> <strong>Hillsborough</strong>, Pinellas <strong>and</strong> Orange Counties <strong>Alcohol</strong>-Related Fatalities.......... 24<br />
Figure 11. Percentage <strong>of</strong> Statewide Rates for <strong>Hillsborough</strong> <strong>County</strong> DUI Arrests <strong>and</strong> <strong>Alcohol</strong>-Related<br />
Crashes, Injuries, <strong>and</strong> Fatalities............................................................................................... 24<br />
Figure 12. Autopsy Data BAC Level for Youth Ages 15 to 24 Years by Manner <strong>of</strong> Death......................... 26<br />
Figure 13. Autopsy Data Indication <strong>of</strong> <strong>Alcohol</strong> for Youth Ages 15 to 24 Years by Manner <strong>of</strong> Death........ 26<br />
Figure 14. Adult Admission to <strong>Hillsborough</strong> <strong>County</strong> Substance Abuse <strong>and</strong> Treatment Providers............. 27<br />
Figure 15. Child Admissions to <strong>Hillsborough</strong> <strong>County</strong> Substance Abuse Treatment Providers.................. 27<br />
4 t <strong>Pr<strong>of</strong>ile</strong> <strong>of</strong> <strong>Alcohol</strong> <strong>and</strong> <strong>Drug</strong> <strong>Indicators</strong> t December 2009
Overview<br />
Overview<br />
<strong>Alcohol</strong> has the highest prevalence <strong>of</strong> use <strong>of</strong> any substance in <strong>Hillsborough</strong> <strong>County</strong><br />
<strong>and</strong> throughout the nation. In 2008, <strong>Hillsborough</strong> <strong>County</strong> ranked first among all<br />
counties in alcohol-related crashes <strong>and</strong> injuries (per capita), <strong>and</strong> third in alcohol-related<br />
fatalities. Although <strong>Hillsborough</strong> <strong>County</strong> DUI arrests decreased in 2008, <strong>Hillsborough</strong><br />
still had more DUI arrests than any other Florida county. To address these concerns, the<br />
<strong>Hillsborough</strong> <strong>County</strong> Anti <strong>Drug</strong> Alliance (HCADA) <strong>and</strong> the Tampa <strong>Alcohol</strong> Coalition<br />
(TAC) have continued to support: DUI law enforcement operations, The <strong>Hillsborough</strong><br />
<strong>County</strong> Sheriff’s <strong>Alcohol</strong> Vendor Enforcement program (SAVE), DUI Counterattack, DUI<br />
media coverage, alcohol awareness programs, improved alcohol policies <strong>and</strong> community<br />
coalitions’ collaborative efforts to reduce impaired driving <strong>and</strong> crashes, including the<br />
Community Traffic Safety Team (CTST) <strong>and</strong> Mothers Against Drunk Driving (MADD).<br />
<strong>Alcohol</strong> is the most abused substance among youth in <strong>Hillsborough</strong> <strong>County</strong>. The 2008<br />
Florida Youth Substance Abuse Survey revealed that 37% <strong>of</strong> middle school <strong>and</strong> 64% <strong>of</strong><br />
high school students used alcohol in their lifetime. Further, 18% <strong>of</strong> middle school <strong>and</strong><br />
40% <strong>of</strong> high school students reported drinking in the past 30 days, with 20% <strong>of</strong> high<br />
school students reporting binge drinking. The Tampa <strong>Alcohol</strong> Coalition continues to<br />
collaborate with its partners in the schools <strong>and</strong> universities to prevent underage drinking<br />
<strong>and</strong> its consequences. TAC supports the Division <strong>of</strong> <strong>Alcohol</strong>ic Beverage <strong>and</strong> Tobacco <strong>and</strong><br />
other law enforcement agency partners that enforce underage drinking laws.<br />
National surveys show that 18 to 25 year olds, particularly full time college students,<br />
typically have the highest rate <strong>of</strong> alcohol <strong>and</strong> other drug use <strong>of</strong> all age groups. Because this<br />
age group is extremely vulnerable to alcohol- <strong>and</strong> drug-related accidents, autopsy reports<br />
were examined from the <strong>Hillsborough</strong> <strong>County</strong> Medical Examiner’s <strong>of</strong>fice on all 102<br />
accidental or suicidal deaths that occurred in 2006 among those aged 15 to 24 years old.<br />
Results indicate that alcohol was mentioned in 43% <strong>of</strong> these autopsies, <strong>and</strong> illicit drugs<br />
were mentioned in 31% <strong>of</strong> the cases. <strong>Alcohol</strong> <strong>and</strong> other drug use contributed significantly<br />
to deaths in the 15 to 24 year old age group.<br />
Local <strong>and</strong> national news stories have recently reported on increased rates <strong>of</strong> prescription<br />
drug abuse. <strong>Hillsborough</strong> <strong>County</strong> data indicate that rates <strong>of</strong> prescription drug abuse by<br />
middle <strong>and</strong> high school students are increasing, <strong>and</strong> local Medical Examiner data indicate<br />
that prescription drugs are the leading cause <strong>of</strong> overdose deaths. As a result, HCADA<br />
recently created the Prescription <strong>Drug</strong> Abuse Task Force that meets on a monthly basis.<br />
Over the past several years, the <strong>Hillsborough</strong> <strong>County</strong> Anti <strong>Drug</strong> Alliance has made a<br />
concerted effort to reduce tobacco use among youth. Data from middle <strong>and</strong> high school<br />
students indicate that lifetime <strong>and</strong> past 30-day tobacco use is still common, although<br />
there has been a steady decrease among high school students. Recent activities include<br />
supporting local chapters <strong>of</strong> Students Working Against Tobacco (SWAT) <strong>and</strong> m<strong>and</strong>atory<br />
Teen Tobacco Offender education classes.<br />
Large scale survey data from the Florida Youth Substance Abuse Survey (FYSAS) indicate<br />
that in 2008, alcohol was the substance most used by <strong>Hillsborough</strong> <strong>County</strong> middle <strong>and</strong><br />
high school students, followed by marijuana <strong>and</strong> cigarettes. The use <strong>of</strong> inhalants was<br />
prevalent among middle school students <strong>and</strong> has increased over the past two years. Past<br />
30-day rates <strong>of</strong> student alcohol use increased in <strong>Hillsborough</strong> <strong>County</strong> from 2006 to 2008,<br />
although statewide rates during this same period decreased. Likewise, other drug use rates<br />
in <strong>Hillsborough</strong> <strong>County</strong> increased or remained steady including cigarettes, marijuana,<br />
inhalants, <strong>and</strong> other illicit drug use, whereas the statewide rates generally decreased. Middle<br />
<strong>Pr<strong>of</strong>ile</strong> <strong>of</strong> <strong>Alcohol</strong> <strong>and</strong> <strong>Drug</strong> <strong>Indicators</strong> t December 2009 t 5
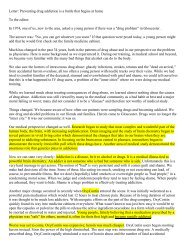
Overview<br />
$9,000<br />
DRINK!<br />
Lawyer Fees .....................................$3,500<br />
Towing Charges ..................................$150<br />
Bond ....................................................$500<br />
Fine & Court Costs .............................$500<br />
DUI School ..........................................$215<br />
3-Year Insurance Surcharge ...........$1,800<br />
License Reinstatement ......................$225<br />
<strong>Drug</strong> & <strong>Alcohol</strong> Evaluation ................$100<br />
<strong>Alcohol</strong> Treatment ..............................$400<br />
Cost <strong>of</strong> Supervision ............................$610<br />
Vehicle Impound .................................$100<br />
Ignition Interlock Device ....................$600<br />
Loss <strong>of</strong> Work .......................................$300<br />
TOTAL ............... $9,000<br />
THE LAW<br />
Legal drinking age - 21 years old<br />
Level <strong>of</strong> Blood <strong>Alcohol</strong> .08 or greater -<br />
DUI, automatic 6 months suspension <strong>of</strong><br />
Driver’s License<br />
.20 Blood <strong>Alcohol</strong> Content - Increased<br />
penalties for DUI<br />
A refusal to submit to a breath test requested<br />
by law enforcement - 1 year automatic<br />
suspension <strong>of</strong> Driver’s License, <strong>and</strong> 18 months<br />
suspension for a second or subsequent refusal<br />
PERSONS UNDER THE AGE OF 21<br />
Possession <strong>of</strong> an alcoholic beverage<br />
under the age <strong>of</strong> 21- arrestable 2nd degree<br />
misdemeanor with a ne <strong>of</strong> up to $500.00<br />
Operating or in physical control <strong>of</strong> a motor<br />
vehicle with a Blood <strong>Alcohol</strong> Content <strong>of</strong> .02<br />
or greater - automatic 6 month suspension <strong>of</strong><br />
Driver’s License<br />
Your Community Traf c Safety Team - www.ctst.org<br />
May 2007<br />
Photo source: Community<br />
Traffic Safety Team (CTST), D7<br />
school <strong>and</strong> high school students reported increased rates <strong>of</strong> selling drugs, <strong>and</strong> more middle<br />
school students being drunk or high at school in 2008 compared to 2006. HCADA <strong>and</strong> its<br />
community partners including the Mendez Foundation, National Council on <strong>Alcohol</strong>ism<br />
<strong>and</strong> <strong>Drug</strong> Dependence (NCADD), DUI Counterattack, treatment agencies, juvenile drug<br />
court, media partners <strong>and</strong> law enforcement agencies will continue to work together to try<br />
<strong>and</strong> reduce substance abuse among youth. The Too Good for <strong>Drug</strong>s Kidfest sponsored<br />
by HCADA <strong>and</strong> the Mendez Foundation is a major prevention event <strong>of</strong>fered each year<br />
in Tampa. This event attracts over 6,000 children <strong>and</strong> families <strong>and</strong> features a variety <strong>of</strong><br />
prevention activities including the Too Good for <strong>Drug</strong>s Walk <strong>and</strong> Banner Contest.<br />
Report Highlights<br />
• <strong>Alcohol</strong> Outlets<br />
◦{<br />
The number <strong>of</strong> each type <strong>of</strong> alcohol license decreased from 2006 to 2008, <strong>and</strong> in<br />
2008 there were almost 800 fewer active alcohol licenses than in 2006.<br />
• Criminal Justice <strong>Indicators</strong><br />
◦{<br />
<strong>Hillsborough</strong>, Orange <strong>and</strong> Pinellas Counties DUI arrests all peaked in 2005.<br />
◦{<br />
<strong>Hillsborough</strong> has nearly as many DUI arrests as both Pinellas <strong>and</strong> Orange Counties<br />
combined from 2005-2008. <strong>Hillsborough</strong> <strong>County</strong> reported the most DUI arrests in<br />
the State according to FDLE UCR, 2007.<br />
◦{<br />
There was a steady decrease in the number <strong>of</strong> drug/narcotic arrests in all 3 counties<br />
from 2007-2008, with <strong>Hillsborough</strong> having higher rates than Pinellas <strong>and</strong> Orange.<br />
◦{<br />
<strong>Hillsborough</strong> liquor law violations decreased in 2006 <strong>and</strong> 2007 then increased in<br />
2008. Pinellas <strong>and</strong> Orange Counties significantly increased their violation rates in<br />
2007.<br />
◦{<br />
The total number <strong>of</strong> DUI arrests processed through HCSO Central Breath Testing<br />
peaked in 2005, while underage DUI arrests peaked in 2004.<br />
◦{<br />
Tampa Police Department data from 2003 to 2006 indicate that there have been<br />
significant increases in both the number <strong>of</strong> narcotic <strong>and</strong> equipment drug <strong>of</strong>fenses<br />
since 2003 but both types <strong>of</strong> arrests decreased from 2006 to 2008.<br />
• Adult Prevalence Rates<br />
◦{<br />
The adult past 30-day drinking, binge drinking <strong>and</strong> heavy drinking rates increased<br />
between 2006 <strong>and</strong> 2007.<br />
◦{<br />
The adult smoking rate increased from 2006 to 2007.<br />
◦{<br />
<strong>Hillsborough</strong> <strong>County</strong> heavy drinking, binge drinking, <strong>and</strong> smoking rates were all<br />
higher than state averages.<br />
• Adolescent Prevalence Rates<br />
◦{<br />
<strong>Alcohol</strong> is the most commonly used drug among students in <strong>Hillsborough</strong> <strong>County</strong><br />
<strong>and</strong> Florida Statewide, followed by marijuana then cigarettes, according to lifetime<br />
drug use data.<br />
◦{<br />
<strong>Alcohol</strong> remains the most commonly used drug among both middle <strong>and</strong> high school<br />
students in <strong>Hillsborough</strong> <strong>County</strong>. Inhalants were the second most commonly used<br />
drug, followed by marijuana for middle school students whereas marijuana was the<br />
second most commonly used drug, followed by cigarettes for high school students.<br />
◦{<br />
From 2006 to 2008, middle school students’ past 30-day use rates increased in<br />
every category <strong>of</strong> substance use. High school students reported increased rates <strong>of</strong><br />
6 t <strong>Pr<strong>of</strong>ile</strong> <strong>of</strong> <strong>Alcohol</strong> <strong>and</strong> <strong>Drug</strong> <strong>Indicators</strong> t December 2009
alcohol, smokeless tobacco, marijuana, mushroom, heroin <strong>and</strong> prescription drugs<br />
<strong>and</strong> decreased rates <strong>of</strong> inhalant, cigarette, methamphetamine, cocaine <strong>and</strong> ecstacy<br />
use during this period.<br />
◦{<br />
Use <strong>of</strong> prescription pain relievers peaked in 2008 for middle <strong>and</strong> high school<br />
students.<br />
◦{<br />
Middle school students reported an increased rate <strong>of</strong> selling drugs <strong>and</strong> an increased<br />
rate <strong>of</strong> being drunk or high at school from 2006 to 2008.<br />
◦{<br />
Among high school students, rates <strong>of</strong> being drunk or high at school were lowest in<br />
2008, though rates <strong>of</strong> selling drugs increased from 2006 to 2008.<br />
◦{<br />
The rate <strong>Hillsborough</strong> <strong>County</strong> High School students reported being <strong>of</strong>fered, given or<br />
sold drugs on school property was 61% higher than the state average in 2007.<br />
◦{<br />
The rate <strong>of</strong> high school students driving after drinking <strong>and</strong> riding in a car with<br />
someone who had been drinking decreased from 2005 to 2007.<br />
• Mortality Data<br />
◦{<br />
<strong>Hillsborough</strong> <strong>County</strong> has a higher number <strong>of</strong> alcohol-related crashes, injuries, <strong>and</strong><br />
fatalities than the comparably sized Pinellas <strong>and</strong> Orange Counties, except in 2008,<br />
when both Orange <strong>and</strong> Hillsbrough <strong>County</strong> reported 77 fatalities.<br />
◦{<br />
From 2006 to 2007, <strong>Hillsborough</strong> <strong>County</strong> has seen an increase in alcohol-related<br />
injuries <strong>and</strong> fatalities; then crashes, injuries, <strong>and</strong> fatalities all decreased in 2008.<br />
◦{<br />
There was a decrease in the number <strong>of</strong> lethal level* deaths in <strong>Hillsborough</strong> <strong>County</strong><br />
due to cocaine, methadone, alprazolam, diazepam, propoxyphene <strong>and</strong> hydrocodone.<br />
In 2008, the prescription drugs alprazolam, oxycodone <strong>and</strong> methadone were most<br />
commonly found in lethal levels followed by cocaine. Oxycodone <strong>and</strong> morphine<br />
lethal level deaths increased in 2008. (* “Lethal level” means that the drug was the<br />
cause <strong>of</strong> death.)<br />
◦{<br />
There has been a steady increase in the number <strong>of</strong> non-lethal level deaths due to<br />
cocaine, methadone, oxycodone, hydrocodone, <strong>and</strong> alprazolam; there have been very<br />
few deaths in which non-lethal levels <strong>of</strong> heroin were detected.<br />
◦{<br />
In 2006, there were 102 accidental <strong>and</strong> suicidal deaths in <strong>Hillsborough</strong> <strong>County</strong> for<br />
persons aged 15 to 24 years old; approximately 43% had some mention <strong>of</strong> alcohol<br />
in their autopsy report <strong>and</strong> those with alcohol present had a mean blood alcohol<br />
content (BAC) level <strong>of</strong> .156.<br />
◦{<br />
There was a decrease in the number <strong>and</strong> percent <strong>of</strong> total deaths attributable to chronic<br />
liver disease <strong>and</strong> cirrhosis from 2007 to 2008 in Orange <strong>and</strong> <strong>Hillsborough</strong> <strong>County</strong>.<br />
The age adjusted death rate from liver disease in <strong>Hillsborough</strong> <strong>County</strong> was lower<br />
than Pinellas but higher than Orange <strong>County</strong> in 2008.<br />
• Treatment Data<br />
◦{<br />
In <strong>Hillsborough</strong> <strong>County</strong>, outpatient services were most common <strong>and</strong> residential<br />
services were least common for children <strong>and</strong> adults from 2005/06 to 2007/08.<br />
◦{<br />
In Pinellas <strong>County</strong>, residential services were more common for adults than outpatient<br />
services from 2005/06 to 2007/08.<br />
◦{<br />
In <strong>Hillsborough</strong> <strong>County</strong>, each type <strong>of</strong> adult admission decreased from 2006/07 to<br />
2007/08 though there was an increase in children’s residential <strong>and</strong> detox services<br />
during this time.<br />
Overview<br />
Photo source: Community<br />
Traffic Safety Team (CTST), D7<br />
<strong>Pr<strong>of</strong>ile</strong> <strong>of</strong> <strong>Alcohol</strong> <strong>and</strong> <strong>Drug</strong> <strong>Indicators</strong> t December 2009 t 7
Overview<br />
Area Description<br />
<strong>Hillsborough</strong> <strong>County</strong> is composed <strong>of</strong> the cities <strong>of</strong> Tampa, Temple Terrace, <strong>and</strong> Plant<br />
City plus 47 other unincorporated areas. The <strong>County</strong> covers over 1,200 square miles,<br />
including 215 miles <strong>of</strong> coastline. According to the 2008 census estimate, the population<br />
was 1,180,784, with 77.9% White, 16.6% Black, 3.1% Asian, .7% other races, <strong>and</strong> 1.5%<br />
multiracial. Census 2000 figures also indicate that over one fifth (21.2%) <strong>of</strong> <strong>Hillsborough</strong>’s<br />
population report being <strong>of</strong> Hispanic or Latino origin, the slight majority (51%) are female,<br />
11.5% <strong>of</strong> the population are 65 years old or older, <strong>and</strong> 11.8% live below the poverty level.<br />
<strong>Hillsborough</strong> <strong>County</strong> is the fourth most populated county in Florida <strong>and</strong> accounts for over<br />
6% <strong>of</strong> the State’s total population.<br />
<strong>Hillsborough</strong> <strong>County</strong> <strong>Alcohol</strong> <strong>and</strong> <strong>Drug</strong> Indicator Analysis<br />
Indicator reporting programs are a useful means <strong>of</strong> gauging the extent <strong>of</strong> local alcohol<br />
<strong>and</strong> drug use <strong>and</strong> their related problems. Additionally, collecting indicator data over time<br />
will help to ascertain the impact <strong>of</strong> efforts designed to reduce alcohol <strong>and</strong> drug use <strong>and</strong><br />
its related problems. <strong>Indicators</strong> can be used by community leaders in the following ways<br />
(1) to identify the most important local substance use problems, (2) to target community<br />
prevention <strong>and</strong> treatment strategies, <strong>and</strong> (3) to evaluate the results <strong>of</strong> new policies <strong>and</strong><br />
programs. To this end, the <strong>Hillsborough</strong> <strong>County</strong> Anti <strong>Drug</strong> Alliance <strong>and</strong> Tampa <strong>Alcohol</strong><br />
Coalition contracted with University <strong>of</strong> South Florida FMHI researchers to conduct an<br />
evaluation <strong>of</strong> indicators available throughout <strong>Hillsborough</strong> <strong>County</strong> relevant to alcohol <strong>and</strong><br />
drug use among both adolescents <strong>and</strong> adults. Some <strong>of</strong> the local data was compared to other<br />
counties with similar sized populations in metropolitan areas (Pinellas <strong>and</strong> Orange). Other<br />
data was compared to state averages.<br />
The Indicator Report will be used to help evaluate the effectiveness <strong>of</strong> existing substance<br />
abuse prevention <strong>and</strong> treatment programs, alcohol <strong>and</strong> narcotic law enforcement, substance<br />
abuse awareness activities <strong>and</strong> alcohol <strong>and</strong> other drug policies, to determine the need for<br />
new programs <strong>and</strong> policies, <strong>and</strong> to help secure future funding.<br />
Data Sources<br />
This report describes alcohol <strong>and</strong> other drug trends in <strong>Hillsborough</strong> <strong>County</strong>, using the<br />
data sources summarized below:<br />
• Division <strong>of</strong> <strong>Alcohol</strong>ic Beverages <strong>and</strong> Tobacco (DABT)<br />
• Uniform Crime Report (UCR)<br />
• <strong>Hillsborough</strong> <strong>County</strong> Sheriff’s Office (HCSO)<br />
• <strong>Hillsborough</strong> <strong>County</strong> State Attorney’s Office<br />
• Tampa Police Department (TPD) crime statistics<br />
• National Institute <strong>of</strong> Justice (NIJ)<br />
• National Center for Disease Control’s Behavioral Risk Factor Surveillance System<br />
• National Household Survey on <strong>Drug</strong> Use <strong>and</strong> Health (NSDUH)<br />
• Youth Risk Behavior Surveillance System (YRBSS)<br />
• Florida Youth Substance Abuse Survey (FYSAS)<br />
• Florida Department <strong>of</strong> Highway Safety <strong>and</strong> Motor Vehicles (FDHSMV)<br />
• Florida Department <strong>of</strong> Law Enforcement (FDLE)<br />
• <strong>Hillsborough</strong> <strong>County</strong> Medical Examiner<br />
• Florida Office <strong>of</strong> Vital Statistics<br />
• Central Florida Behavioral Health Network (CFBHN)<br />
8 t <strong>Pr<strong>of</strong>ile</strong> <strong>of</strong> <strong>Alcohol</strong> <strong>and</strong> <strong>Drug</strong> <strong>Indicators</strong> t December 2009
<strong>Hillsborough</strong> <strong>County</strong> Anti <strong>Drug</strong> Alliance <strong>and</strong> Tampa <strong>Alcohol</strong> Coalition Accomplishments<br />
• HCADA’s Students Working Against Tobacco (SWAT) is active in 22 <strong>Hillsborough</strong><br />
<strong>County</strong> middle <strong>and</strong> high schools<br />
• SWAT students successfully advocated for Lowry Park Zoo to become smoke-free as <strong>of</strong><br />
March 28, 2008<br />
• HCADA started the Prescription <strong>Drug</strong> Abuse Task Force in April 2008 in response to<br />
concerns about <strong>Hillsborough</strong>’s high rate <strong>of</strong> prescription drug overdose deaths. The Task<br />
Force successfuly advocated for prescription drug monitoring legislation in 2009 <strong>and</strong><br />
conducted several Operation Medicine Cabinet prescription drug take back events in<br />
2009<br />
• HCADA <strong>and</strong> the Mendez Foundation sponsored the Too Good for <strong>Drug</strong>s Kidfest Walk<br />
<strong>and</strong> Banner Contest, held at the Museum <strong>of</strong> Science <strong>and</strong> Industry (MOSI) in October<br />
2009. Over 6,000 families <strong>and</strong> children participated<br />
• HCSO’s Sheriff’s <strong>Alcohol</strong> Vendors Enforcement (SAVE) program exp<strong>and</strong>ed. Sheriff<br />
Gee gave plaques to Seminole Hard Rock Casino in 2007 for 72% reduction <strong>of</strong> DUI<br />
incidents, to the Dallas Bull in 2008, <strong>and</strong> O’Briens Br<strong>and</strong>on in 2009. HCSO works<br />
with vendors to reduce DUI <strong>and</strong> underage drinking<br />
• The SAVE Symposium sponsored by HCSO, TAC <strong>and</strong> Pepin Distributing was held in<br />
March 2008 with over 100 alcohol vendors attending<br />
• Pepin increased safe ride programs such as Alert Cab for bars<br />
• Zingo Tampa designated driver service started <strong>of</strong>fering safe rides in 2007 <strong>and</strong> their<br />
business grew significantly in 2008. Zingo provided 1,920 safe rides in 2008.<br />
• Several media stories ran on DUI <strong>and</strong> underage drinking with mentions <strong>of</strong> TAC in<br />
2008/ 2009<br />
• Underage Drinking Town Hall Meetings were conducted as a collaboration between<br />
HCADA, TAC <strong>and</strong> Pinellas <strong>County</strong> LiveFree <strong>and</strong> broadcasted on WEDU, March<br />
2007, April 2008, <strong>and</strong> April 2009 (DVD’s available)<br />
• TAC helped pass an “age 21 to enter bars” ordinance in Sarasota <strong>County</strong> in 2007<br />
• TAC won a “Success Story” award at the National Leadership Conference (OJJDP) in<br />
Orl<strong>and</strong>o in August 2007<br />
• TAC advocated against expansion <strong>of</strong> Raymond James Stadium wet zoning to include<br />
hard liquor throughout the stadium because <strong>of</strong> excessive drinking <strong>and</strong> drunk driving<br />
concerns. The Tampa City Council denied the expansion in September 2007<br />
• TAC met with Busch Gardens management <strong>and</strong> legal staff regarding Busch Gardens wet<br />
zoning conditions- new wet zoning passed with conditions in October 2007<br />
• TAC members presented at several local, state <strong>and</strong> national meetings <strong>and</strong> conferences,<br />
including the 2007 OJJDP National Leadership Conference in Orl<strong>and</strong>o<br />
• HCADA <strong>and</strong> TAC provided trainings for law enforcement <strong>of</strong>ficers <strong>and</strong> other coalition<br />
members as well as a training for club promoters in 2009<br />
• <strong>Alcohol</strong> education: Mendez Foundation provided substance abuse prevention teachers<br />
at all <strong>Hillsborough</strong> <strong>County</strong> middle <strong>and</strong> high schools; community education fairs, school<br />
awareness activities, USF/ UT awareness activities, Great American Teach In, DUI<br />
Awareness presentations by Officer John Vallejo in school Drivers Ed classes, UT <strong>and</strong><br />
USF implemented <strong>Alcohol</strong>Edu on-line alcohol awareness education for all freshmen<br />
students<br />
<strong>Pr<strong>of</strong>ile</strong> <strong>of</strong> <strong>Alcohol</strong> <strong>and</strong> <strong>Drug</strong> <strong>Indicators</strong> t December 2009 t 9
<strong>Hillsborough</strong> <strong>County</strong> Anti <strong>Drug</strong> Alliance <strong>and</strong> Tampa <strong>Alcohol</strong> Coalition Accomplishments<br />
• TAC provided DUI prevention campaign materials to USF, UT, <strong>and</strong> HCC in 2009<br />
• TAC provided training for Jesuit SADD students <strong>and</strong> LiveFree coalition students on<br />
media literacy <strong>and</strong> alcohol advocacy to prevent underage drinking in 2007<br />
• TAC provided advocacy training for Gaither High School SADD students in 2008 <strong>and</strong><br />
2009<br />
• TAC participated in Florida Coalition for <strong>Alcohol</strong> Policy (FCAP) to advocate for local<br />
alcohol policies <strong>and</strong> state alcohol legislation in 2008 <strong>and</strong> 2009<br />
• HCSO created a DVD Future Focus for underage drinking/ DUI prevention in schools,<br />
funded by TAC (copies <strong>of</strong> the DVD were distributed to <strong>Hillsborough</strong> <strong>County</strong> Schools)<br />
• TAC, MADD <strong>Hillsborough</strong> <strong>and</strong> DUI Counterattack helped support a number <strong>of</strong><br />
HCSO, USF, TTPD, FHP <strong>and</strong> TPD sobriety checkpoints in 2007, 2008, <strong>and</strong> 2009<br />
• TAC members participated as observers in DABT underage drinking law enforcement<br />
operations including at the Guavaween <strong>and</strong> Gasparilla parades<br />
• TAC successfully advocated for denial <strong>of</strong> the alcohol special use permit for Scoop Bar<br />
<strong>and</strong> Grill in October 2008, based on the Orl<strong>and</strong>o Scoop bar’s business practices <strong>and</strong><br />
“calls for law enforcement service” history<br />
• TAC provided law enforcement with information that aided investigations <strong>of</strong> house<br />
parties <strong>and</strong> retail establishments that sold alcohol to minors, as well as party buses that<br />
provided alcohol to minors<br />
• The TAC DUI Crash Prevention Committee was initiated in 2008<br />
• TAC, Ybor City Development Corporation (YCDC) <strong>and</strong> Ybor neighborhood coalitions<br />
successfully advocated for denial <strong>of</strong> a special alcohol use permit for a new nightclub in<br />
Ybor City in November 2008<br />
• DUI Counterattack’s DUI School enrollment was 5,090 in 2008<br />
• TAC helped mentor other alcohol coalitions throughout the state<br />
• TAC conducted research on the BAC <strong>of</strong> persons leaving bars in a Tampa entertainment<br />
district in 2009<br />
• TAC <strong>and</strong> the University <strong>of</strong> Tampa advocated for more underage drinking law<br />
enforcement <strong>and</strong> prevention education for the Gasparilla Parade in 2009<br />
Too Good for <strong>Drug</strong>s Walk <strong>and</strong> Kidsfest 2008<br />
10 t <strong>Pr<strong>of</strong>ile</strong> <strong>of</strong> <strong>Alcohol</strong> <strong>and</strong> <strong>Drug</strong> <strong>Indicators</strong> t December 2009
<strong>Alcohol</strong> Outlet <strong>Indicators</strong><br />
Table 1. Number <strong>of</strong> <strong>Hillsborough</strong> <strong>County</strong> Active <strong>Alcohol</strong> Licenses, by License Type<br />
# Licenses<br />
Description 2004 2006 2008<br />
<strong>Alcohol</strong> Package Sales Licenses<br />
Beer <strong>and</strong> wine package sales 1,070 1,163 834<br />
Beer only package sales 332 335 218<br />
Beer, wine, <strong>and</strong> liquor package sales 166 194 126<br />
Consumed on Premises Licenses<br />
Beer, wine, <strong>and</strong> liquor package or consumption on premises 773 862 650<br />
Beer <strong>and</strong> wine package or consumption on premises 586 601 549<br />
Beer only package or consumption on premises 41 45 35<br />
Other License Types<br />
Theme parks, bottle clubs, golf clubs, symphony/orchestras 86 89 88<br />
All Licenses 3,054 3,289 2,500<br />
Note. Data obtained from Division <strong>of</strong> <strong>Alcohol</strong>ic Beverages <strong>and</strong> Tobacco (DABT).<br />
• Among alcohol package sales licenses, most were for sale <strong>of</strong> beer <strong>and</strong> wine only, with the fewest being for sale <strong>of</strong><br />
beer, wine, <strong>and</strong> liquor.<br />
• Among licenses allowing consumption on premises, most were for sale <strong>of</strong> beer, wine, <strong>and</strong> liquor, with the fewest<br />
being for sale <strong>of</strong> beer only.<br />
• The number <strong>of</strong> each type <strong>of</strong> alcohol license decreased from 2006 to 2008, <strong>and</strong> in 2008 there were almost 800 fewer<br />
active alcohol licenses than in 2006.<br />
The Seminole Hard Rock Casino - Tampa donated $5,000 to the Tampa <strong>Alcohol</strong><br />
Coalition to support law enforcement <strong>and</strong> alcohol awareness programs.<br />
<strong>Pr<strong>of</strong>ile</strong> <strong>of</strong> <strong>Alcohol</strong> <strong>and</strong> <strong>Drug</strong> <strong>Indicators</strong> t December 2009 t 11
Criminal Justice <strong>Indicators</strong><br />
Table 2. Uniform Crime Report <strong>Alcohol</strong>- <strong>and</strong> <strong>Drug</strong>-Related Offense <strong>and</strong> Arrest Data<br />
<strong>Hillsborough</strong> <strong>County</strong> Pinellas <strong>County</strong> Orange <strong>County</strong><br />
Indicator 2005 2006 2007 2008 2005 2006 2007 2008 2005 2006 2007 2008<br />
DUI arrests 6,797 6,292 6,350 5,375 3,613 3,418 3,451 3,408 3,460 2,906 2,931 3,164<br />
<strong>Drug</strong> / narcotic arrests 13,974 13,666 12,910 11,590 8,298 9,414 9,534 8,623 8,089 8,648 9,164 9,032<br />
Liquor law violations 3,961 3,064 3,031 3,124 2,129 2,129 2,426 3,243 777 709 757 1,230<br />
Note. Uniform Crime Report (UCR) data retrieved through FDLE website:<br />
http://www.fdle.state.fl.us/FSAC/data_statistics.asp<br />
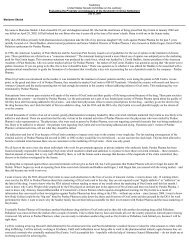
• <strong>Hillsborough</strong>, Orange <strong>and</strong> Pinellas Counties DUI arrests all peaked in 2005.<br />
• <strong>Hillsborough</strong> has nearly as many DUI arrests as both Pinellas <strong>and</strong> Orange Counties combined from 2005-2008<br />
<strong>Hillsborough</strong> <strong>County</strong> reported the most DUI arrests in the state, according to FDLE UCR, 2008.<br />
• There was decrease in the number <strong>of</strong> drug/narcotic arrests in all 3 counties from 2007-2008, with <strong>Hillsborough</strong><br />
having higher rates than Pinellas <strong>and</strong> Orange.<br />
• <strong>Hillsborough</strong> violations decreased in 2006 <strong>and</strong> 2007 then slightly increased in 2008. Pinellas <strong>and</strong> Orange Counties<br />
significantly increased their violation rates in 2008.<br />
Figure 1. Comparison <strong>of</strong> <strong>Hillsborough</strong>, Pinellas <strong>and</strong><br />
Orange <strong>County</strong> DUI Arrests<br />
Figure 2. Comparison <strong>of</strong> <strong>Hillsborough</strong>, Pinellas <strong>and</strong><br />
Orange Counties <strong>Drug</strong>/Narcotic Arrest<br />
<strong>Hillsborough</strong> Pinellas Orange<br />
<strong>Hillsborough</strong> Pinellas Orange<br />
# DU UI Arres sts<br />
15,000<br />
12,000<br />
9,000<br />
6,000<br />
3,000<br />
0<br />
6797<br />
6292 6350<br />
5375<br />
3613<br />
3418 3451<br />
3408<br />
3460 3164<br />
2906 2931<br />
2005 2006 2007 2008<br />
Note. Data are from the Uniform Crime Report (UCR).<br />
c Arres sts<br />
# <strong>Drug</strong>/N Narcoti<br />
15,000<br />
12,000<br />
9,000<br />
6,000<br />
3,000<br />
0<br />
13974 13666<br />
12910<br />
11590<br />
9414 9534<br />
9032<br />
8298<br />
9164<br />
8623<br />
8089 8648<br />
2005 2006 2007 2008<br />
Note. Data are from the Uniform Crime Report (UCR).<br />
12 t <strong>Pr<strong>of</strong>ile</strong> <strong>of</strong> <strong>Alcohol</strong> <strong>and</strong> <strong>Drug</strong> <strong>Indicators</strong> t December 2009
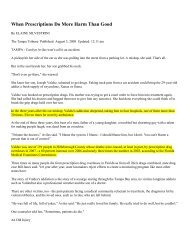
Figure 3. Comparison <strong>of</strong> <strong>Hillsborough</strong>, Pinellas <strong>and</strong><br />
Orange Counties Liquor Law Violations<br />
Figure 4. Number <strong>of</strong> <strong>Hillsborough</strong> <strong>County</strong> DUI Arrests<br />
Law Vi olation ns<br />
# Liquor<br />
4,000<br />
3,200<br />
2,400<br />
1,600<br />
800<br />
0<br />
3961<br />
<strong>Hillsborough</strong> Pinellas Orange<br />
3064<br />
2129 2129<br />
3031<br />
2426<br />
777 709 757<br />
3243<br />
3124<br />
2005 2006 2007 2008<br />
Note. Data are from the Uniform Crime Report (UCR).<br />
1230<br />
# DU UI Arres sts<br />
10,000<br />
9,000<br />
8,000<br />
7,000<br />
6,000<br />
5,000<br />
4,000<br />
3,000<br />
2,000<br />
1,000<br />
0<br />
CBT DUI arrests countywide<br />
7054<br />
HCSO<br />
DUI arrests<br />
6633<br />
DUI arrests aged 18-20<br />
countywide<br />
5910<br />
3387 2843 2812<br />
486<br />
446 353<br />
2006 2007 2008<br />
Note. Data are from the <strong>Hillsborough</strong> <strong>County</strong> Sheriff’s Office.<br />
Table 3. Local Law Enforcement <strong>and</strong> State Attorney’s Office <strong>Alcohol</strong>- <strong>and</strong> <strong>Drug</strong>-Related Offense <strong>and</strong> Arrest Data<br />
<strong>Hillsborough</strong> <strong>County</strong> Indicator 2003 2004 2005 2006 2007 2008<br />
<strong>Hillsborough</strong> <strong>County</strong> Sheriff’s Office<br />
Central Breath Testing Unit DUI arrests county 6,067 6,758 7,134 7,054 6,633 5,910<br />
wide<br />
DUI arrests (HCSO) 3,080 2,980 3,148 3,387 2,843 2812<br />
DUI arrests for persons aged 18 – 20 countywide 464 496 482 486 446 353<br />
Tampa Police Department<br />
DUI arrests 2,253 2,987 3,159 2,956 2,958 2,440<br />
<strong>Drug</strong> <strong>of</strong>fenses / narcotics 4,473 6,425 7,186 8,053 7,428 4,843<br />
<strong>Drug</strong> <strong>of</strong>fenses / equipment 95 168 339 454 320 250<br />
<strong>Hillsborough</strong> <strong>County</strong> State Attorney’s Office Data<br />
Notices to appear for underage drinking -- 890 809 777 598 --<br />
Note. Tampa Police Department data from, Crime Statistics by Grid, Part II Offenses: http://www.tampagov.net/<br />
dept_police/Crime_Statistics/Crime_by_Grid/prt2m_crime_by_grid.asp<br />
• DUI arrests made by HCSO increased from 2004 to 2006, then decreased in 2007 <strong>and</strong> 2008.<br />
• The total number <strong>of</strong> DUI arrests processed through HCSO Central Breath Testing peaked in 2005, while underage<br />
DUI arrests peaked in 2004.<br />
• Tampa Police Department data from 2003 to 2006 indicate that there have been significant increases in both the<br />
number <strong>of</strong> narcotic <strong>and</strong> equipment drug <strong>of</strong>fenses, but both types <strong>of</strong> arrests decreased from 2006 to 2008.<br />
<strong>Pr<strong>of</strong>ile</strong> <strong>of</strong> <strong>Alcohol</strong> <strong>and</strong> <strong>Drug</strong> <strong>Indicators</strong> t December 2009 t 13
General Population Surveys: Adult Prevalence Rates<br />
Table 4. Behavioral Risk Factor Surveillance System Data<br />
<strong>Hillsborough</strong> <strong>County</strong><br />
Florida Statewide<br />
<strong>Alcohol</strong><br />
2005 2006 2007 2005 2006 2007<br />
Adults who have had at least 1 drink <strong>of</strong> alcohol within the past 30 days 53.0% 55.1% 55.4% 55.6% 53.6% 54.4%<br />
Heavy drinkers (adult men having more than two drinks daily, <strong>and</strong> adult 5.6% 5.2% 8.7% 6.9% 5.4% 6.2%<br />
women having more than one drink daily)<br />
Binge drinkers (adults having five or more drinks on one occasion) 14.3% 15.7% 17.5% 14.2% 13.8% 14.2%<br />
within the past 30 days<br />
Tobacco<br />
Current smoking (adults reporting having smoked 100 cigarettes in their 23.0% 20.1% 22.2% 21.7% 21.0% 19.3%<br />
lifetime <strong>and</strong> currently smoke)<br />
Note. Data retrieved from National Center for Disease Control’s Behavioral Risk Factor Surveillance System<br />
http://www.cdc.gov/brfss/index.htm<br />
• <strong>Hillsborough</strong> <strong>County</strong> Behavioral Risk Factor Surveillance System data indicate that adult drinking, binge drinking,<br />
<strong>and</strong> heavy drinking increased from 2006 to 2007.<br />
• <strong>Hillsborough</strong> <strong>County</strong> heavy drinking, binge drinking, <strong>and</strong> smoking rates were all higher than state averages.<br />
14 t <strong>Pr<strong>of</strong>ile</strong> <strong>of</strong> <strong>Alcohol</strong> <strong>and</strong> <strong>Drug</strong> <strong>Indicators</strong> t December 2009
Table 5. District National Household Survey on <strong>Drug</strong> Use <strong>and</strong> Health (NSDUH) Prevalence Data<br />
Circuit 6 (Pasco, Pinellas)<br />
2004, 2005, <strong>and</strong> 2006<br />
Circuit 13 (<strong>Hillsborough</strong>)<br />
<strong>Alcohol</strong><br />
<strong>Alcohol</strong> use, past month 53.5% 48.8%<br />
Binge alcohol use, past month 21.2% 22.2%<br />
Perceptions <strong>of</strong> great risk <strong>of</strong> having<br />
5 or more alcoholic drinks once or<br />
43.2% 46.4%<br />
twice a week<br />
Cigarettes<br />
Cigarette use, past month 26.3% 25.5%<br />
Any tobacco product use, past<br />
month<br />
30.8% 30.2%<br />
Perceptions <strong>of</strong> great risk <strong>of</strong> smoking<br />
one or more packs per day<br />
73.9% 76.8%<br />
Marijuana<br />
Marijuana use, past month 5.7% 6.1%<br />
Annual rate <strong>of</strong> first use <strong>of</strong> marijuana 1.3% 1.6%<br />
Perceptions <strong>of</strong> great risk <strong>of</strong> smoking<br />
marijuana once a month<br />
40.1% 41.6%<br />
Illicit <strong>Drug</strong>s<br />
Illicit drug use, past month 7.2% 8.7%<br />
Any illicit drug use other than<br />
marijuana, past month<br />
3.2% 4.3%<br />
Cocaine use, past year 2.3% 3.0%<br />
Nonmedical use <strong>of</strong> pain relievers,<br />
past year<br />
4.4% 6.2%<br />
Note. NSDUH substate data are reported as annual averages, http://oas.samhsa.gov/substate2k8/SecC.htm<br />
Among the sample, the pattern <strong>of</strong> data from 2004/2006 indicates:<br />
◦{<br />
For past month use, alcohol use was more prevalent than cigarette use, followed by marijuana <strong>and</strong> then other<br />
illicit drugs.<br />
◦{<br />
Circuit 13 (<strong>Hillsborough</strong>) had higher rates <strong>of</strong> illicit drug use including cocaine use, marijuana use, binge drinking,<br />
<strong>and</strong> nonmedical use <strong>of</strong> pain relievers in the past year compared to Circuit 6 (Pasco <strong>and</strong> Pinellas)<br />
◦{<br />
Circuit 6 had higher rates <strong>of</strong> alcohol <strong>and</strong> cigarette use, past month compared to Circuit 13.<br />
<strong>Pr<strong>of</strong>ile</strong> <strong>of</strong> <strong>Alcohol</strong> <strong>and</strong> <strong>Drug</strong> <strong>Indicators</strong> t December 2009 t 15
General Population Surveys: Adolescent Prevalence Rates<br />
Table 6. Youth Risk Behavior Surveillance System <strong>Alcohol</strong> <strong>and</strong> <strong>Drug</strong> Data<br />
<strong>Hillsborough</strong> <strong>County</strong><br />
Florida Statewide<br />
2005 2007 2005 2007<br />
Lifetime Use<br />
<strong>Alcohol</strong> use 72.6% 70.6% 71.3% NA<br />
Marijuana use 38.1% 34.4% 35.2% 35.0%<br />
Past 30-Day Behavior<br />
<strong>Alcohol</strong> use 41.3% 39.4% 39.7% 42.3%<br />
Episodic heavy drinking (5 drinks in a row) 22.5% 21.8% 21.3% 22.8%<br />
Drinking on school property 4.5% 6.5% 6.6% 5.3%<br />
Marijuana use 19.1% 18.1% 16.8% 18.9%<br />
Marijuana use on school property 4.0% 4.6% 4.6% 4.7%<br />
Drove after drinking alcohol 11.5% 10.8% 10.2% 10.0%<br />
Rode in car w/someone who had been drinking 30.0% 26.9% 27.2% 28.2%<br />
Past 12 Months<br />
Offered, given, or sold drugs on school property 32.3% 31.0% 23.2% 19.0%<br />
Note. Data are from the Youth Risk Behavior Surveillance System, http://www.cdc.gov/healthyyouth/yrbs/index.htm<br />
*Data was obtained from surveys <strong>of</strong> high school students.<br />
• Youth Risk Behavior Surveillance System data indicate that, on average, there has been a decrease in lifetime <strong>and</strong><br />
past 30-day alcohol <strong>and</strong> marijuana use. The only increases from 2005 to 2007 were drinking <strong>and</strong> marijuana use on<br />
school property.<br />
• In 2007, <strong>Hillsborough</strong> <strong>County</strong> exceeded the statewide rates for: Past 30-day behavior on drinking on school<br />
property, driving after drinking alcohol, <strong>and</strong> selling, being <strong>of</strong>fered, or being given drugs in the past 12 months. The<br />
rate that <strong>Hillsborough</strong> <strong>County</strong> high school students reported being <strong>of</strong>fered, given or sold drugs was 61% higher<br />
than the state averages in 2007.<br />
• The rate <strong>of</strong> high school students driving after drinking <strong>and</strong> riding in a car with someone who had been drinking<br />
decreased from 2005 to 2007.<br />
16 t <strong>Pr<strong>of</strong>ile</strong> <strong>of</strong> <strong>Alcohol</strong> <strong>and</strong> <strong>Drug</strong> <strong>Indicators</strong> t December 2009
Table 7. Students Reporting Lifetime Use <strong>of</strong> Selected <strong>Drug</strong>s<br />
<strong>Hillsborough</strong> <strong>County</strong><br />
Florida Statewide<br />
<strong>Drug</strong> Type 2002 2004 2006 2008 2002 2004 2006 2008<br />
Any alcohol 57.4% 59.7% 52.0% 52.0% 56.5% 57.5% 56.1% 53.2%<br />
Cigarettes 36.7% 35.6% 27.7% 27.9% 36.2% 34.0% 30.6% 27.0%<br />
Smokeless tobacco use 10.8% 12.6% 8.5% -- 10.4% 9.6% 10.9% --<br />
Marijuana 25.1% 25.9% 20.4% 22.4% 23.6% 23.5% 22.5% 21.1%<br />
Any illicit except marijuana 19.8% 20.6% 18.1% 22.0% 18.8% 19.5% 18.1% 20.7%<br />
<strong>Alcohol</strong> or any illicit drug use 60.8% 62.5% 56.5% 57.4% 59.7% 61.1% 59.5% 57.1%<br />
Inhalant use 12.9% 13.6% 13.2% 13.0% 11.6% 12.9% 12.2% 11.4%<br />
Note. Data obtained from Florida Youth Substance Abuse Survey (FYSAS) <strong>of</strong> middle <strong>and</strong> high school students,<br />
http://www.dcf.state.fl.us/mentalhealth/publications/fysas<br />
• Florida Youth Substance Abuse Survey lifetime drug use data from 2002 to 2008 indicate that:<br />
◦{<br />
<strong>Alcohol</strong> is the most commonly used drug among students in <strong>Hillsborough</strong> <strong>County</strong> <strong>and</strong> Florida Statewide,<br />
followed by cigarettes <strong>and</strong> then marijuana.<br />
◦{<br />
In 2008 <strong>Hillsborough</strong> <strong>County</strong> experienced an increase in reported lifetime use <strong>of</strong> marijuana, cigarettes, <strong>and</strong><br />
illicit drugs while Florida statewide experienced a decrease. Lifetime alcohol use remained the same <strong>and</strong> inhalant<br />
use decreased in <strong>Hillsborough</strong> in 2008.<br />
◦{<br />
In 2008, <strong>Hillsborough</strong> <strong>County</strong>, lifetime student substance abuse rates were higher than state averages, except for<br />
alcohol.<br />
<strong>Pr<strong>of</strong>ile</strong> <strong>of</strong> <strong>Alcohol</strong> <strong>and</strong> <strong>Drug</strong> <strong>Indicators</strong> t December 2009 t 17
Table 8. <strong>Hillsborough</strong> <strong>County</strong> Students Reporting Lifetime Use <strong>of</strong> Selected <strong>Drug</strong>s<br />
Middle School<br />
High School<br />
<strong>Drug</strong> Type 2002 2004 2006 2008 2002 2004 2006 2008<br />
<strong>Alcohol</strong> 42.2% 42.3% 36.1% 36.9% 71.5% 74.5% 65.3% 63.7%<br />
Cigarettes 24.9% 21.0% 17.6% 18.5% 47.6% 47.8% 35.9% 36.0%<br />
Marijuana 11.5% 11.2% 9.0% 11.1% 37.5% 38. 4% 29.5% 31.1%<br />
Inhalants 13.7% 15.4% 12.7% 15.4% 12.2% 11.8% 13.4% 11.1%<br />
Ecstasy 2.8% 2.0% 1.4% -- 10.2% 7.5% 4.7% 4.3%<br />
Rohypnol 0.9% 1.2% 0.5% -- 1.5% 1.0% 1.7% 1.1%<br />
GHB 2.0% 0.6% 1.0% -- 1.3% 1.5% 1.0% 0.3%<br />
Ketamine 0.8% 0.7% 0.3% -- 1.0% 1.5% 1.3% 0.8%<br />
LSD/PCP 1.3% 1.7% 0.5% -- 6.1% 4.1% 2.4% 2.6%<br />
Hallucinogenic<br />
3.8% 2.1% 1.9% -- 5.7% 7.4% 5.8% 4.4%<br />
mushrooms<br />
Cocaine 1.5% 2.5% 0.8% -- 5.6% 6.6% 4.6% 4.8%<br />
Crack cocaine 1.6% 2.2% 0.8% -- 2.6% 2.4% 1.5% 1.5%<br />
Methamphetamine 2.5% 2.0% 1.2% 1.2% 3.2% 3.3% 2.4% 1.0%<br />
Depressants 3.8% 2.6% 1.7% 2.6% 13.0% 14.1% 8.5% 8.8%<br />
Heroin 0.8% 1.2% 0.6% 0.9% 1.3% 0.3% 0.5% 0.9%<br />
Prescription pain<br />
4.8% 4.6% 3.1% 5.9% 10.8% 12.2% 10.5% 10.9%<br />
relievers<br />
Steroids w/o<br />
1.3% 1.2% 0.5% 1.0% 1.8% 1.4% 1.3% 2.0%<br />
prescription<br />
Amphetamines 2.3% 2.8% 1.1% 2.0% 5.6% 7.1% 5.9% 5.9%<br />
Any illicit drug 20.9% 22.2% 19.5% 24.6% 42.3% 44.1% 36.6% 39.1%<br />
Note. Data obtained from FYSAS, http://www.dcf.state.fl.us/mentalhealth/publications/fysas/<br />
• Florida Youth Substance Abuse Survey lifetime drug use data from 2002 to 2008 indicate that:<br />
◦{<br />
<strong>Alcohol</strong> remains the most commonly used drug among both middle <strong>and</strong> high school students.<br />
◦{<br />
For middle school <strong>and</strong> high school students, cigarettes were the second most commonly used drug, followed by<br />
marijuana.<br />
{ ◦ From 2006 to 2008 middle did not report any reductions, though high school students reported decreases in<br />
alcohol, inhalants, ecstasy, rohypnol, GHB, ketamine, mushrooms <strong>and</strong> methamphetamine.<br />
18 t <strong>Pr<strong>of</strong>ile</strong> <strong>of</strong> <strong>Alcohol</strong> <strong>and</strong> <strong>Drug</strong> <strong>Indicators</strong> t December 2009
Table 9. <strong>Hillsborough</strong> <strong>County</strong> Students Reporting Past 30-Day Use <strong>of</strong> Selected <strong>Drug</strong>s<br />
<strong>Drug</strong> Type<br />
Middle School<br />
High School<br />
2002 2004 2006 2008 2002 2004 2006 2008<br />
<strong>Alcohol</strong> 19.5% 19.9% 15.2% 17.8% 41.4% 45.1% 37.5% 40.2%<br />
Binge drinking 8.4% 8.3% 4.7% 5.2% 22.3% 22.9% 20.2% 20.1%<br />
Cigarettes 6.1% 6.8% 4.2% 5.1% 16.0% 18.8% 12.6% 10.8%<br />
Marijuana 6.2% 4.9% 3.8% 5.4% 18.1% 19.0% 14.5% 18.6%<br />
Inhalants 4.9% 6.7% 4.2% 6.4% 3.6% 2.8% 3.0% 1.6%<br />
Ecstasy 1.6% 0.7% 0.4% -- 1.9% 2.1% 1.6% 0.9%<br />
Rohypnol 0.5% 0.9% 0.2% -- 0.4% 0.3% 0.8% 0.3%<br />
GHB 1.4% 0.3% 0.4% -- 0.5% 0.5% 0.7% 0.1%<br />
Ketamine 0.4% 0.5% 0.2% -- 0.1% 0.7% 0.5% 0.2%<br />
LSD/PCP 1.0% 1.3% 0.1% -- 0.7% 0.9% 0.8% 1.1%<br />
Hallucinogen<br />
mushrooms<br />
1.5% 0.9% 0.7% -- 1.5% 1.3% 1.7% 1.8%<br />
Cocaine 0.8% 1.4% 0.3% -- 1.5% 2.4% 1.2% 1.0%<br />
Crack cocaine 0.7% 0.5% 0.2% -- 0.2% 1.0% 0.7% 0.4%<br />
Methamphetamine 1.0% 1.2% 0.5% 0.5% 0.9% 0.8% 0.9% 0.2%<br />
Depressants 1.3% 1.3% 0.8% 1.5% 4.2% 5.8% 2.7% 3.2%<br />
Heroin 0.1% 0.2% 0.3% 0.5% 0.3% 0.0% 0.2% 0.5%<br />
Prescription pain<br />
relievers<br />
2.5% 2.5% 1.5% 4.0% 3.9% 4.6% 2.6% 5.0%<br />
Steroids w/o<br />
prescription<br />
0.8% 0.3% 0.5% 0.8% 0.7% 0.7% 1.1% 0.8%<br />
Amphetamines 1.1% 0.7% 0.6% 1.1% 1.5% 2.1% 1.0% 1.6%<br />
Any illicit drug 10.7% 10.7% 7.8% 13.2% 19.9% 22.0% 17.2% 22.9%<br />
Note. Data obtained from FYSAS, http://www.dcf.state.fl.us/mentalhealth/publications/fysas/<br />
• Florida Youth Substance Abuse Survey past month drug use data from 2002 <strong>and</strong> 2008 indicate:<br />
◦{<br />
<strong>Alcohol</strong> has consistently remained the most commonly used drug among both middle <strong>and</strong> high school students<br />
in 2008.<br />
◦{<br />
Following alcohol, marijuana <strong>and</strong> inhalants were the drugs most commonly used by middle school students in<br />
2008.<br />
◦{<br />
Use <strong>of</strong> prescription pain relievers peaked in 2008 for middle <strong>and</strong> high school students.<br />
◦{<br />
From 2006 to 2008, middle school students’ past 30-day use rates increased in every category <strong>of</strong> substance use.<br />
High school students reported increased rates <strong>of</strong> alcohol, smokeless tobacco, marijuana, mushrooms, LSD,<br />
heroin, <strong>and</strong> prescription drugs <strong>and</strong> decreased rates <strong>of</strong> inhalants, cigarettes, methamphtamine, cocaine <strong>and</strong> ecstasy<br />
use during this period.<br />
<strong>Pr<strong>of</strong>ile</strong> <strong>of</strong> <strong>Alcohol</strong> <strong>and</strong> <strong>Drug</strong> <strong>Indicators</strong> t December 2009 t 19
Table 10. Students Reporting Past 30-Day Use <strong>of</strong> Selected <strong>Drug</strong>s<br />
<strong>Hillsborough</strong> <strong>County</strong><br />
Florida Statewide<br />
<strong>Drug</strong> Type 2002 2004 2006 2008 2002 2004 2006 2008<br />
Any alcohol 30.9% 33.4% 27.5% 29.8% 31.2% 32.3% 32.0% 29.8%<br />
Binge drinking 15.7% 16.3% 13.1% 13.1% 16.0% 16.0% 16.8% 14.8%<br />
Cigarettes 11.3% 13.4% 8.9% 8.1% 11.4% 11.4% 10.6% 9.1%<br />
Smokeless tobacco use 4.2% 4.9% 3.6% -- 3.9% 3.7% 4.6% --<br />
Marijuana 12.3% 12.6% 9.8% 12.4% 12.1% 11.5% 11.4% 11.1%<br />
Inhalant use 4.3% 4.6% 3.6% 3.9% 3.6% 4.2% 3.9% 3.5%<br />
Any illicit except marijuana 7.6% 9.1% 6.4% 10.4% 7.5% 8.0% 7.3% 8.9%<br />
<strong>Alcohol</strong> or any illicit drug 35.1% 37.6% 30.8% 35.4% 34.8% 36.1% 35.4% 33.9%<br />
use<br />
Note. Data obtained from FYSAS, http://www.dcf.state.fl.us/mentalhealth/publications/fysas/<br />
• Florida Youth Substance Abuse Survey past 30-day drug use data from 2002 to 2008 indicate that:<br />
◦{<br />
<strong>Alcohol</strong> is the most commonly used drug among <strong>Hillsborough</strong> <strong>County</strong> <strong>and</strong> Florida Statewide.<br />
◦{<br />
<strong>Hillsborough</strong> <strong>County</strong> rates for binge drinking <strong>and</strong> cigarettes reached their lowest levels in 2008; in contrast,<br />
marijuana, inhalant use, use <strong>of</strong> any illicit drug except marijuana, <strong>and</strong> use <strong>of</strong> alcohol or any illicit drug increased<br />
in 2008.<br />
◦{<br />
<strong>Hillsborough</strong> <strong>County</strong> rates in 2008 continued to fall below Statewide rates for alcohol <strong>and</strong> cigarette use; however,<br />
other drug use including marijuana, inhalant use <strong>and</strong> illicit drugs exceeded the Statewide rates in 2008.<br />
Figure 5. Past 30-Day Middle <strong>and</strong> High School <strong>Alcohol</strong> Use:<br />
<strong>Hillsborough</strong> <strong>County</strong> vs. Statewide<br />
Figure 6. Past 30-Day Middle <strong>and</strong> High School Binge<br />
Drinking: <strong>Hillsborough</strong> <strong>County</strong> vs. Statewide<br />
% drinking past month<br />
40%<br />
30%<br />
20%<br />
10%<br />
0%<br />
<strong>Hillsborough</strong> <strong>County</strong> Florida Statewide<br />
33.4%<br />
31.2%<br />
32.0%<br />
32.3%<br />
29.8%<br />
30.9%<br />
27.5%<br />
2002 2004 2006 2008<br />
Note. D ata are from the Florida Youth S ubstance A buse S urvey (FYSAS).<br />
% drinking past month<br />
20%<br />
15%<br />
10%<br />
5%<br />
0%<br />
H illsborough C ounty Florida Statewide<br />
16.3%<br />
16.8%<br />
16.0%<br />
15.7%<br />
16.0%<br />
13.1%<br />
14.8%<br />
13.1%<br />
2002 2004 2006 2008<br />
Note. D ata are from the Florida Youth S ubstance A buse S urvey (FYSAS).<br />
20 t <strong>Pr<strong>of</strong>ile</strong> <strong>of</strong> <strong>Alcohol</strong> <strong>and</strong> <strong>Drug</strong> <strong>Indicators</strong> t December 2009
Table 11. Mean Age <strong>of</strong> First Substance Use among <strong>Hillsborough</strong> <strong>County</strong> Students<br />
Measure<br />
Middle School<br />
High School<br />
2002 2004 2006 2008 2002 2004 2006 2008<br />
More than a sip or two <strong>of</strong> alcohol 11.3 11.4 11.3 11.6 13.2 13.2 13.3 13.4<br />
Drinking at least once a month 12.4 12.2 12.2 NA* 14.7 14.6 14.8 NA*<br />
Cigarettes 11.2 11.4 11.2 11.4 12.8 12.7 12.7 13.2<br />
Marijuana 12.0 12.3 12.1 12.4 14.1 14.0 13.9 14.3<br />
Note. Data obtained from FYSAS, http://www.dcf.state.fl.us/mentalhealth/publications/fysas/<br />
• Florida Youth Substance Abuse Survey drug use data from 2000 to 2008 indicate:<br />
◦{<br />
On average, middle <strong>and</strong> high school students report first trying cigarettes at a younger age than when they first<br />
tried more than a sip or two <strong>of</strong> alcohol.<br />
◦{<br />
On average, high school students report first drinking on a monthly basis at an older age than when they first<br />
tried marijuana.<br />
• NA* - This data was not available.<br />
Table 12. Percent <strong>of</strong> <strong>Hillsborough</strong> <strong>County</strong> Students Reporting <strong>Drug</strong>-Related Behavior<br />
Middle School<br />
High School<br />
<strong>Drug</strong>-Related Behavior 2002 2004 2006 2008 2002 2004 2006 2008<br />
Selling drugs 3.7% 3.9% 2.7% 3.4% 8.3% 9.6% 6.6% 9.5%<br />
Drunk or high at school 6.8% 7.1% 5.7% 8.8% 18.8% 19.2% 18.0% 16.3%<br />
• Florida Youth Substance Abuse Survey drug-related behavior data from 2002 to 2008 indicate that:<br />
◦{<br />
Middle school students reported increased rates <strong>of</strong> selling drugs <strong>and</strong> being drunk or high at school from 2006<br />
to 2008.<br />
◦{<br />
Among high school students, rates <strong>of</strong> being drunk or high at school were lowest in 2008, though rates <strong>of</strong> selling<br />
drugs increased from 2006 to 2008.<br />
<strong>Pr<strong>of</strong>ile</strong> <strong>of</strong> <strong>Alcohol</strong> <strong>and</strong> <strong>Drug</strong> <strong>Indicators</strong> t December 2009 t 21
Mortality Data<br />
Table 13. <strong>Hillsborough</strong> <strong>County</strong> <strong>Drug</strong>-Related Deaths by Lethal/Non-Lethal Levels<br />
Lethal Levels:<br />
<strong>Drug</strong> Was Cause <strong>of</strong> Death<br />
Non-Lethal Levels:<br />
<strong>Drug</strong> Was Present<br />
<strong>Drug</strong>s 2004 2005 2006 2007 2008 2004 2005 2006 2007 2008<br />
Cocaine 52 54 50 71 61 56 61 80 87 85<br />
Methadone 39 30 49 77 72 9 10 13 15 14<br />
Oxycodone 25 26 30 81 101 16 24 30 34 27<br />
Hydrocodone 21 11 18 45 28 16 15 32 30 22<br />
Heroin 14 6 7 10 5 0 0 0 1 0<br />
Morphine 11 16 22 18 32 19 47 50 34 21<br />
Alprazolam 11 25 55 89 79 9 23 28 43 41<br />
Diazepam 8 8 6 23 14 10 10 14 13 18<br />
Propoxyphene 6 4 7 9 6 5 13 10 14 14<br />
Note. Lethal levels indicate overdoses in which the drug was the cause <strong>of</strong> death, whereas non-lethal levels indicate<br />
instances in which the drug was merely present.<br />
• Florida Department <strong>of</strong> Law Enforcement, 2007 Report <strong>of</strong> <strong>Drug</strong>s Identified in Deceased Persons by Florida Medical<br />
Examiners, June 2008: http://www.fdle.state.fl.us/publications/Examiners/2007MER<strong>Drug</strong>Report.pdf<br />
• <strong>Hillsborough</strong> <strong>County</strong> <strong>Drug</strong>-Related Death data from 2004 - 2008 indicate that:<br />
◦{<br />
The overall number <strong>of</strong> lethal level deaths decreased between 2007 <strong>and</strong> 2008; however, deaths resulting from<br />
lethal levels <strong>of</strong> oxycodone <strong>and</strong> morphine increased. One hundred <strong>and</strong> one deaths were caused by oxycodone in<br />
2008.<br />
◦{<br />
In 2008, there has been a steady decrease in the number <strong>of</strong> non-lethal level deaths due to cocaine, methadone,<br />
oxycodone, hydrocodone, morphine, <strong>and</strong> alprazolam; there have been no deaths in which non-lethal levels <strong>of</strong><br />
heroin were detected.<br />
◦{<br />
In 2008, the prescription drugs oxycodone, alprazolam, <strong>and</strong> methodone were most commonly found in lethal<br />
levels, followed by cocaine.<br />
22 t <strong>Pr<strong>of</strong>ile</strong> <strong>of</strong> <strong>Alcohol</strong> <strong>and</strong> <strong>Drug</strong> <strong>Indicators</strong> t December 2009
Figure 7. Comparison <strong>of</strong> <strong>Hillsborough</strong> <strong>County</strong> <strong>Drug</strong>-Related Deaths by Lethal Level<br />
# Death s<br />
120<br />
100<br />
80<br />
60<br />
40<br />
20<br />
0<br />
30<br />
25<br />
25<br />
55<br />
54 50<br />
49<br />
30<br />
Alprazalom<br />
Methadone<br />
89<br />
81<br />
77<br />
71<br />
Oxycodone<br />
Cocaine<br />
101<br />
79<br />
72<br />
2005 2006 2007 2008<br />
61<br />
s<br />
# Deaths<br />
50<br />
40<br />
30<br />
20<br />
10<br />
0<br />
Hydrocodone<br />
Morphine<br />
45<br />
Diazepam<br />
Heroin<br />
32<br />
28<br />
22<br />
23<br />
16 18<br />
18<br />
11<br />
10<br />
14<br />
8<br />
7<br />
6<br />
6<br />
5<br />
2005 2006 2007 2008<br />
Note. Data from Florida Department <strong>of</strong> Law Enforcement, 2007 Report <strong>of</strong> <strong>Drug</strong>s Identified in Deceased Persons by Florida Medical<br />
Examiners, June 2008: http://www.fdle.state.fl.us/publications/Examiners/2007MER<strong>Drug</strong>Report.pdf<br />
Note. Data from Florida Department <strong>of</strong> Law Enforcement, 2007 Report <strong>of</strong> <strong>Drug</strong>s Identified in Deceased Persons by Florida Medical Examiners,<br />
June 2008: http://www.fdle.state.fl.us/publications/Examiners/2007MER<strong>Drug</strong>Report.pdf<br />
Table 14. <strong>Alcohol</strong>-Related Crashes, Injuries <strong>and</strong> Fatalities<br />
<strong>Hillsborough</strong> <strong>County</strong> Pinellas <strong>County</strong> Orange <strong>County</strong><br />
Indicator 2005 2006 2007 2008 2005 2006 2007 2008 2005 2006 2007 2008<br />
Crashes 1,939 1,937 1,925 1,788 1,631 1,533 1,443 1,390 1,353 1,322 1,352 1,373<br />
Injuries 1,332 1,273 1,414 1,339 1,162 987 942 895 1,038 952 870 987<br />
Fatalities 59 60 87 77 39 48 40 51 75 64 76 77<br />
Note. Data obtained from Florida Department <strong>of</strong> Highway Safety <strong>and</strong> Motor Vehicles, http://www.hsmv.state.fl.us/<br />
• Florida Department <strong>of</strong> Highway Safety <strong>and</strong> Motor Vehicle data indicate that <strong>Hillsborough</strong> <strong>County</strong> has a higher<br />
number <strong>of</strong> alcohol-related crashes, injuries, <strong>and</strong> fatalities than the comparably sized Pinellas <strong>and</strong> Orange Counties,<br />
although in 2008 both Orange <strong>and</strong> <strong>Hillsborough</strong> crashed reported 77 fatalities.<br />
• From 2007 to 2008, <strong>Hillsborough</strong> <strong>County</strong> experienced a decrease in alcohol-related injuries <strong>and</strong> fatalities.<br />
<strong>Pr<strong>of</strong>ile</strong> <strong>of</strong> <strong>Alcohol</strong> <strong>and</strong> <strong>Drug</strong> <strong>Indicators</strong> t December 2009 t 23
Figure 8. Comparison <strong>of</strong> <strong>Hillsborough</strong>, Pinellas <strong>and</strong> Orange<br />
Counties <strong>Alcohol</strong>-Related Crashes<br />
Figure 9. Comparison <strong>of</strong> <strong>Hillsborough</strong>, Pinellas <strong>and</strong><br />
Orange Counties <strong>Alcohol</strong>-Related Injuries<br />
2500<br />
<strong>Hillsborough</strong> Pinellas Orange<br />
2000<br />
<strong>Hillsborough</strong> Pinellas Orange<br />
es<br />
# <strong>of</strong> Crash<br />
2000<br />
1500<br />
1000<br />
500<br />
1939 1937 1925<br />
1788<br />
1631<br />
1533 1443 1390<br />
1353 1322 1352<br />
1373<br />
f Injuries<br />
# <strong>of</strong><br />
1414<br />
1500 1332<br />
1273<br />
s339 1339<br />
1162<br />
987 942<br />
987<br />
1000<br />
1038<br />
952<br />
895<br />
870<br />
500<br />
0<br />
2005 2006 2007 2008<br />
Note. Data obtained from Florida DHSMV.<br />
0<br />
2005 2006 2007 2008<br />
Note. Data obtained from Florida DHSMV.<br />
Figure 10. Comparison <strong>of</strong> <strong>Hillsborough</strong>, Pinellas <strong>and</strong><br />
Orange Counties <strong>Alcohol</strong>-Related Fatalities<br />
Figure 11. Percentage <strong>of</strong> Statewide Rates for<br />
<strong>Hillsborough</strong> <strong>County</strong> DUI Arrests <strong>and</strong> <strong>Alcohol</strong>-Related<br />
Crashes, Injuries <strong>and</strong> Fatalities<br />
# <strong>of</strong> Fataliti ies<br />
100<br />
75<br />
50<br />
25<br />
75<br />
59<br />
39<br />
<strong>Hillsborough</strong> Pinellas Orange<br />
64<br />
48<br />
60<br />
76<br />
40<br />
87<br />
77<br />
51<br />
centage e<br />
Per<br />
14%<br />
12%<br />
10%<br />
8%<br />
6%<br />
4%<br />
2%<br />
DUI arrests<br />
<strong>Alcohol</strong>-related crashes<br />
<strong>Alcohol</strong>-related injuries <strong>Alcohol</strong>-related fatalities<br />
11.4%<br />
11.8%<br />
10.8%<br />
8.5%<br />
8.7%<br />
8.6%<br />
8.1%<br />
8.3%<br />
8 4%<br />
7.8%<br />
7.5% 7.8%<br />
5.5% 7.0% 6.6%<br />
4.8%<br />
0<br />
2005 2006 2007 2008<br />
Note. Data obtained from Florida DHSMV.<br />
0%<br />
2005 2006 2007 2008<br />
Note. Data are from Florida DMVHS <strong>and</strong> Uniform Crime Report (UCR).<br />
24 t <strong>Pr<strong>of</strong>ile</strong> <strong>of</strong> <strong>Alcohol</strong> <strong>and</strong> <strong>Drug</strong> <strong>Indicators</strong> t December 2009
Type <strong>of</strong> Death<br />
Table 15. 2006 <strong>Hillsborough</strong> <strong>County</strong> Medical Examiner Autopsy Data on Persons Aged 15 to 24<br />
#<br />
Demographics<br />
Male White 1 Mean (SD)<br />
Age<br />
w/any<br />
<strong>Alcohol</strong><br />
Mentioned 2<br />
<strong>Alcohol</strong> <strong>and</strong> <strong>Drug</strong> Use<br />
# Tested<br />
for<br />
<strong>Alcohol</strong><br />
Mean (SD) w/<br />
Indication<br />
<strong>Alcohol</strong> <strong>of</strong> Illicit<br />
Level 3 <strong>Drug</strong>s 4<br />
Accident 31 77.4% 93.5% 21.25 (2.76) 54.8% 30 .158 (.118) 71.0%<br />
<strong>Alcohol</strong> <strong>and</strong>/or drug 21 76.2% 100% 21.45 (2.92) 61.9% 21 .153 (.131) 95.2%<br />
abuse<br />
Drowning 3 100% 100% 23.03 (1.54) 66.7% 3 .225 (.148) 66.7%<br />
Climbed into balloon 2 50.0% 100% 21.43 (0.04) 100% 2 .110 (.014) 0%<br />
Fall 1 100% 0% 22.49 (0.00) 0% 1 -- 0%<br />
Hit by ornamental sword 1 100% 100% 15.87 (0.00) 0% 1 -- 0%<br />
Struck by lightning 1 100% 100% 19.04 (0.00) 0% 1 -- 0%<br />
Gasoline 1 100% 0% 20.20 (0.00) 0% 0 -- 0%<br />
Medical error 1 0% 100% 18.70 (0.00) 0% 1 -- 0%<br />
Automobile accident 53 71.7% 92.5% 20.10 (2.45) 39.6% 51 .164 (.072) 9.4%<br />
Driver 32 84.4% 93.8% 20.98 (1.99) 50.0% 30 .171 (.075) 6.3%<br />
Passenger 17 47.1% 94.1% 19.24 (2.46) 29.4% 17 .142 (.063) 5.9%<br />
Pedestrian 4 75.0% 75.0% 16.80 (2.12) 0% 4 -- 50.0%<br />
Suicide 18 72.2% 94.4% 19.89 (2.54) 33.3% 18 .110 (.076) 27.8%<br />
Gunshot 8 100% 100% 19.65 (2.15) 25.0% 8 .080 (.000) 25.0%<br />
Hanging 6 66.7% 83.3% 20.29 (3.27) 50.0% 6 .165 (.064) 0%<br />
Intentional overdose 2 0% 100% 19.73 (4.59) 0% 2 -- 100%<br />
Drove car into wall 1 0% 100% 18.92 (0.00) 0% 1 -- 100%<br />
Jumped into bay 1 100% 100% 20.75 (0.00) 100% 1 .030 (.000) 0%<br />
TOTAL 102 73.5% 93.1% 20.42 43.1% 99 .156<br />
(2.60)<br />
(.088)<br />
31.4%<br />
1<br />
. In all cases, victims were either white or black.<br />
2.<br />
This represents cases in which there was a positive alcohol tests or alcohol was mentioned in the case description.<br />
3.<br />
Calculations based on only the persons testing positive for any alcohol in their system.<br />
4.<br />
Complete toxicology screens were not available, so these data likely underestimate the extent <strong>of</strong> illicit drug use.<br />
• In 2006, there were 102 accidental <strong>and</strong> suicidal deaths in <strong>Hillsborough</strong> <strong>County</strong> for persons aged 15 to 24 years old;<br />
approximately 43% had some mention <strong>of</strong> alcohol in their autopsy report <strong>and</strong> those with alcohol present had a mean<br />
blood alcohol content (BAC) level <strong>of</strong> .156.<br />
<strong>Pr<strong>of</strong>ile</strong> <strong>of</strong> <strong>Alcohol</strong> <strong>and</strong> <strong>Drug</strong> <strong>Indicators</strong> t December 2009 t 25
Figure 12. Autopsy Data BAC Level for Youth Ages 15 to 24<br />
Years by Manner <strong>of</strong> Death<br />
Figure 13. Autopsy Data Indication <strong>of</strong> <strong>Alcohol</strong> for Youth<br />
Ages 15 to 24 Years by Manner <strong>of</strong> Death<br />
BAC Level<br />
0.25<br />
0.2<br />
0.15<br />
0.1<br />
0.05<br />
.153<br />
.225<br />
.110<br />
0.171<br />
0.142<br />
0.08<br />
0.165<br />
0.03<br />
Mention <strong>of</strong> <strong>Alcohol</strong><br />
100%<br />
80%<br />
60%<br />
40%<br />
20%<br />
61.9% 66.7% 100%<br />
50%<br />
29.4%<br />
25%<br />
50%<br />
100%<br />
0<br />
Substance<br />
abuse<br />
(n=21)<br />
Drowning<br />
(n=3)<br />
Climbed in<br />
balloon<br />
(n=2)<br />
Car<br />
accidentdriver<br />
(n=30)<br />
Car<br />
accidentpassenger<br />
(n=17)<br />
Suicidegun<br />
(n=8)<br />
Suicidehanging<br />
(n=6)<br />
Suicidejumped<br />
in<br />
Bay (n=1)<br />
0%<br />
Substance<br />
abuse<br />
(n=21)<br />
Drowning<br />
(n=3)<br />
Climbed<br />
in balloon<br />
(n=2)<br />
Car<br />
accidentdriver<br />
(n=30)<br />
Car<br />
accidentpassenger<br />
(n=17)<br />
Suicidegun<br />
(n=8)<br />
Suicidehanging<br />
(n=6)<br />
Suicidejumped<br />
in<br />
Bay (n=1)<br />
Accidents<br />
Suicides<br />
Accidents<br />
Suicides<br />
Note. D ata from H illsborough C ounty M edical E xam iner’s O ffice (2006)<br />
Note. D ata from H illsborough C ounty M edical E xam iner’s O ffice (2006)<br />
Chronic Liver Disease <strong>and</strong><br />
Cirrhosis<br />
Table 16. Community Health Assessment Resource Tool Set (CHARTS), <strong>Hillsborough</strong> <strong>County</strong> Data<br />
<strong>Hillsborough</strong> <strong>County</strong> Pinellas <strong>County</strong> Orange <strong>County</strong><br />
2005 2006 2007 2008 2005 2006 2007 2008 2005 2006 2007 2008<br />
Number <strong>of</strong> deaths 125 97 129 117 129 150 144 156 81 84 96 90<br />
Percent <strong>of</strong> total 1.4% 1.1% 1.5% 1.3% 1.1% 1.3% 1.3% 1.4% 1.2% 1.3% 1.5% 1.3%<br />
deaths<br />
Age-adjusted death 11.1 8.1 10.5 9.5 10.0 12.1 11.6 12.4 8.4 8.3 9.5 9.0<br />
rate per 100,000<br />
Note. Data based on Florida Office <strong>of</strong> Vital Statistics retrieved from http://www.floridacharts.com/charts/chart.aspx<br />
• <strong>Hillsborough</strong> <strong>and</strong> Orange <strong>County</strong> CHARTS data indicate that there was a decrease in the number <strong>and</strong> percent <strong>of</strong><br />
total deaths attributable to chronic liver disease <strong>and</strong> cirrhosis from 2007 to 2008.<br />
• In 2008, the age adjusted health rate from liver disease in <strong>Hillsborough</strong> <strong>County</strong> was lower than Pinellas but higher<br />
than Orange <strong>County</strong>.<br />
26 t <strong>Pr<strong>of</strong>ile</strong> <strong>of</strong> <strong>Alcohol</strong> <strong>and</strong> <strong>Drug</strong> <strong>Indicators</strong> t December 2009
Treatment Data<br />
Table 17. Admission to <strong>Hillsborough</strong> <strong>County</strong> Substance Abuse Treatment Providers<br />
Fiscal Year<br />
2005/2006<br />
<strong>Hillsborough</strong> <strong>County</strong><br />
Fiscal Year<br />
2006/2007<br />
Fiscal Year<br />
2007/2008<br />
Fiscal Year<br />
2005/2006<br />
Pinellas <strong>County</strong><br />
Fiscal Year<br />
2006/2007<br />
Fiscal Year<br />
2007/2008<br />
Adults<br />
Residential 165 433 426 91 833 714<br />
Outpatient 1,764 1,792 1,594 22 756 580<br />
Detox 1,343 1,090 958 -- 1,351 1,186<br />
Children<br />
Residential 56 60 75 -- 126 124<br />
Outpatient 627 894 831 195 392 409<br />
Detox 412 493 512 316 270 307<br />
Note. Data obtained from Central Florida Behavioral Health Network<br />
• In <strong>Hillsborough</strong> <strong>County</strong>, outpatient services were most common <strong>and</strong> residential services were least common for<br />
children <strong>and</strong> adults from 2005/06 to 2007/08.<br />
• In Pinellas <strong>County</strong>, residential services were more common than outpatient services for adults from 2005/06 to<br />
07/08.<br />
• In <strong>Hillsborough</strong> <strong>County</strong>, each type <strong>of</strong> adult admission decreased from 2006/07 to 2007/08, though there was an<br />
increase in children’s residential <strong>and</strong> detox services during this time.<br />
Figure 14. Adult Admission to <strong>Hillsborough</strong> <strong>County</strong><br />
Substance Abuse <strong>and</strong> Treatment Providers<br />
Figure 15. Child Admissions to <strong>Hillsborough</strong> <strong>County</strong><br />
Substance Abuse Treatment Providers<br />
# Admissions<br />
3000<br />
2500<br />
2000<br />
1500<br />
1000<br />
500<br />
0<br />
Residential Non-Residential Detox<br />
1792<br />
1764<br />
1594<br />
1343<br />
1090<br />
958<br />
433<br />
426<br />
165<br />
FY 05/06 FY 06/07 FY 07/08<br />
Note. D ata obtained from the Florida D ept. <strong>of</strong> C hildren <strong>and</strong> Fam ilies (D FC ).<br />
# Admissions<br />
900<br />
800<br />
700<br />
600<br />
500<br />
400<br />
300<br />
200<br />
100<br />
0<br />
Residential Non-Residential Detox<br />
894 831<br />
627<br />
493<br />
512<br />
412<br />
60 75<br />
56<br />
FY 05/06 FY 06/07 FY 07/08<br />
Note. D ata obtained from the Florida D ept. <strong>of</strong> C hildren <strong>and</strong> Fam ilies (D FC ).<br />
<strong>Pr<strong>of</strong>ile</strong> <strong>of</strong> <strong>Alcohol</strong> <strong>and</strong> <strong>Drug</strong> <strong>Indicators</strong> t December 2009 t 27
Appendix A - <strong>Hillsborough</strong> <strong>County</strong> Sheriff’s Office (HCSO) <strong>and</strong> Tampa Police Department Figure/Maps<br />
HCSO DUI Arrests, DUI<br />
Related Traffic Crashes,<br />
And Traffic Fatals<br />
HCSO 2007 2008 % Change<br />
DUI Arrests 2,923 2,907 -0.5%<br />
.02 Violations 76 44 -42.1%<br />
Totals 2,999 2,951 -1.6%<br />
HCSO<br />
2007 2008 % Change<br />
DUI Related Traffic Crashes 651 594 -8.8%<br />
HCSO 2007 2008 % Change<br />
Traffic Fatals 68 55 -19.1<br />
Arrest Data from CFS Reports (2007), <strong>and</strong> Versadex (2008);<br />
Crash data from HCSO Crash Database Management System<br />
28 t <strong>Pr<strong>of</strong>ile</strong> <strong>of</strong> <strong>Alcohol</strong> <strong>and</strong> <strong>Drug</strong> <strong>Indicators</strong> t December 2009
2007 HCSO DUI Related Traffic Crashes<br />
Data from HCSO Crash Database Management System<br />
<strong>Pr<strong>of</strong>ile</strong> <strong>of</strong> <strong>Alcohol</strong> <strong>and</strong> <strong>Drug</strong> <strong>Indicators</strong> t December 2009 t 29
2008 DUI Related Fatality Crashes by <strong>County</strong><br />
30 t <strong>Pr<strong>of</strong>ile</strong> <strong>of</strong> <strong>Alcohol</strong> <strong>and</strong> <strong>Drug</strong> <strong>Indicators</strong> t December 2009
2008 DUI Related Crashes by <strong>County</strong><br />
<strong>Pr<strong>of</strong>ile</strong> <strong>of</strong> <strong>Alcohol</strong> <strong>and</strong> <strong>Drug</strong> <strong>Indicators</strong> t December 2009 t 31
TABLE 5 Crash for Drinking Drivers in Crashes By Age Groups in <strong>Hillsborough</strong><br />
Age Groups<br />
Drinking Drivers All Crashes Drinking Drivers Fatal Crashes<br />
15-1919 81<br />
7<br />
20-24 259<br />
9<br />
25-29 213<br />
11<br />
30-34 137<br />
12<br />
35-39 145<br />
5<br />
40-44 118<br />
3<br />
45-49 102<br />
5<br />
50-54 74<br />
5<br />
55-5959 40<br />
0<br />
60-64 23<br />
2<br />
65-69 19<br />
0<br />
70-74 4<br />
0<br />
75-79 2<br />
0<br />
80-84 1<br />
0<br />
85-89 2<br />
0<br />
Not Stated 15<br />
0<br />
TOTAL 1,235<br />
59<br />
Report Year: 2008<br />
TABLE 7 Drinking Drivers in Crashes for a Selected Age Group(15-29) in <strong>Hillsborough</strong><br />
Age <strong>of</strong> Driver<br />
Drinking Drivers All Crashes Drinking Drivers Fatal Crashes<br />
15<br />
16<br />
17<br />
18<br />
19<br />
20<br />
21<br />
22<br />
1 5<br />
14<br />
28<br />
33<br />
36<br />
54<br />
61<br />
0<br />
0<br />
2<br />
2<br />
3<br />
3<br />
1<br />
2<br />
23<br />
24<br />
25<br />
26<br />
27<br />
28<br />
29<br />
46 1<br />
62 2<br />
57 5<br />
42 3<br />
40 1<br />
41 0<br />
33 2<br />
Report Year: 2008<br />
32 t <strong>Pr<strong>of</strong>ile</strong> <strong>of</strong> <strong>Alcohol</strong> <strong>and</strong> <strong>Drug</strong> <strong>Indicators</strong> t December 2009
800<br />
700<br />
2008 HCSO DUI Arrests by Day <strong>of</strong> the Week 2007<br />
600<br />
685<br />
500<br />
534<br />
544<br />
400<br />
428<br />
300<br />
200<br />
189<br />
248<br />
280<br />
100<br />
0<br />
Sun Mon Tue Wed Thu Fri Sat<br />
Data from HCSO Versadex completed CAD Calls<br />
500<br />
450<br />
400<br />
350<br />
343<br />
2008 HCSO DUI Arrests by Hour <strong>of</strong> Day<br />
437<br />
423<br />
371<br />
2008 HCSO DUI Arrests by Hour <strong>of</strong> Day<br />
300<br />
250<br />
245<br />
200<br />
210<br />
150<br />
100<br />
126<br />
118<br />
135<br />
163<br />
50<br />
0<br />
67<br />
49<br />
46<br />
37<br />
19 21<br />
16 16<br />
19<br />
10 10 13<br />
7 7<br />
00 01 02 03 04 05 06 07 08 09 10 11 12 13 14 15 16 17 18 19 20 21 22 23<br />
Data from HCSO Versadex completed CAD Calls<br />
<strong>Pr<strong>of</strong>ile</strong> <strong>of</strong> <strong>Alcohol</strong> <strong>and</strong> <strong>Drug</strong> <strong>Indicators</strong> t December 2009 t 33
1.00<br />
0.90<br />
0.80<br />
State <strong>of</strong> Florida vs. <strong>Hillsborough</strong> <strong>County</strong><br />
<strong>Alcohol</strong> Related Fatality Rates Per 100 Million VMT<br />
State <strong>of</strong> Florida<br />
<strong>Hillsborough</strong> <strong>County</strong><br />
0.70<br />
0.60<br />
0.50<br />
0.40<br />
0.30<br />
0.20<br />
0.10<br />
0.00<br />
1996 1997 1998 1999 2000 2001 2002 2003 2004 2005 2006 2007 2008<br />
25.00<br />
State <strong>of</strong> Florida vs. <strong>Hillsborough</strong> <strong>County</strong><br />
<strong>Alcohol</strong> Related Injury Rates Per 100 Million VMT<br />
20.00<br />
15.00<br />
State <strong>of</strong> Florida<br />
<strong>Hillsborough</strong> <strong>County</strong><br />
10.00<br />
5.00<br />
0.00<br />
1996 1997 1998 1999 2000 2001 2002 2003 2004 2005 2006 2007 2008<br />
34 t <strong>Pr<strong>of</strong>ile</strong> <strong>of</strong> <strong>Alcohol</strong> <strong>and</strong> <strong>Drug</strong> <strong>Indicators</strong> t December 2009
30.00<br />
State <strong>of</strong> Florida vs. <strong>Hillsborough</strong> <strong>County</strong><br />
<strong>Alcohol</strong> Related Crash Rates Per 100 Million VMT<br />
25.00<br />
20.00<br />
State <strong>of</strong> Florida<br />
<strong>Hillsborough</strong> <strong>County</strong><br />
15.00<br />
10.00<br />
5.00<br />
0.00<br />
1996 1997 1998 1999 2000 2001 2002 2003 2004 2005 2006 2007 2008<br />
Source: Florida Department <strong>of</strong> Transportation<br />
<strong>Pr<strong>of</strong>ile</strong> <strong>of</strong> <strong>Alcohol</strong> <strong>and</strong> <strong>Drug</strong> <strong>Indicators</strong> t December 2009 t 35
60<br />
2008 HCSO DUI Related Traffic Crashes by Hour<br />
56<br />
50<br />
50<br />
43<br />
43<br />
44<br />
40<br />
38<br />
39<br />
39<br />
30<br />
28<br />
33<br />
26<br />
31<br />
24<br />
20<br />
10<br />
13<br />
10<br />
10<br />
9<br />
15<br />
14<br />
7<br />
6<br />
6<br />
5<br />
5<br />
0<br />
00 01 02 03 04 05 06 07 08 09 10 11 12 13 14 15 16 17 18 19 20 21 22 23<br />
Data from HCSO Crash Geodatabase<br />
120<br />
2008 HCSO DUI Related Traffic Crashes by Day <strong>of</strong> Week<br />
100<br />
80<br />
60<br />
105<br />
110<br />
114<br />
40<br />
63<br />
69<br />
56<br />
77<br />
20<br />
0<br />
Sun Mon Tue Wed Thu Fri Sat<br />
Data from HCSO Crash Geodatabase<br />
36 t <strong>Pr<strong>of</strong>ile</strong> <strong>of</strong> <strong>Alcohol</strong> <strong>and</strong> <strong>Drug</strong> <strong>Indicators</strong> t December 2009
246<br />
247<br />
262<br />
263<br />
DUI's For The City <strong>of</strong> Tampa<br />
2007<br />
234<br />
239<br />
238<br />
244<br />
245<br />
243<br />
241<br />
242<br />
251<br />
240<br />
252<br />
253<br />
254<br />
260<br />
235<br />
237<br />
250<br />
231<br />
232<br />
236<br />
227<br />
DUI<br />
76 to 173 (4)<br />
230<br />
233<br />
225<br />
226<br />
26 to 75 (22)<br />
16 to 25 (28)<br />
222<br />
223<br />
224<br />
6 to 15 (91)<br />
0 to 5 (94)<br />
220<br />
221<br />
201<br />
1<br />
2<br />
3<br />
4<br />
5<br />
6<br />
7<br />
8<br />
9 10<br />
16 17 18<br />
11 12<br />
19 20<br />
13 14<br />
21 22<br />
23<br />
15<br />
24<br />
25<br />
26<br />
27<br />
28 29<br />
30 31<br />
32<br />
34<br />
35<br />
36<br />
37<br />
38<br />
39<br />
33<br />
41<br />
42<br />
43<br />
44<br />
45<br />
46<br />
47 40<br />
48<br />
49<br />
50<br />
51<br />
52<br />
53 54<br />
55<br />
64<br />
56<br />
57<br />
58<br />
59<br />
60<br />
61<br />
62<br />
63<br />
67<br />
76<br />
68<br />
77<br />
65<br />
78<br />
66<br />
79<br />
80<br />
81<br />
69<br />
70<br />
82<br />
71<br />
83<br />
72<br />
84<br />
73<br />
85<br />
74<br />
86<br />
75<br />
87<br />
117<br />
89<br />
90<br />
91<br />
92<br />
93<br />
94<br />
95<br />
96<br />
97<br />
98<br />
99<br />
100<br />
101<br />
88<br />
117 118<br />
149<br />
102<br />
120 112<br />
121<br />
119<br />
136<br />
150 151 152<br />
156 157 158<br />
103 104<br />
105<br />
106<br />
107<br />
108 109 110<br />
113 114 115 116<br />
127<br />
122 123 124<br />
125 126<br />
128 129 130<br />
137 138 139 140<br />
141<br />
142<br />
143<br />
153 154 155<br />
144 146<br />
159 160 161 162<br />
145<br />
111<br />
131<br />
135<br />
132<br />
134<br />
163<br />
164<br />
165<br />
166<br />
167<br />
168 169<br />
170<br />
171<br />
172<br />
147<br />
173<br />
174<br />
175<br />
133<br />
148<br />
176<br />
177<br />
178 179<br />
180<br />
181<br />
182<br />
183<br />
184<br />
185<br />
186<br />
187<br />
188<br />
189<br />
190<br />
191<br />
192<br />
193<br />
195<br />
196<br />
197<br />
198<br />
194<br />
199<br />
200<br />
<strong>Pr<strong>of</strong>ile</strong> <strong>of</strong> <strong>Alcohol</strong> <strong>and</strong> <strong>Drug</strong> <strong>Indicators</strong> t December 2009 t 37
Underage Drinking Arrests<br />
January 01, 2007 - December 31, 2007<br />
246<br />
247<br />
262<br />
263 264<br />
244<br />
245<br />
260<br />
261<br />
239<br />
241<br />
243<br />
234<br />
238<br />
240<br />
242<br />
251<br />
252<br />
253<br />
254<br />
235<br />
237<br />
250<br />
Underage Drinking Arrest<br />
231<br />
232<br />
230<br />
233<br />
236<br />
225<br />
226<br />
227<br />
District 1 - 28<br />
District 2 - 38<br />
District 3 - 165<br />
222<br />
220<br />
223<br />
224<br />
221<br />
201<br />
1<br />
2<br />
3<br />
4<br />
5<br />
6<br />
7<br />
8<br />
9 10<br />
16 17 18<br />
11<br />
12<br />
19 20<br />
13 14<br />
21<br />
22<br />
23<br />
15<br />
24<br />
25<br />
26<br />
27<br />
28 29<br />
30 31<br />
32<br />
34<br />
35<br />
36<br />
37<br />
38<br />
39<br />
33<br />
41<br />
42<br />
43<br />
44<br />
45<br />
46<br />
47 40<br />
48<br />
49<br />
50<br />
51<br />
52<br />
53 54<br />
55<br />
64<br />
56<br />
57<br />
58<br />
59<br />
60<br />
61<br />
62<br />
63<br />
67<br />
76<br />
68<br />
77<br />
65<br />
78<br />
66<br />
79<br />
80<br />
81<br />
69<br />
70<br />
82<br />
71<br />
83<br />
72 73<br />
84<br />
85<br />
74<br />
86<br />
75<br />
87<br />
117<br />
89<br />
90<br />
91<br />
92<br />
93<br />
94<br />
95<br />
96<br />
97 98<br />
99<br />
100<br />
101<br />
88<br />
117 118<br />
149<br />
102<br />
120 112<br />
121<br />
119<br />
136<br />
150 151 152<br />
156 157 158<br />
103 104 105 106 107 108 109 110<br />
113 114 115 116<br />
127 128 129 130<br />
122 123 124 125 126<br />
137 138 139 140 141 142<br />
143<br />
153 154 155<br />
144 146<br />
159 160 161 162<br />
145<br />
111<br />
131<br />
135<br />
132<br />
134<br />
163<br />
164<br />
165<br />
166<br />
167<br />
168 169<br />
170<br />
171<br />
172<br />
147<br />
173<br />
174<br />
175<br />
133<br />
148<br />
176<br />
177<br />
178 179<br />
180<br />
181<br />
182<br />
183<br />
184<br />
185<br />
186<br />
187<br />
188<br />
189<br />
190<br />
191<br />
192<br />
193<br />
198<br />
195<br />
196<br />
197<br />
194<br />
199<br />
200<br />
38 t <strong>Pr<strong>of</strong>ile</strong> <strong>of</strong> <strong>Alcohol</strong> <strong>and</strong> <strong>Drug</strong> <strong>Indicators</strong> t December 2009
For more information about TAC or the <strong>Pr<strong>of</strong>ile</strong> <strong>of</strong><br />
<strong>Alcohol</strong> <strong>and</strong> <strong>Drug</strong> <strong>Indicators</strong>, please contact:<br />
Tampa <strong>Alcohol</strong> Coalition<br />
PO Box 290383<br />
Tampa, FL 33687<br />
Ellen Snelling<br />
TAC Co-Chair<br />
813-731-2696<br />
er.snelling@verizon.net<br />
Sue Carrigan<br />
TAC Co-Chair<br />
813-334-0619<br />
suecarrigan@aol.com<br />
Genie Short, Chair <strong>of</strong> the<br />
<strong>Hillsborough</strong> <strong>County</strong> Anti <strong>Drug</strong> Alliance<br />
727-542-3537<br />
genieshort_pip@msn.com<br />
Collage (top to bottom)<br />
• <strong>Hillsborough</strong> <strong>County</strong> Sheriff’s Office BATmobile - Breath<br />
<strong>Alcohol</strong> Testing Mobile Unit.<br />
• Tampa Police Department DUI Squad<br />
• Families enjoying the Too Good for <strong>Drug</strong>s Walk <strong>and</strong> Kidfest<br />
2008 at MOSI<br />
• A winning banner with a drug free message from Carrollwood<br />
Elementary School.<br />
Back Cover Photographs (left to right)<br />
• Top <strong>Hillsborough</strong> <strong>County</strong> DUI law enforcement <strong>of</strong>ficers<br />
receiving awards from Mothers Against Drunk Driving at the<br />
annual MADD Law Enforcement Recognition Banquet<br />
• Lt. Keith Hamilton <strong>of</strong> the Tampa Office <strong>of</strong> the Division <strong>of</strong><br />
<strong>Alcohol</strong>ic Beverages <strong>and</strong> Tobacco helps at an alcohol <strong>and</strong> other<br />
drugs awareness event before prom at Wharton High School<br />
• <strong>Hillsborough</strong> <strong>County</strong> Sheriff David Gee congratulates the<br />
owners <strong>of</strong> the Dallas Bull night club for their responsible vendor<br />
practices, as part <strong>of</strong> the Sheriff’s <strong>Alcohol</strong> Vendors Enforcement<br />
(SAVE) program
40 t <strong>Pr<strong>of</strong>ile</strong> <strong>of</strong> <strong>Alcohol</strong> <strong>and</strong> <strong>Drug</strong> <strong>Indicators</strong> t December 2009