Distribution of Glass Transition Temperatures in Free-Standing ...
Distribution of Glass Transition Temperatures in Free-Standing ...
Distribution of Glass Transition Temperatures in Free-Standing ...

Create successful ePaper yourself
Turn your PDF publications into a flip-book with our unique Google optimized e-Paper software.
Macromolecules<br />
ARTICLE<br />
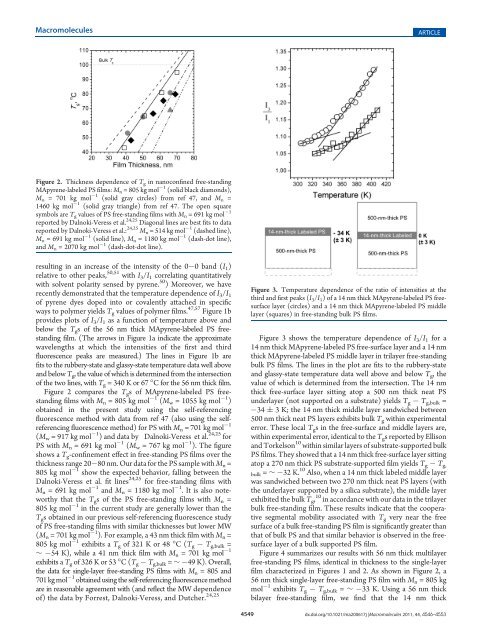
Figure 2. Thickness dependence <strong>of</strong> T g <strong>in</strong> nanoconf<strong>in</strong>ed free-stand<strong>in</strong>g<br />
MApyrene-labeled PS films: M n = 805 kg mol<br />
1 (solid black diamonds),<br />
M n = 701 kg mol<br />
1 (solid gray circles) from ref 47, and M n =<br />
1460 kg mol<br />
1 (solid gray triangle) from ref 47. The open square<br />
1<br />
symbols are T g values <strong>of</strong> PS free-stand<strong>in</strong>g films with M n = 691 kg mol<br />
reported by Dalnoki-Veress et al. 24,25 Diagonal l<strong>in</strong>es are best fits to data<br />
reported by Dalnoki-Veress et al.: 24,25 M n = 514 kg mol<br />
1 (dashed l<strong>in</strong>e),<br />
M n = 691 kg mol<br />
1 (solid l<strong>in</strong>e), M n = 1180 kg mol<br />
1 (dash-dot l<strong>in</strong>e),<br />
and M n = 2070 kg mol<br />
1 (dash-dot-dot l<strong>in</strong>e).<br />
result<strong>in</strong>g <strong>in</strong> an <strong>in</strong>crease <strong>of</strong> the <strong>in</strong>tensity <strong>of</strong> the 0 0 band (I 1 )<br />
relative to other peaks, 50,51 with I 3 /I 1 correlat<strong>in</strong>g quantitatively<br />
with solvent polarity sensed by pyrene. 50 ) Moreover, we have<br />
recently demonstrated that the temperature dependence <strong>of</strong> I 3 /I 1<br />
<strong>of</strong> pyrene dyes doped <strong>in</strong>to or covalently attached <strong>in</strong> specific<br />
ways to polymer yields T g values <strong>of</strong> polymer films. 47,57 Figure 1b<br />
provides plots <strong>of</strong> I 3 /I 1 as a function <strong>of</strong> temperature above and<br />
below the T g s <strong>of</strong> the 56 nm thick MApyrene-labeled PS freestand<strong>in</strong>g<br />
film. (The arrows <strong>in</strong> Figure 1a <strong>in</strong>dicate the approximate<br />
wavelengths at which the <strong>in</strong>tensities <strong>of</strong> the first and third<br />
fluorescence peaks are measured.) The l<strong>in</strong>es <strong>in</strong> Figure 1b are<br />
fits to the rubbery-state and glassy-state temperature data well above<br />
and below T g , the value <strong>of</strong> which is determ<strong>in</strong>ed from the <strong>in</strong>tersection<br />
<strong>of</strong> the two l<strong>in</strong>es, with T g =340Kor67°C for the 56 nm thick film.<br />
Figure 2 compares the T g s <strong>of</strong> MApyrene-labeled PS freestand<strong>in</strong>g<br />
films with M n = 805 kg mol<br />
1 (M w = 1055 kg mol<br />
1 )<br />
obta<strong>in</strong>ed <strong>in</strong> the present study us<strong>in</strong>g the self-referenc<strong>in</strong>g<br />
fluorescence method with data from ref 47 (also us<strong>in</strong>g the selfreferenc<strong>in</strong>g<br />
fluorescence method) for PS with M n = 701 kg mol<br />
1<br />
(M w = 917 kg mol<br />
1 ) and data by Dalnoki-Veress et al. 24,25 for<br />
PS with M n = 691 kg mol<br />
1 (M w = 767 kg mol<br />
1 ). The figure<br />
shows a T g -conf<strong>in</strong>ement effect <strong>in</strong> free-stand<strong>in</strong>g PS films over the<br />
thickness range 20 80 nm. Our data for the PS sample with M n =<br />
805 kg mol<br />
1 show the expected behavior, fall<strong>in</strong>g between the<br />
Dalnoki-Veress et al. fit l<strong>in</strong>es 24,25 for free-stand<strong>in</strong>g films with<br />
M n = 691 kg mol<br />
1 and M n = 1180 kg mol<br />
1 . It is also noteworthy<br />
that the T g s <strong>of</strong> the PS free-stand<strong>in</strong>g films with M n =<br />
805 kg mol<br />
1 <strong>in</strong> the current study are generally lower than the<br />
T g s obta<strong>in</strong>ed <strong>in</strong> our previous self-referenc<strong>in</strong>g fluorescence study<br />
<strong>of</strong> PS free-stand<strong>in</strong>g films with similar thicknesses but lower MW<br />
(M n = 701 kg mol<br />
1 ). For example, a 43 nm thick film with M n =<br />
805 kg mol<br />
1 exhibits a T g <strong>of</strong> 321 K or 48 °C (T g T g,bulk =<br />
1<br />
∼ 54 K), while a 41 nm thick film with M n = 701 kg mol<br />
exhibits a T g <strong>of</strong> 326 K or 53 °C(T g T g,bulk = ∼ 49 K). Overall,<br />
the data for s<strong>in</strong>gle-layer free-stand<strong>in</strong>g PS films with M n = 805 and<br />
701 kg mol<br />
1 obta<strong>in</strong>ed us<strong>in</strong>g the self-referenc<strong>in</strong>g fluorescence method<br />
are <strong>in</strong> reasonable agreement with (and reflect the MW dependence<br />
<strong>of</strong>) the data by Forrest, Dalnoki-Veress, and Dutcher. 24,25<br />
Figure 3. Temperature dependence <strong>of</strong> the ratio <strong>of</strong> <strong>in</strong>tensities at the<br />
third and first peaks (I 3 /I 1 ) <strong>of</strong> a 14 nm thick MApyrene-labeled PS freesurface<br />
layer (circles) and a 14 nm thick MApyrene-labeled PS middle<br />
layer (squares) <strong>in</strong> free-stand<strong>in</strong>g bulk PS films.<br />
Figure 3 shows the temperature dependence <strong>of</strong> I 3 /I 1 for a<br />
14 nm thick MApyrene-labeled PS free-surface layer and a 14 nm<br />
thick MApyrene-labeled PS middle layer <strong>in</strong> trilayer free-stand<strong>in</strong>g<br />
bulk PS films. The l<strong>in</strong>es <strong>in</strong> the plot are fits to the rubbery-state<br />
and glassy-state temperature data well above and below T g , the<br />
value <strong>of</strong> which is determ<strong>in</strong>ed from the <strong>in</strong>tersection. The 14 nm<br />
thick free-surface layer sitt<strong>in</strong>g atop a 500 nm thick neat PS<br />
underlayer (not supported on a substrate) yields T g T g,bulk =<br />
34 ( 3 K; the 14 nm thick middle layer sandwiched between<br />
500 nm thick neat PS layers exhibits bulk T g with<strong>in</strong> experimental<br />
error. These local T g s <strong>in</strong> the free-surface and middle layers are,<br />
with<strong>in</strong> experimental error, identical to the T g s reported by Ellison<br />
and Torkelson 10 with<strong>in</strong> similar layers <strong>of</strong> substrate-supported bulk<br />
PS films. They showed that a 14 nm thick free-surface layer sitt<strong>in</strong>g<br />
atop a 270 nm thick PS substrate-supported film yields T g T g,<br />
bulk = ∼ 32 K. 10 Also, when a 14 nm thick labeled middle layer<br />
was sandwiched between two 270 nm thick neat PS layers (with<br />
the underlayer supported by a silica substrate), the middle layer<br />
exhibited the bulk T g , 10 <strong>in</strong> accordance with our data <strong>in</strong> the trilayer<br />
bulk free-stand<strong>in</strong>g film. These results <strong>in</strong>dicate that the cooperative<br />
segmental mobility associated with T g very near the free<br />
surface <strong>of</strong> a bulk free-stand<strong>in</strong>g PS film is significantly greater than<br />
that <strong>of</strong> bulk PS and that similar behavior is observed <strong>in</strong> the freesurface<br />
layer <strong>of</strong> a bulk supported PS film.<br />
Figure 4 summarizes our results with 56 nm thick multilayer<br />
free-stand<strong>in</strong>g PS films, identical <strong>in</strong> thickness to the s<strong>in</strong>gle-layer<br />
film characterized <strong>in</strong> Figures 1 and 2. As shown <strong>in</strong> Figure 2, a<br />
56 nm thick s<strong>in</strong>gle-layer free-stand<strong>in</strong>g PS film with M n = 805 kg<br />
mol<br />
1 exhibits T g T g,bulk = ∼ 33 K. Us<strong>in</strong>g a 56 nm thick<br />
bilayer free-stand<strong>in</strong>g film, we f<strong>in</strong>d that the 14 nm thick<br />
4549 dx.doi.org/10.1021/ma200617j |Macromolecules 2011, 44, 4546–4553


![view the Dish Show [PDF] - Department of Physics - Emory University](https://img.yumpu.com/45032745/1/190x146/view-the-dish-show-pdf-department-of-physics-emory-university.jpg?quality=85)