Annual Report 2013 - Mainfreight
Annual Report 2013 - Mainfreight
Annual Report 2013 - Mainfreight

You also want an ePaper? Increase the reach of your titles
YUMPU automatically turns print PDFs into web optimized ePapers that Google loves.
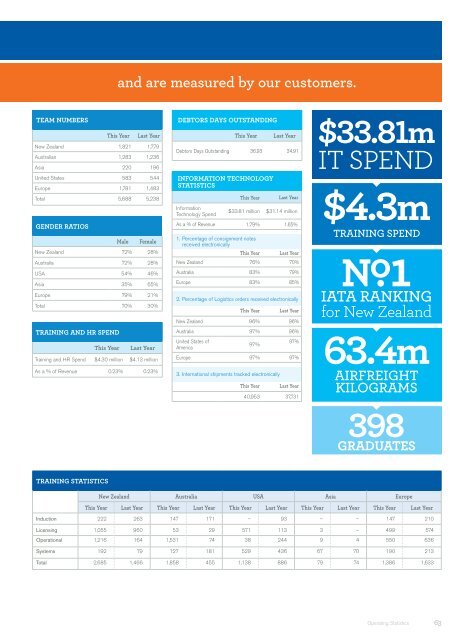
and are measured by our customers.<br />
Team Numbers<br />
This Year Last Year<br />
New Zealand 1,821 1,779<br />
Australian 1,283 1,236<br />
Asia 220 196<br />
United States 583 544<br />
Europe 1,781 1,483<br />
Total 5,688 5,238<br />
Gender ratios<br />
Male Female<br />
New Zealand 72% 28%<br />
Australia 72% 28%<br />
USA 54% 46%<br />
Asia 35% 65%<br />
Europe 79% 21%<br />
Total 70% 30%<br />
Training and HR Spend<br />
This Year Last Year<br />
Training and HR Spend $4.30 million $4.13 million<br />
As a % of Revenue 0.23% 0.23%<br />
Debtors Days Outstanding<br />
This Year<br />
Last Year<br />
Debtors Days Outstanding 36.93 34.91<br />
Information Technology<br />
Statistics<br />
Information<br />
Technology Spend<br />
This Year<br />
Last Year<br />
$33.81 million $31.14 million<br />
As a % of Revenue 1.79% 1.65%<br />
1. Percentage of consignment notes<br />
received electronically<br />
This Year Last Year<br />
New Zealand 76% 70%<br />
Australia 83% 79%<br />
Europe 83% 85%<br />
2. Percentage of Logistics orders received electronically<br />
This Year<br />
Last Year<br />
New Zealand 96% 96%<br />
Australia 97% 96%<br />
United States of<br />
America<br />
97%<br />
97%<br />
Europe 97% 97%<br />
3. International shipments tracked electronically<br />
This Year<br />
Last Year<br />
40,953 37,731<br />
$33.81m<br />
IT Spend<br />
$4.3m<br />
Training Spend<br />
No.1<br />
IATA RANKING<br />
for New Zealand<br />
63.4m<br />
Airfreight<br />
kilograms<br />
398<br />
Graduates<br />
TRAINING STATISTICS<br />
New Zealand Australia USA Asia Europe<br />
This Year Last Year This Year Last Year This Year Last Year This Year Last Year This Year Last Year<br />
Induction 222 263 147 171 – 93 – – 147 210<br />
Licensing 1,055 960 53 29 571 113 3 – 499 574<br />
Operational 1,216 164 1,531 74 38 244 9 4 550 636<br />
Systems 192 79 127 181 529 436 67 70 190 213<br />
Total 2,685 1,466 1,858 455 1,138 886 79 74 1,386 1,633<br />
Operating Statistics<br />
63