Safety of anthrax vaccine: a review by the Anthrax Vaccine Expert ...
Safety of anthrax vaccine: a review by the Anthrax Vaccine Expert ...
Safety of anthrax vaccine: a review by the Anthrax Vaccine Expert ...

You also want an ePaper? Increase the reach of your titles
YUMPU automatically turns print PDFs into web optimized ePapers that Google loves.
198 j. l. sever et al.<br />
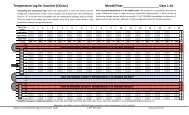
Figure 1. Temporal distribution <strong>of</strong> AVA doses administered and<br />
reports to VAERS <strong>of</strong> AEs involving AVA. The segmented line shows<br />
<strong>the</strong> number <strong>of</strong> doses <strong>of</strong> AVA administered each quarter, while each<br />
vertical bar shows <strong>the</strong> number <strong>of</strong> reports submitted to VAERS with<br />
vaccination dates corresponding to that quarter. *This quarter only<br />
includes doses given and VAERS reports with vaccination dates<br />
through 11/17/99<br />
than 40% described symptoms that might have warranted<br />
consultation with a medical specialist (Table 2).<br />
Clustering <strong>of</strong> AEs<br />
The VAERS reports were also <strong>review</strong>ed for evidence<br />
<strong>of</strong> temporal or geographic clustering. Most <strong>of</strong> <strong>the</strong><br />
reports were submitted in 1999, but some (21.6%)<br />
had been filed in 1998. Figure 1 shows <strong>by</strong> quarter<br />
for <strong>the</strong> interval from January 1998 through November<br />
1999 (1Q98–4Q99) <strong>the</strong> number <strong>of</strong> VAERS reports<br />
(based on vaccination date) and <strong>the</strong> number <strong>of</strong> doses<br />
administered. The number <strong>of</strong> doses increased each<br />
quarter through 1Q99 but <strong>the</strong>n decreased over <strong>the</strong><br />
remainder <strong>of</strong> 1999. The frequency at which AEs were<br />
reported to VAERS during this period ranged from<br />
2.1–9.0 reports/10 000 doses <strong>of</strong> <strong>vaccine</strong>. It reached a<br />
maximum <strong>of</strong> 9.0 in 3Q99, <strong>the</strong>n fell to 5.0 in 4Q99.<br />
The DMSS database showed that <strong>vaccine</strong> from 19<br />
lots <strong>of</strong> AVA was administered during <strong>the</strong> period covered<br />
<strong>by</strong> this study, with >50 000 doses derived from<br />
each <strong>of</strong> <strong>the</strong> 12 most extensively used lots. That database<br />
was also queried to identify <strong>the</strong> geographic locations<br />
at which <strong>the</strong> various lots <strong>of</strong> AVA had been used.<br />
Based on <strong>the</strong> 582 VAERS that contained information<br />
on geographic location, it was estimated that 0.04% <strong>of</strong><br />
all AVA vaccinations resulted in an AE report, but<br />
<strong>the</strong>re was wide variation among locations. The largest<br />
number <strong>of</strong> reports came from Delaware (86), followed<br />
<strong>by</strong> California (41) and Korea (39). Among locations<br />
generating five or more reports, <strong>the</strong> highest reporting<br />
rates were in Michigan (3.9% <strong>of</strong> 283 vaccinations),<br />
Oregon (4.6% <strong>of</strong> 520 vaccinations), and Delaware<br />
(1.8% <strong>of</strong> 4863 vaccinations), while it was very low<br />
in California (0.008% <strong>of</strong> 494 351 vaccinations). There<br />
was substantial geographic variation in <strong>the</strong> proportion<br />
<strong>of</strong> reports describing an AE involving hospitalization<br />
and/or LOD (e.g. 14% in Delaware, 49% in California,<br />
42% in Korea), and <strong>the</strong> actual mix <strong>of</strong> AEs reported<br />
also varied. For example, reports from Delaware cited<br />
injection-site reactions, flu-like symptoms and rash at<br />
relatively low frequencies but malaise, arthralgia, pares<strong>the</strong>sia,<br />
dizziness, tinnitus, memory loss and heart<br />
rate/rhythm abnormality at relatively high frequencies<br />
compared to reports from o<strong>the</strong>r locations.<br />
Temporal or geographic clustering <strong>of</strong> AE reports<br />
could be a result <strong>of</strong> many factors, but a question <strong>of</strong><br />
particular interest is whe<strong>the</strong>r clustering might be due<br />
to variation in reactogenicity across <strong>vaccine</strong> lots. We<br />
assessed this question <strong>by</strong> fitting conditional logistic<br />
regression models that accounted for gender, calendar<br />
time <strong>of</strong> vaccination, and geographic location. One<br />
analysis modeled <strong>the</strong> approximate odds <strong>of</strong> an immunization<br />
being reported using 465 reports that cited both<br />
a reporting location and one <strong>of</strong> <strong>the</strong> 12 most extensively<br />
utilized lots <strong>of</strong> AVA (>50 000 doses/lot). Thus,<br />
it covered 1.04 million (77.0%) <strong>of</strong> <strong>the</strong> total 1.35 million<br />
doses administered. The approximate odds <strong>of</strong><br />
reporting an AE to VAERS was found to be lowest<br />
for lot FAV038 (followed closely <strong>by</strong> lot FAV020),<br />
and greatest for lot FAV041. The odds ratio comparing<br />
lot FAV041 to lot FAV038 was 3.3, followed <strong>by</strong> 3.0<br />
and 2.7 for lot FAV044 and lot FAV030, respectively<br />
(with a median odds ratio <strong>of</strong> 1.6 among <strong>the</strong> 11 comparisons<br />
to lot FAV038).<br />
A second analysis approximated <strong>the</strong> odds <strong>of</strong> reporting<br />
an AE that involved hospitalization and/or LOD;<br />
<strong>the</strong>re were 124 such cases. The odds were greatest for<br />
lot FAV044 and least for lot FAV020, with an odds<br />
ratio comparing <strong>the</strong> two <strong>of</strong> 19.0, followed <strong>by</strong> 6.9 for<br />
lot FAV037 and 6.3 for lot FAV041 (with a median<br />
odds ratio <strong>of</strong> 2.9). Fifteen (37.5%) <strong>of</strong> <strong>the</strong> AEs associated<br />
with lot FAV044 resulted in hospitalization<br />
and/or LOD, but only <strong>the</strong> two (5.0%) that involved<br />
hospitalization were classed as SAEs. Most (80%)<br />
mentioned at least one <strong>of</strong> <strong>the</strong> following events: injection-site<br />
reaction, flu-like symptoms, dizziness,<br />
malaise, or headache. Fur<strong>the</strong>r examination <strong>of</strong> reports<br />
from Delaware focused on lot FAV030 and lot<br />
FAV041, which accounted for 53% <strong>of</strong> <strong>the</strong> doses given<br />
in and 66% <strong>of</strong> <strong>the</strong> AE reports submitted from that<br />
state. Excluding Delaware from <strong>the</strong> analysis, <strong>the</strong> odds<br />
ratio for lot FAV030 decreased slightly, with an<br />
Copyright # 2002 John Wiley & Sons, Ltd. Pharmacoepidemiology and Drug <strong>Safety</strong>, 2002; 11: 189–202