Numerical experiments on plasma focus neutron yield versus ...
Numerical experiments on plasma focus neutron yield versus ...
Numerical experiments on plasma focus neutron yield versus ...

You also want an ePaper? Increase the reach of your titles
YUMPU automatically turns print PDFs into web optimized ePapers that Google loves.
IOP PUBLISHING<br />
Plasma Phys. C<strong>on</strong>trol. Fusi<strong>on</strong> 51 (2009) 075006 (11pp)<br />
PLASMA PHYSICS AND CONTROLLED FUSION<br />
doi:10.1088/0741-3335/51/7/075006<br />
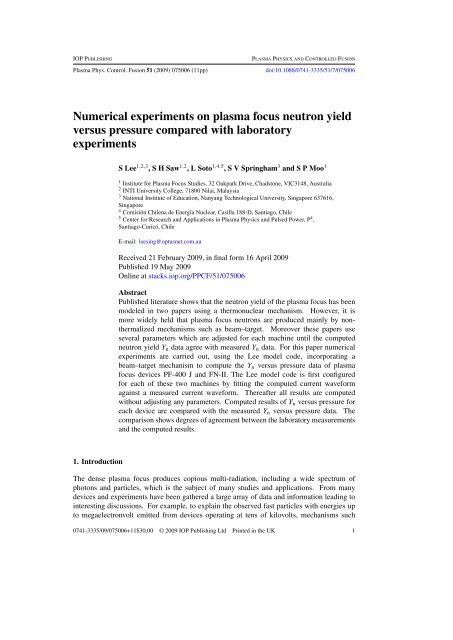
<str<strong>on</strong>g>Numerical</str<strong>on</strong>g> <str<strong>on</strong>g>experiments</str<strong>on</strong>g> <strong>on</strong> <strong>plasma</strong> <strong>focus</strong> neutr<strong>on</strong> <strong>yield</strong><br />
<strong>versus</strong> pressure compared with laboratory<br />
<str<strong>on</strong>g>experiments</str<strong>on</strong>g><br />
S Lee 1,2,3 ,SHSaw 1,2 , L Soto 1,4,5 , S V Springham 3 and S P Moo 1<br />
1 Institute for Plasma Focus Studies, 32 Oakpark Drive, Chadst<strong>on</strong>e, VIC3148, Australia<br />
2 INTI University College, 71800 Nilai, Malaysia<br />
3 Nati<strong>on</strong>al Institute of Educati<strong>on</strong>, Nanyang Technological University, Singapore 637616,<br />
Singapore<br />
4 Comisión Chilena de Energía Nuclear, Casilla 188-D, Santiago, Chile<br />
5 Center for Research and Applicati<strong>on</strong>s in Plasma Physics and Pulsed Power, P 4 ,<br />
Santiago-Curicó, Chile<br />
E-mail: leesing@optusnet.com.au<br />
Received 21 February 2009, in final form 16 April 2009<br />
Published 19 May 2009<br />
Online at stacks.iop.org/PPCF/51/075006<br />
Abstract<br />
Published literature shows that the neutr<strong>on</strong> <strong>yield</strong> of the <strong>plasma</strong> <strong>focus</strong> has been<br />
modeled in two papers using a therm<strong>on</strong>uclear mechanism. However, it is<br />
more widely held that <strong>plasma</strong> <strong>focus</strong> neutr<strong>on</strong>s are produced mainly by n<strong>on</strong>thermalized<br />
mechanisms such as beam–target. Moreover these papers use<br />
several parameters which are adjusted for each machine until the computed<br />
neutr<strong>on</strong> <strong>yield</strong> Y n data agree with measured Y n data. For this paper numerical<br />
<str<strong>on</strong>g>experiments</str<strong>on</strong>g> are carried out, using the Lee model code, incorporating a<br />
beam–target mechanism to compute the Y n <strong>versus</strong> pressure data of <strong>plasma</strong><br />
<strong>focus</strong> devices PF-400 J and FN-II. The Lee model code is first c<strong>on</strong>figured<br />
for each of these two machines by fitting the computed current waveform<br />
against a measured current waveform. Thereafter all results are computed<br />
without adjusting any parameters. Computed results of Y n <strong>versus</strong> pressure for<br />
each device are compared with the measured Y n <strong>versus</strong> pressure data. The<br />
comparis<strong>on</strong> shows degrees of agreement between the laboratory measurements<br />
and the computed results.<br />
1. Introducti<strong>on</strong><br />
The dense <strong>plasma</strong> <strong>focus</strong> produces copious multi-radiati<strong>on</strong>, including a wide spectrum of<br />
phot<strong>on</strong>s and particles, which is the subject of many studies and applicati<strong>on</strong>s. From many<br />
devices and <str<strong>on</strong>g>experiments</str<strong>on</strong>g> have been gathered a large array of data and informati<strong>on</strong> leading to<br />
interesting discussi<strong>on</strong>s. For example, to explain the observed fast particles with energies up<br />
to megaelectr<strong>on</strong>volt emitted from devices operating at tens of kilovolts, mechanisms such<br />
0741-3335/09/075006+11$30.00 © 2009 IOP Publishing Ltd Printed in the UK 1
Plasma Phys. C<strong>on</strong>trol. Fusi<strong>on</strong> 51 (2009) 075006<br />
S Lee et al<br />
as micro-instabilities, magnetohydrodynamic instabilities, accelerati<strong>on</strong> by turbulence and<br />
‘anomalous’ <strong>plasma</strong> resistance have been postulated [1, 2]. Working with these ideas enables<br />
some numbers to be estimated regarding, for example, beam particle energies.<br />
One of the most important emissi<strong>on</strong>s of the <strong>plasma</strong> <strong>focus</strong> is the fusi<strong>on</strong> neutr<strong>on</strong>s, which for<br />
a deuterium <strong>focus</strong> derive from the D–D fusi<strong>on</strong> reacti<strong>on</strong>, resulting in 2.45 MeV neutr<strong>on</strong>s. Much<br />
data have been accumulated experimentally including pulse durati<strong>on</strong> and time characteristics<br />
of emissi<strong>on</strong>, neutr<strong>on</strong> spectra and spatial anisotropy of emissi<strong>on</strong> and <strong>yield</strong>s [1]. From these<br />
data, scaling rules of neutr<strong>on</strong> <strong>yield</strong> Y n <strong>versus</strong> storage energy E 0 or discharge current, I, have<br />
been deduced. The <strong>yield</strong> Y n was found to be much higher than could be from therm<strong>on</strong>uclear<br />
reacti<strong>on</strong>s, given the measured parameters of the <strong>plasma</strong> <strong>focus</strong> pinch. Mechanisms such as<br />
moving boiler, beam–target, gyrating particles [1–5] and others such as quasi-Maxwellian hot<br />
plasmoids [6] have been invoked to explain the high measured Y n . These neutr<strong>on</strong> generating<br />
mechanisms are assumed to be c<strong>on</strong>sequential to the instabilities, etc discussed in the last<br />
paragraph. Again from such mechanisms come forth general results such as the temporal and<br />
spatial characteristics of the neutr<strong>on</strong> pulses, and representative <strong>yield</strong> numbers put forward to<br />
illustrate the validity of the assumed mechanism. There do not appear to be any published<br />
results dem<strong>on</strong>strating n<strong>on</strong>-therm<strong>on</strong>uclear modeling which may be applied to any particular<br />
machine to derive Y n in a manner where such modeled data may be compared with specific<br />
<str<strong>on</strong>g>experiments</str<strong>on</strong>g>.<br />
Given that it is widely held that the neutr<strong>on</strong> <strong>yield</strong> from the <strong>plasma</strong> <strong>focus</strong> is predominantly<br />
from n<strong>on</strong>-therm<strong>on</strong>uclear mechanisms [1–5] it is interesting that model codes have been<br />
developed using a therm<strong>on</strong>uclear mechanism that claim to have achieved agreement with<br />
laboratory measurements for Y n data [7, 8]. It may be commented that both these papers<br />
use parameters such as axial sweeping and radial sweeping efficiency factors which are<br />
adjusted until the computed Y n data agree with the measured Y n data. Moreover, the kind of<br />
temperatures needed in the computati<strong>on</strong> for the gross pinch (as distinct from hot spots), several<br />
kiloelectr<strong>on</strong>volts, is unlikely to be achieved in the actual <strong>plasma</strong> <strong>focus</strong> pinch. Specifically it<br />
may be commented that figure 16 of G<strong>on</strong>zalez et al [8] shows a computed peak radial speed<br />
of 72 cm µs −1 , which is a factor of at least 2 higher than that observed experimentally for<br />
typical neutr<strong>on</strong> optimized operati<strong>on</strong> [1, 2]. Such a speed generates, in a deuterium <strong>plasma</strong>, as<br />
can be shown from shock equati<strong>on</strong>s, a temperature of 2.1 keV, which is 4 times higher than<br />
that computed were the speed to be half the claimed value. The reflected shock raises the<br />
temperature further to 5 keV, and then follows the pinch compressi<strong>on</strong> raising the temperature<br />
still higher. In this range of temperature, a factor of 4 in temperature gives a factor ∼1000 times<br />
in the themalized D–D fusi<strong>on</strong> cross-secti<strong>on</strong> [9]. One might wish to p<strong>on</strong>der how their modeling<br />
gives such unrealistically high temperatures.<br />
Reference [8] states that in their model, the ‘kinematics’ of the current sheet follows Lee’s<br />
model, quoting [10], of 1983 vintage. A critical problem of the Lee model code, versi<strong>on</strong>s<br />
up to 1995, was that the computed speeds of the radial phase were too high by a factor of<br />
about 2. The modeling of the radial phase c<strong>on</strong>siders an imploding slug (of <strong>plasma</strong>) the fr<strong>on</strong>t<br />
of which is a shock wave and the rear of which is the magnetic pist<strong>on</strong> driving the imploding<br />
shock fr<strong>on</strong>t. In modeling such an imploding slug, there is an implicit assumpti<strong>on</strong> that the<br />
shock fr<strong>on</strong>t and the magnetic pist<strong>on</strong> are in instantaneous communicati<strong>on</strong>. It was pointed<br />
out by Potter [11] that the n<strong>on</strong>-infinite speed of small disturbances means that as the axis<br />
is approached, the communicati<strong>on</strong> delay between the fr<strong>on</strong>t and the back of the slug becomes<br />
significant. When this communicati<strong>on</strong> delay was implemented into the Lee model code [12, 13]<br />
the modeled speeds reduced by a factor of about 2 and became more realistic when compared<br />
with experimental observati<strong>on</strong>s. This critical feature, of a ‘signal-delay slug’ has since been<br />
built into every versi<strong>on</strong> of the Lee model code [12, 13].<br />
2
Plasma Phys. C<strong>on</strong>trol. Fusi<strong>on</strong> 51 (2009) 075006<br />
S Lee et al<br />
The imploding radial layer modeled by [8] does not have this vital ’signal-delay’<br />
mechanism, and thus ends up computing unrealistic high speeds (factor of 2 too high), which<br />
would lead to equally unrealistic high temperatures (factor of 4 too high; hence a factor of<br />
∼1000 times too high in therm<strong>on</strong>uclear fusi<strong>on</strong> cross-secti<strong>on</strong>) in their modeling of the pinch<br />
compressi<strong>on</strong> phase. Without this unrealistically modeled high speeds it is doubtful that even<br />
the most extreme adjustments of the sweeping factors would enable agreement of the computed<br />
therm<strong>on</strong>uclear Y n with the measured Y n .<br />
Recently, the Lee model code was equipped with a beam–target mechanism which<br />
computes the Y n for a wide range of <strong>plasma</strong> <strong>focus</strong> machines ranging from the sub-kilojoule<br />
PF-400 J to the megajoule PF1000. The computed <strong>yield</strong>s are typically within a factor of 2<br />
compared with the measured Y n [14, 15]. <str<strong>on</strong>g>Numerical</str<strong>on</strong>g> <str<strong>on</strong>g>experiments</str<strong>on</strong>g> using this code over a wide<br />
range of <strong>plasma</strong> <strong>focus</strong> machines and energies have derived scaling rules of Y n .<br />
In this paper we show that the Lee model code is not <strong>on</strong>ly able to compute Y n for various<br />
machines but that it is able to compute data such as Y n <strong>versus</strong> P 0 . We choose two specific<br />
machines the PF-400 J [16] and FN-II [17] (Fuego Nuevo II) which have well-documented<br />
published data <strong>on</strong> Y n <strong>versus</strong> P 0 as well as sufficient published machine parameters and measured<br />
current traces, so that numerical <str<strong>on</strong>g>experiments</str<strong>on</strong>g> may be carried out with the Lee model code. The<br />
computed Y n <strong>versus</strong> P 0 curve in each case is compared with the published measured Y n <strong>versus</strong><br />
P 0 data.<br />
The Lee model couples the electrical circuit with <strong>plasma</strong> <strong>focus</strong> dynamics, thermodynamics<br />
and radiati<strong>on</strong>, enabling realistic simulati<strong>on</strong> of all gross <strong>focus</strong> properties. The basic model,<br />
described in 1984 [10], was successfully used to assist several <str<strong>on</strong>g>experiments</str<strong>on</strong>g> [18–21]. Radiati<strong>on</strong>coupled<br />
dynamics was included in the five-phase code leading to numerical <str<strong>on</strong>g>experiments</str<strong>on</strong>g> <strong>on</strong><br />
radiati<strong>on</strong> cooling [22]. The signal-delay slug, so crucial to radial simulati<strong>on</strong>, was incorporated<br />
together with real gas thermodynamics and radiati<strong>on</strong>-<strong>yield</strong> terms and assisted other research<br />
projects [23, 25, 26] and was web-published in 2000 [12] and 2005 [13]. All subsequent<br />
versi<strong>on</strong>s of the Lee model code incorporate the ’signal-delay slug’ as a must-have feature.<br />
Plasma self-absorpti<strong>on</strong> was included in 2007 [12], improving soft x-ray <strong>yield</strong> simulati<strong>on</strong>. The<br />
code has been used extensively in several machines including UNU/ICTP PFF [18, 21–24],<br />
NX2 [25, 26] NX1 [25], and adapted for the Filippov-type <strong>plasma</strong> <strong>focus</strong> DENA [27]. A<br />
recent development is the inclusi<strong>on</strong> of neutr<strong>on</strong> <strong>yield</strong>, Y n , using a beam–target mechanism [3],<br />
incorporated in the present versi<strong>on</strong> [28] of the code RADPFV5.13.b (and later versi<strong>on</strong>s),<br />
resulting in realistic Y n scaling with I pinch [14, 15]. The versatility and utility of the Lee model<br />
is dem<strong>on</strong>strated in its clear distincti<strong>on</strong> of I pinch from I peak [29] and the recent uncovering of a<br />
<strong>plasma</strong> <strong>focus</strong> pinch current limitati<strong>on</strong> effect [30, 31]. The descripti<strong>on</strong>, theory, and up-to-date<br />
code and a broad range of results of this ‘Universal Plasma Focus Laboratory Facility’ are<br />
available for download [28].<br />
The neutr<strong>on</strong> <strong>yield</strong> is computed using a phenomenological beam–target neutr<strong>on</strong> generating<br />
mechanism described recently by Gribkov et al [3] and adapted to <strong>yield</strong> the following equati<strong>on</strong>.<br />
A beam of fast deuter<strong>on</strong> i<strong>on</strong>s is produced by diode acti<strong>on</strong> in a thin layer close to the anode,<br />
with <strong>plasma</strong> disrupti<strong>on</strong>s generating the necessary high voltages. The beam interacts with the<br />
hot dense <strong>plasma</strong> of the <strong>focus</strong> pinch column to produce the fusi<strong>on</strong> neutr<strong>on</strong>s. The beam–target<br />
<strong>yield</strong> is derived [14, 15, 28, 31]as<br />
Y b−t = C n n i I 2 pinch z2 p (ln(b/r p))σ/U 0.5 ,<br />
where n i is the i<strong>on</strong> density, b is the cathode radius, r p is the radius of the <strong>plasma</strong> pinch with<br />
length z p , σ the cross-secti<strong>on</strong> of the D–D fusi<strong>on</strong> reacti<strong>on</strong>, n-branch [9] and U, the beam<br />
energy. C n is treated as a calibrati<strong>on</strong> c<strong>on</strong>stant combining various c<strong>on</strong>stants in the derivati<strong>on</strong><br />
process.<br />
3
Plasma Phys. C<strong>on</strong>trol. Fusi<strong>on</strong> 51 (2009) 075006<br />
S Lee et al<br />
The D–D cross-secti<strong>on</strong> is sensitive to the beam energy in the range 15–150 kV; so it is<br />
necessary to use the appropriate range of beam energy to compute σ . The code computes<br />
induced voltages (due to current moti<strong>on</strong> inductive effects) V max of the order of <strong>on</strong>ly 15–50 kV.<br />
However it is known, from <str<strong>on</strong>g>experiments</str<strong>on</strong>g> that the i<strong>on</strong> energy resp<strong>on</strong>sible for the beam–target<br />
neutr<strong>on</strong>s is in the range 50–150 keV [3], and for smaller lower voltage machines the relevant<br />
energy could be lower at 30–60 keV [5]. Thus in line with the experimental observati<strong>on</strong>s the<br />
D–D cross secti<strong>on</strong> σ is reas<strong>on</strong>ably obtained by using U = 3V max . This fit was tested by using<br />
U equal to various multiples of V max . A reas<strong>on</strong>ably good fit of the computed neutr<strong>on</strong> <strong>yield</strong>s to<br />
the measured published neutr<strong>on</strong> <strong>yield</strong>s at energy levels from sub-kilojoule to near megajoule<br />
was obtained when the multiple of 3 was used; with poor agreement for most of the data<br />
points when, for example, a multiple of 1 or 2 or 4 or 5 was used. The model uses a value of<br />
C n = 2.7 × 10 7 obtained by calibrating the <strong>yield</strong> [28, 31] at an experimental point of 0.5 MA.<br />
The therm<strong>on</strong>uclear comp<strong>on</strong>ent is also computed in every case and it is found that this<br />
comp<strong>on</strong>ent is negligible when compared with the beam–target comp<strong>on</strong>ent.<br />
2. Procedures for the numerical <str<strong>on</strong>g>experiments</str<strong>on</strong>g><br />
The Lee model code is c<strong>on</strong>figured to work as any <strong>plasma</strong> <strong>focus</strong> by inputting the bank parameters,<br />
L 0 , C 0 and stray circuit resistance r 0 ; the tube parameters b, a and z 0 and operati<strong>on</strong>al<br />
parameters V 0 and P 0 and the fill gas. The standard practice is to fit the computed total<br />
current waveform to an experimentally measured total current waveform [12–15, 28–31] using<br />
four model parameters representing the mass swept-up factor f m , the <strong>plasma</strong> current factor f c<br />
for the axial phase and factors f mr and f cr for the radial phases. The mass swept-up factor f m<br />
accounts for not <strong>on</strong>ly the porosity of the current sheet but also for the inclinati<strong>on</strong> of the moving<br />
current sheet–shock fr<strong>on</strong>t structure, c<strong>on</strong>tact layers and all other unspecified mechanisms which<br />
have effects equivalent to increasing or reducing the amount of mass in the moving structure,<br />
during the axial phase. The current factor f c accounts for the fracti<strong>on</strong> of current effectively<br />
flowing in the moving structure (due to all effects such as current shedding at or near the backwall<br />
and current sheet inclinati<strong>on</strong>). This defines the fracti<strong>on</strong> of current effectively driving the<br />
structure, during the axial phase. Likewise the radial phase mass swept-up and current factors<br />
f mr and f cr are incorporated in all three radial phases. The mass swept-up factor f mr accounts<br />
for all mechanisms which have effects equivalent to increasing or reducing the amount of mass<br />
in the moving slug, during the radial phase, not the least of which could be the ejecti<strong>on</strong> of mass<br />
in the axial directi<strong>on</strong>. The current factor f cr accounts for the fracti<strong>on</strong> of current effectively<br />
flowing in the moving pist<strong>on</strong> forming the back of the slug (due to all effects). This defines<br />
the fracti<strong>on</strong> of current effectively driving the radial slug. The pinch current I pinch is therefore<br />
obtained by multiplying the total (circuit) current at the time of pinch by f cr .<br />
From experience it is known that the current trace of the <strong>focus</strong> is <strong>on</strong>e of the best indicators<br />
of gross performance. The axial and radial phase dynamics and the crucial energy transfer into<br />
the <strong>focus</strong> pinch are am<strong>on</strong>g the important informati<strong>on</strong> that is quickly apparent from the current<br />
trace.<br />
The exact time profile of the total current trace is governed by the bank parameters, by the<br />
<strong>focus</strong> tube geometry and the operati<strong>on</strong>al parameters. It also depends <strong>on</strong> the fracti<strong>on</strong> of mass<br />
swept-up and the fracti<strong>on</strong> of sheath current and the variati<strong>on</strong> of these fracti<strong>on</strong>s through the<br />
axial and radial phases. These parameters determine the axial and radial dynamics, specifically<br />
the axial and radial speeds which in turn affect the profile and magnitudes of the discharge<br />
current. The detailed profile of the discharge current during the pinch phase also reflects the<br />
Joule heating and radiative <strong>yield</strong>s. At the end of the pinch phase the total current profile also<br />
reflects the sudden transiti<strong>on</strong> of the current flow from a c<strong>on</strong>stricted pinch to a large column<br />
4
Plasma Phys. C<strong>on</strong>trol. Fusi<strong>on</strong> 51 (2009) 075006<br />
S Lee et al<br />
flow. Thus the discharge current powers all dynamic, electrodynamic, thermodynamic and<br />
radiati<strong>on</strong> processes in the various phases of the <strong>plasma</strong> <strong>focus</strong>. C<strong>on</strong>versely all the dynamic,<br />
electrodynamic, thermodynamic and radiati<strong>on</strong> processes in the various phases of the <strong>plasma</strong><br />
<strong>focus</strong> affect the discharge current. It is then no exaggerati<strong>on</strong> to say that the discharge current<br />
waveform c<strong>on</strong>tains informati<strong>on</strong> <strong>on</strong> all the dynamic, electrodynamic, thermodynamic and<br />
radiati<strong>on</strong> processes that occur in the various phases of the <strong>plasma</strong> <strong>focus</strong>. This explains the<br />
importance attached to matching the computed current trace to the measured current trace in<br />
the procedure adopted by the Lee model code.<br />
Once the current matching is d<strong>on</strong>e, and the model parameters are fixed, with adjustments<br />
to L 0 , C 0 , r 0 and z 0 as required by the current matching, all these parameters are fixed and no<br />
further adjustment is made to any of the bank, tube and model parameters.<br />
It is observed in laboratory measurements that towards the end of the <strong>focus</strong> pinch<br />
phase <strong>plasma</strong>/current disrupti<strong>on</strong>s occur resulting in localized regi<strong>on</strong>s of high densities and<br />
temperatures. These localized regi<strong>on</strong>s are not modeled in the code, which c<strong>on</strong>sequently<br />
computes <strong>on</strong>ly an average uniform density and an average uniform temperature which are<br />
c<strong>on</strong>siderably lower than measured peak density and temperature. However, because the four<br />
model parameters are obtained by fitting the computed total current waveform to the measured<br />
total current waveform, the model incorporates the energy and mass balances equivalent,<br />
at least in the gross sense, to all the processes which are not even specifically modeled.<br />
Hence, computed gross features such as speeds and trajectories and integrated soft x-ray<br />
<strong>yield</strong>s have been extensively tested in numerical <str<strong>on</strong>g>experiments</str<strong>on</strong>g> <strong>on</strong> several machines, and found<br />
to be comparable with the measured values. Although these current/<strong>plasma</strong> disrupti<strong>on</strong>s are not<br />
specifically modeled, as explained earlier, our beam–target mechanism for neutr<strong>on</strong> producti<strong>on</strong><br />
is based <strong>on</strong> such disrupti<strong>on</strong>s.<br />
3. PF-400 J—the numerical <str<strong>on</strong>g>experiments</str<strong>on</strong>g><br />
3.1. Fitting the computed current trace to obtain the model parameters<br />
Silva et al had published a paper [16] with laboratory measurements from the PF-400 J,<br />
including a typical current waveform at 6.6 Torr deuterium, and a graph of neutr<strong>on</strong> <strong>yield</strong> <strong>versus</strong><br />
pressure. We first fit the computed current waveform to the published measured waveform [16]<br />
in the following manner.<br />
We c<strong>on</strong>figure the Lee model code (versi<strong>on</strong> RADPF05.13.9b) to operate as the PF-400 J,<br />
starting with the following published [16] bank and tube parameters:<br />
Bank parameters: L 0 = 38 nH, C 0 = 0.88 µF, r 0 = not given<br />
Tube parameters: b = 1.55 cm, a = 0.6cm,z 0 = 2.8cm<br />
Operating parameters: V 0 = 28 kV, P 0 = 6.6 Torr deuterium,<br />
where L 0 is the static inductance (nominal), C 0 the storage capacitance (nominal), b the tube<br />
outer radius, a the inner radius, z 0 the anode length, V 0 the operating voltage and P 0 the<br />
operating initial pressure.<br />
The computed total discharge current waveform is fitted to the measured by varying<br />
model parameters f m , f c , f mr and f cr <strong>on</strong>e by <strong>on</strong>e until the computed waveform agrees with<br />
the measured waveform. First, the axial model factors f m , f c are adjusted (fitted) until the<br />
computed rising slope of the total current trace and the rounding off of the peak current as<br />
well as the peak current itself are in reas<strong>on</strong>able (typically good) fit with the measured total<br />
current trace. Then we proceed to adjust (fit) the radial phase model factors f mr and f cr until<br />
the computed slope and depth of the dip agree with the measured. This procedure is quite<br />
5
Plasma Phys. C<strong>on</strong>trol. Fusi<strong>on</strong> 51 (2009) 075006<br />
S Lee et al<br />
Figure 1. PF-400 J: computed discharge current compared with the published measured<br />
current [16].<br />
sensitive and robust in that if any bank parameter such as L 0 or C 0 is not correctly given,<br />
no good fit is obtainable (i.e. the computed total current trace will not be matchable with the<br />
measured waveform no matter how the four model parameters are varied).<br />
In the case of PF-400 J, to obtain a reas<strong>on</strong>ably good fit of the computed current waveform<br />
with the measured current waveform, the following bank and tube parameters (L 0 , C 0 and z 0<br />
refitted and r 0 fitted) have to be used:<br />
Bank parameters: L 0 = 40 nH, C 0 = 0.95 µF, r 0 = 10 m<br />
Tube parameters: b = 1.55 cm, a = 0.6cm,z 0 = 1.7cm<br />
Operating parameters: V 0 = 28 kV, P 0 = 6.6 Torr deuterium<br />
together with the following fitted model parameters:<br />
f m = 0.08, f c = 0.7, f mr = 0.11 and f cr = 0.7.<br />
The fitted computed current waveform is compared with the published waveform in figure 1,<br />
showing good agreement, the two traces practically inseparable.<br />
3.2. Computing the neutr<strong>on</strong> <strong>yield</strong> as a functi<strong>on</strong> of operating pressure<br />
The code is c<strong>on</strong>figured to operate as the PF-400 J using the bank and tube parameters last<br />
menti<strong>on</strong>ed above and using the fitted model parameters. <str<strong>on</strong>g>Numerical</str<strong>on</strong>g> <str<strong>on</strong>g>experiments</str<strong>on</strong>g> are then<br />
carried out at an operating voltage of 28 kV and at various initial pressures in deuterium. The<br />
neutr<strong>on</strong> <strong>yield</strong>s Y n are then tabulated in Table 1 together with some of the computed properties<br />
of the <strong>focus</strong> pinch. The computed Y n <strong>versus</strong> P 0 curve is compared with the published data [16]<br />
in figure 2.<br />
Figure 2 shows that the computed neutr<strong>on</strong> <strong>yield</strong> <strong>versus</strong> pressure curve agrees reas<strong>on</strong>ably<br />
with the published curve. The main features for comparis<strong>on</strong> include the peak Y n (computed<br />
value of 1.16 × 10 6 against a measured value of 1.06 × 10 6 neutr<strong>on</strong>s per shot); optimum P 0<br />
(computed value of 6–7 mb against the measured value of 9 mb) and the drop-off of Y n <strong>on</strong> both<br />
sides of the optimum, although the computed drop-offs are more gradual than the measured.<br />
4. FN-II—the numerical <str<strong>on</strong>g>experiments</str<strong>on</strong>g><br />
4.1. Fitting the computed current trace to obtain the model parameters<br />
Castillo et al published a paper [17] with laboratory measurements from the FN-II including<br />
a typical current derivative waveform and data <strong>on</strong> neutr<strong>on</strong> <strong>yield</strong> flux (end-<strong>on</strong> and side-<strong>on</strong>)<br />
6
Plasma Phys. C<strong>on</strong>trol. Fusi<strong>on</strong> 51 (2009) 075006<br />
S Lee et al<br />
Table 1. PF-400 J: computed Y n as a functi<strong>on</strong> of pressure, together with some computed pinch<br />
properties. I peak is the peak value of the total current, I pinch the <strong>plasma</strong> pinch current at start of<br />
pinch, T pinch the pinch temperature, v a the axial speed, v s , v p the radial shock and pist<strong>on</strong> speeds,<br />
r min the minimum radius of <strong>focus</strong>, z max the maximum length of pinch column, ’pinch dur’ the pinch<br />
durati<strong>on</strong>, V max the maximum induced voltage and n i the i<strong>on</strong> number density.<br />
Min Max Peak Peak Peak Pinch<br />
P 0 Y n I peak I pinch T pinch T pinch v a v s v p r min z max dur V max n i<br />
(mb) (10 6 neutr<strong>on</strong>s) (kA) (kA) (10 6 ) (10 6 ) (cm µs −1 ) (cm µs −1 ) (cm µs −1 ) (cm) (cm) (ns) (kV) (10 23 m −3 )<br />
15.0 0.27 127 70 2.5 2.7 7.0 23.5 16.0 0.09 0.8 8.0 9.3 6.18<br />
14.0 0.38 127 73 2.9 3.1 7.3 24.8 16.9 0.09 0.8 7.5 10.3 5.95<br />
13.0 0.50 127 75 3.3 3.5 7.5 26.3 17.8 0.09 0.8 7.0 11.4 5.70<br />
12.0 0.64 127 77 3.8 4.0 7.8 27.9 18.8 0.09 0.8 6.6 12.5 5.40<br />
11.0 0.77 126 78 4.3 4.5 8.1 29.6 19.9 0.09 0.8 6.1 13.7 5.06<br />
10.0 0.90 126 80 5.0 5.2 8.5 31.5 21.1 0.09 0.8 5.7 15.0 4.69<br />
9.0 1.02 126 81 5.7 5.9 8.9 33.5 22.5 0.09 0.8 5.4 16.3 4.30<br />
8.7 1.05 126 81 6.0 6.2 9.0 34.3 22.9 0.09 0.8 5.2 16.8 4.17<br />
8.0 1.11 126 82 6.6 6.8 9.3 35.8 24.0 0.09 0.8 5.0 17.8 3.88<br />
7.0 1.16 125 83 7.7 7.9 9.8 38.5 25.7 0.08 0.8 4.6 19.3 3.45<br />
6.0 1.16 124 83 9.1 9.3 10.4 41.5 27.8 0.08 0.8 4.3 21.0 2.99<br />
5.0 1.11 123 83 10.8 11.1 11.1 45.2 30.2 0.08 0.8 3.9 22.9 2.52<br />
4.0 1.00 121 82 13.2 13.6 12.0 49.7 33.3 0.08 0.8 3.5 25.1 2.05<br />
3.0 0.81 117 80 16.8 17.2 13.3 55.8 37.3 0.08 0.8 3.1 27.6 1.55<br />
2.0 0.55 111 76 22.9 23.3 15.1 64.8 43.3 0.08 0.8 2.7 30.5 1.05<br />
1.0 0.25 99 68 36.7 37.2 18.6 81.6 54.5 0.08 0.8 2.1 34.6 0.53<br />
Figure 2. PF-400 J: computed (crosses) compared with the measured [16] (diam<strong>on</strong>ds with error<br />
bars) Y n as functi<strong>on</strong>s of P 0 . Vertical scale is in units of 10 6 neutr<strong>on</strong>s per shot.<br />
together with emissi<strong>on</strong> anisotropy data from which can be deduced the Y n <strong>versus</strong> P 0 curve.<br />
We first digitize the measured current derivative waveform [17] using an open access source<br />
digitizing program, Engauge [32] and then integrate the data with time to obtain the current<br />
waveform. Then we fit the computed current waveform to the published measured waveform<br />
as follows:<br />
We c<strong>on</strong>figure the Lee model code to operate as the FN-II (electrode II) starting with the<br />
following published [17] bank and tube parameters:<br />
Bank parameters: L 0 = 54 nH, C 0 = 7.45 µF, r 0 = not given<br />
Tube parameters: b = 5cm,a = 2.5cm,z 0 = 3cm<br />
7
Plasma Phys. C<strong>on</strong>trol. Fusi<strong>on</strong> 51 (2009) 075006<br />
S Lee et al<br />
Figure 3. FN-II: computed discharge current compared with the published measured current [17]<br />
(derived) for FN-II. The measured discharge current is integrated to just bey<strong>on</strong>d the bottom of the<br />
current dip, up to <strong>on</strong>ly 1.4 µs.<br />
Operating parameters: V 0 = 36 kV, P 0 = 2.75 Torr deuterium.<br />
To obtain a reas<strong>on</strong>ably good fit the following bank and tube parameters (L 0 , C 0 and z 0 refitted<br />
and r 0 fitted) are used:<br />
Bank parameters: L 0 = 75 nH, C 0 = 7.45 µF, r 0 = 10 m<br />
Tube parameters: b = 5cm,a = 2.5cm,z 0 = 4cm<br />
Operating parameters: V 0 = 36 kV, P 0 = 2.75 Torr deuterium<br />
together with the following fitted model parameters:<br />
f m = 0.12, f c = 0.7, f mr = 0.13 and f cr = 0.7.<br />
It can be seen that the computed discharge current waveform agrees well with the published<br />
measured current waveform up to and slightly bey<strong>on</strong>d the bottom of the current dip (figure 3).<br />
This means that the agreement covers all the regi<strong>on</strong>s of interest from axial to radial phases up<br />
to the end of the pinch phase; all five <strong>plasma</strong> <strong>focus</strong> phases of interest to us.<br />
4.2. Computing the neutr<strong>on</strong> <strong>yield</strong> as a functi<strong>on</strong> of operating pressure<br />
Using the fitted model parameters, numerical <str<strong>on</strong>g>experiments</str<strong>on</strong>g> are then carried out at various initial<br />
pressures in deuterium. The neutr<strong>on</strong> <strong>yield</strong>s Y n are then tabulated in table 2 and compared with<br />
the published measured values [17] in figure 4. The values of Y n in table 2 are derived from<br />
the measured side-<strong>on</strong> differential <strong>yield</strong> per solid angle by multiplying each value by 4π and<br />
1.11 as suggested by the discussi<strong>on</strong> of anisotropy in [17]. Using this method the optimum Y n<br />
at 2.75 Torr attains a value of 2.2 × 10 8 instead of the value of 1.66 × 10 8 quoted by Castillo<br />
et al [17]. It appears that this difference is due to the different readings of the Ag counters<br />
in their two sets of measurements. To simplify matters we are actually presenting the results<br />
without taking into account this difference. That is, we are using a peak value of 2.2 × 10 8<br />
(using the multiplying factor suggested by the paper) instead of the peak value of 1.66 × 10 8<br />
which is quoted as the peak value of Y n . This gives us a less degree of agreement than if we had<br />
adjusted the Y n values so that the peak were 1.66 × 10 8 . This way we are more c<strong>on</strong>servative<br />
in claiming the degree of agreement.<br />
Figure 4 shows that the computed neutr<strong>on</strong> <strong>yield</strong> <strong>versus</strong> pressure curve agrees reas<strong>on</strong>ably<br />
with the published curve. Features of comparis<strong>on</strong> include peak Y n (computed value of<br />
1.35 × 10 8 compared with the measured of 2.2 × 10 8 which agrees to better than factor<br />
of 2), optimum P 0 (computed value of 4 Torr compared with the measured value of 2.75 Torr)<br />
8
Plasma Phys. C<strong>on</strong>trol. Fusi<strong>on</strong> 51 (2009) 075006<br />
S Lee et al<br />
Table 2. FN-II: Computed Yn as a functi<strong>on</strong> of pressure, together with some computed pinch<br />
properties. I peak is the peak value of the total current, I pinch the <strong>plasma</strong> pinch current at start of<br />
pinch, T pinch the pinch temperature, v a the axial speed, v s , v p the radial shock and pist<strong>on</strong> speeds,<br />
r min the minimum radius of <strong>focus</strong>, z max the maximum length of pinch column, ‘Pinch dur’ the<br />
pinch durati<strong>on</strong>, V max the maximum induced voltage and n i the i<strong>on</strong> number density.<br />
Min Max Peak Peak Peak pinch<br />
P 0 Y n I peak I pinch T pinch T pinch v a v s v p r min z max dur V max n i<br />
(Torr) (10 8 ) (kA) (kA) (10 6 ) (10 6 ) (cm µs −1 ) (cm µs −1 ) (cm µs −1 ) (cm) (cm) (ns) (kV) (10 23 m −3 )<br />
8.0 0.47 322 168 0.91 1.06 4.9 15.6 10.5 0.44 3.6 54.5 14.1 4.0<br />
6.0 1.01 320 187 1.59 1.75 5.5 19.2 12.9 0.40 3.6 41.8 19.8 3.6<br />
5.0 1.24 319 194 2.09 2.26 6.0 21.5 14.4 0.39 3.6 36.8 23.2 3.2<br />
4.0 1.35 316 198 2.77 2.95 6.5 24.2 16.2 0.38 3.6 32.0 27.1 2.7<br />
3.0 1.28 311 200 3.78 4.00 7.2 27.8 18.6 0.37 3.6 27.5 31.6 2.1<br />
2.8 1.24 309 199 4.05 4.27 7.4 28.7 19.2 0.37 3.6 26.6 32.6 2.0<br />
2.0 0.99 299 196 5.51 5.76 8.3 33.1 22.1 0.36 3.6 22.9 37.1 1.5<br />
1.0 0.50 272 181 9.49 9.83 10.3 42.8 28.5 0.36 3.6 17.5 44.7 0.8<br />
Figure 4. FN-II: computed compared with the measured [17] Y n as functi<strong>on</strong>s of pressure. Vertical<br />
scale is in units of 10 8 neutr<strong>on</strong>s per shot.<br />
and the drop-off of Y n <strong>on</strong> both sides of the optimum P 0 , although the drop-off is more gradual<br />
for the computed curve than that for the measured curve.<br />
The agreement between computed Y n <strong>versus</strong> P 0 data and measured Y n <strong>versus</strong> P 0 for each<br />
machine is even more remarkable when we note that model parameters are fitted by comparis<strong>on</strong><br />
of current traces; after fitting no more adjustments are d<strong>on</strong>e to any parameters. The same model<br />
code also shows reas<strong>on</strong>able agreement in neutr<strong>on</strong> <strong>yield</strong> when compared with the published<br />
results of the PF1000 [3]; and it may be worthwhile to note that the PF-400 J is a small <strong>plasma</strong><br />
<strong>focus</strong> of 400 J, the FN-II is 10 times bigger in storage energy, whilst the PF1000 is <strong>on</strong>e of<br />
the biggest <strong>plasma</strong> <strong>focus</strong> in the world at 1 MJ. Thus the code computes realistic Y n across<br />
practically the whole range of existing <strong>plasma</strong> <strong>focus</strong> devices.<br />
Despite all the discussi<strong>on</strong>s in the literature [1, 2] about neutr<strong>on</strong> producti<strong>on</strong> mechanisms<br />
such as beam–target, gyrating i<strong>on</strong>s, moving boiler and others, the state of the art is not able<br />
to do better than make order of magnitude estimates, except in the case of therm<strong>on</strong>uclear<br />
models [7, 8], and those cases require parameters specifically adjusted to make the computed<br />
Y n agree with the measured Y n . On the other hand, our figures 2 and 4 are modeled with a more<br />
9
Plasma Phys. C<strong>on</strong>trol. Fusi<strong>on</strong> 51 (2009) 075006<br />
S Lee et al<br />
acceptable beam–target mechanism using a more realistic code without adjusting parameters<br />
to fit the neutr<strong>on</strong> <strong>yield</strong> to any specific machine.<br />
5. C<strong>on</strong>clusi<strong>on</strong><br />
The Lee model code is used to compute the neutr<strong>on</strong> <strong>yield</strong> <strong>versus</strong> pressure curve of the<br />
Chilean PF-400 J and the Mexican FN-II. The computed results agree reas<strong>on</strong>ably well with<br />
the published curves and give c<strong>on</strong>fidence that the Lee model code computes not just optimum<br />
neutr<strong>on</strong> <strong>yield</strong>s but also the behavior of neutr<strong>on</strong> <strong>yield</strong> with pressure for specific <strong>plasma</strong> <strong>focus</strong><br />
machines. The results indicate that this code, now incorporated with a beam–target mechanism,<br />
gives realistic <strong>plasma</strong> dynamics and <strong>focus</strong> properties together with a realistic neutr<strong>on</strong> <strong>yield</strong>,<br />
applicable to a wide range of <strong>plasma</strong> <strong>focus</strong> devices, without the need of any adjustable<br />
parameters, needing <strong>on</strong>ly to fit the computed current trace to a measured current trace.<br />
We may also remark that to do a better evaluati<strong>on</strong> of any model for the mechanism of<br />
neutr<strong>on</strong> producti<strong>on</strong> in <strong>plasma</strong> <strong>focus</strong> devices, it is necessary to use experimental diagnostics<br />
with high spatial and temporal resoluti<strong>on</strong>. Temporal and spatial resoluti<strong>on</strong> close to the pinch<br />
moment are crucial to describe properly the <strong>plasma</strong> heating. For example, to study radial<br />
velocities higher than 20 cm µs −1 (200 µmns −1 ) with optical refractive diagnostics requires<br />
shuttering pulses shorter than 100 ps; to obtain the necessary spatial resoluti<strong>on</strong> of 20µm for the<br />
imploding <strong>on</strong>-axis shock fr<strong>on</strong>t. Visible streak camera of sufficient time and space resoluti<strong>on</strong><br />
could also be used to assess the radial velocity and the durati<strong>on</strong> of the pinch. Experimental<br />
measurements of the i<strong>on</strong> density and temperature with temporal resoluti<strong>on</strong> of the order of<br />
nanosec<strong>on</strong>ds are also required for devices in the range of sub-kilojoule to a few kilojoules.<br />
Acknowledgment<br />
L Soto is supported by the Chile Bicentennial Program in Science and Technology grant ACT<br />
26, Center of Research and Applicati<strong>on</strong>s in Plasma Physics and Pulsed Power Technology<br />
(P 4 -Project).<br />
References<br />
[1] Bernard A, Bruzz<strong>on</strong>e H, Choi P, Chuaqui H, Gribkov V, Herrera J, Hirano K, Krejci A, Lee S and Luo C 1998<br />
J. Moscow Phys. Soc. 8 93–170<br />
[2] Soto L 2005 Plasma Phys. C<strong>on</strong>trol. Fusi<strong>on</strong> 47 A361<br />
[3] Gribkov V A et al 2007 J. Phys. D: Appl. Phys. 40 3592<br />
[4] Moo S P, Chakrabarty C K and Lee S 1991 IEEE Trans. Plasma Sci. 19 515<br />
[5] Springham S V, Lee S and Rafique M S 2000 Plasma Phys. C<strong>on</strong>trol. Fusi<strong>on</strong> 42 1023<br />
[6] Lerner E 2004 arXiv:physics/0401126<br />
[7] Moreno C, Bruzz<strong>on</strong>e H, Martínez J and Clausse A 2000 IEEE Trans. Plasma Sci. 28 1735<br />
[8] G<strong>on</strong>zález J H, Clausse A, Bruzz<strong>on</strong>e H and Florido P C 2004 IEEE Trans. Plasma Sci. 32 1383<br />
[9] Huba J D 2006 Plasma Formulary p44http://wwwppd.nrl.navy.mil/nrlformulary/NRL FORMULARY 07.pdf<br />
[10] Lee S 1984 Proc. 1983 College <strong>on</strong> Plasma Physics, ICTP (Trieste, Italy) Radiati<strong>on</strong>s in Plasmas vol2edB<br />
McNamara (Singapore: World Scientific) pp 978–87<br />
[11] Potter D E 1971 Phys. Fluids 14 1911<br />
[12] Lee S 2000/2007 http://ckplee.myplace.nie.edu.sg/<strong>plasma</strong>physics/<br />
[13] Lee S 2005 ICTP Open Access Archive http://eprints.ictp.it/85/<br />
[14] Lee S and Saw S H 2008 J. Fusi<strong>on</strong> Energy 27 292–5<br />
[15] Lee S 2008 Plasma Phys. C<strong>on</strong>trol. Fusi<strong>on</strong> 50 105005<br />
[16] Silva P, Moreno J, Soto L, Birstein L, Mayer R E and Kies W 2003. Appl. Phys. Lett. 83 3269<br />
[17] Castillo F, Herrera JJE,Rangel J, Alfaro A, Maza M A and Sakaguchi V 2002 Braz. J. Phys. 32 3–12<br />
[18] Lee S et al 1988 Am. J. Phys. 56 62<br />
10
Plasma Phys. C<strong>on</strong>trol. Fusi<strong>on</strong> 51 (2009) 075006<br />
S Lee et al<br />
[19] Tou T Y, Lee S and Kwek K H 1989 IEEE Trans. Plasma Sci. 17 311<br />
[20] Lee S 1991 IEEE Trans. Plasma Sci. 19 912<br />
[21] Lee S and Serban A 1996 IEEE Trans. Plasma Sci. 24 1101–5<br />
[22] Ali J b 1990 Development and studies of a small <strong>plasma</strong> <strong>focus</strong> PhD Thesis Universiti Teknologi Malaysia,<br />
Malaysia<br />
[23] Liu M H, Feng X P, Springham S V and Lee S 1998 IEEE Trans. Plasma Sci. 26 135–40<br />
[24] Lee S 1998 Twelve years of UNU/ICTP PFF—a review IC, 98 (231) Abdus Salam ICTP, Miramare, Trieste;<br />
ICTP OAA: http://eprints.ictp.it/31/<br />
[25] Lee S, Lee P, Zhang G, Feng X, Gribkov V A, Liu M, Serban A and W<strong>on</strong>g T 1998 IEEE Trans. Plasma Sci.<br />
26 1119<br />
[26] Bing S 2000 Plasma dynamics and x-ray emissi<strong>on</strong> of the <strong>plasma</strong> <strong>focus</strong> PhD Thesis NIE ICTP Open Access<br />
Archive http://eprints.ictp.it/99/<br />
[27] Siahpoush V, Tafreshi M A, Sobhanian S and Khorram S 2005 Plasma Phys. C<strong>on</strong>trol. Fusi<strong>on</strong> 47 1065<br />
[28] Lee S Radiative Dense Plasma Focus Computati<strong>on</strong> Package: RADPF http://www.intimal.edu.my/school/<br />
fas/UFLF/; http://www.<strong>plasma</strong><strong>focus</strong>.net/IPFS/modelpackage/File1RADPF.htm<br />
[29] Lee S, Saw S H, Lee PCK,RawatRSandSchmidt H 2008 Appl. Phys. Lett. 92 111501<br />
[30] Lee S, Lee P, Saw S H and Rawat R S 2008 Plasma Phys. C<strong>on</strong>trol. Fusi<strong>on</strong> 50 065012<br />
[31] Lee S and Saw S H 2008 Appl. Phys. Lett. 92 021503<br />
[32] 2009 http://sourceforge.net/project/showfiles.php?group id=67696&package id=130007&release id=500277<br />
11