Assessing components of the natural environment of the Upper ...
Assessing components of the natural environment of the Upper ...
Assessing components of the natural environment of the Upper ...

You also want an ePaper? Increase the reach of your titles
YUMPU automatically turns print PDFs into web optimized ePapers that Google loves.
34 S. Lang et al.: <strong>Assessing</strong> <strong>components</strong> <strong>of</strong> <strong>the</strong> <strong>natural</strong> <strong>environment</strong><br />
Table 9. Number <strong>of</strong> HRUs delineated and <strong>the</strong> number <strong>of</strong> classes<br />
produced in all reference catchments.<br />
Reference catchment # <strong>of</strong> HRUs # <strong>of</strong> classes<br />
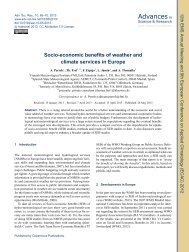
Figure 11. Schema to delineate HRUs.<br />
Salzach 6728 93<br />
Lech 2326 68<br />
Lhasa 8734 39<br />
Wang Chu 23887 n/a<br />
Assam 372822 n/a<br />
<strong>the</strong> different characters <strong>of</strong> <strong>the</strong> reference catchments (topography,<br />
land use, land cover, soil, etc.) and <strong>the</strong> various data<br />
sources used (e.g. soil data available in different schemes)<br />
<strong>the</strong> average size <strong>of</strong> <strong>the</strong> HRUs in <strong>the</strong> five reference catchments<br />
varies.<br />
5 Contributions to sustainable IWRM<br />
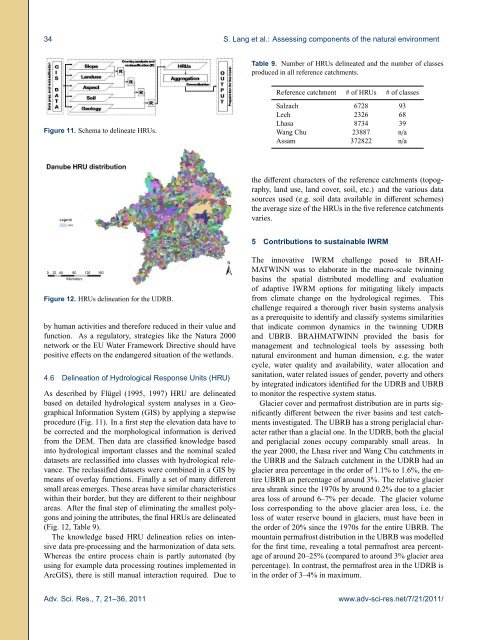
Figure 12. HRUs delineation for <strong>the</strong> UDRB.<br />
by human activities and <strong>the</strong>refore reduced in <strong>the</strong>ir value and<br />
function. As a regulatory, strategies like <strong>the</strong> Natura 2000<br />
network or <strong>the</strong> EU Water Framework Directive should have<br />
positive effects on <strong>the</strong> endangered situation <strong>of</strong> <strong>the</strong> wetlands.<br />
4.6 Delineation <strong>of</strong> Hydrological Response Units (HRU)<br />
As described by Flügel (1995, 1997) HRU are delineated<br />
based on detailed hydrological system analyses in a Geographical<br />
Information System (GIS) by applying a stepwise<br />
procedure (Fig. 11). In a first step <strong>the</strong> elevation data have to<br />
be corrected and <strong>the</strong> morphological information is derived<br />
from <strong>the</strong> DEM. Then data are classified knowledge based<br />
into hydrological important classes and <strong>the</strong> nominal scaled<br />
datasets are reclassified into classes with hydrological relevance.<br />
The reclassified datasets were combined in a GIS by<br />
means <strong>of</strong> overlay functions. Finally a set <strong>of</strong> many different<br />
small areas emerges. These areas have similar characteristics<br />
within <strong>the</strong>ir border, but <strong>the</strong>y are different to <strong>the</strong>ir neighbour<br />
areas. After <strong>the</strong> final step <strong>of</strong> eliminating <strong>the</strong> smallest polygons<br />
and joining <strong>the</strong> attributes, <strong>the</strong> final HRUs are delineated<br />
(Fig. 12, Table 9).<br />
The knowledge based HRU delineation relies on intensive<br />
data pre-processing and <strong>the</strong> harmonization <strong>of</strong> data sets.<br />
Whereas <strong>the</strong> entire process chain is partly automated (by<br />
using for example data processing routines implemented in<br />
ArcGIS), <strong>the</strong>re is still manual interaction required. Due to<br />
The innovative IWRM challenge posed to BRAH-<br />
MATWINN was to elaborate in <strong>the</strong> macro-scale twinning<br />
basins <strong>the</strong> spatial distributed modelling and evaluation<br />
<strong>of</strong> adaptive IWRM options for mitigating likely impacts<br />
from climate change on <strong>the</strong> hydrological regimes. This<br />
challenge required a thorough river basin systems analysis<br />
as a prerequisite to identify and classify systems similarities<br />
that indicate common dynamics in <strong>the</strong> twinning UDRB<br />
and UBRB. BRAHMATWINN provided <strong>the</strong> basis for<br />
management and technological tools by assessing both<br />
<strong>natural</strong> <strong>environment</strong> and human dimension, e.g. <strong>the</strong> water<br />
cycle, water quality and availability, water allocation and<br />
sanitation, water related issues <strong>of</strong> gender, poverty and o<strong>the</strong>rs<br />
by integrated indicators identified for <strong>the</strong> UDRB and UBRB<br />
to monitor <strong>the</strong> respective system status.<br />
Glacier cover and permafrost distribution are in parts significantly<br />
different between <strong>the</strong> river basins and test catchments<br />
investigated. The UBRB has a strong periglacial character<br />
ra<strong>the</strong>r than a glacial one. In <strong>the</strong> UDRB, both <strong>the</strong> glacial<br />
and periglacial zones occupy comparably small areas. In<br />
<strong>the</strong> year 2000, <strong>the</strong> Lhasa river and Wang Chu catchments in<br />
<strong>the</strong> UBRB and <strong>the</strong> Salzach catchment in <strong>the</strong> UDRB had an<br />
glacier area percentage in <strong>the</strong> order <strong>of</strong> 1.1% to 1.6%, <strong>the</strong> entire<br />
UBRB an percentage <strong>of</strong> around 3%. The relative glacier<br />
area shrank since <strong>the</strong> 1970s by around 0.2% due to a glacier<br />
area loss <strong>of</strong> around 6–7% per decade. The glacier volume<br />
loss corresponding to <strong>the</strong> above glacier area loss, i.e. <strong>the</strong><br />
loss <strong>of</strong> water reserve bound in glaciers, must have been in<br />
<strong>the</strong> order <strong>of</strong> 20% since <strong>the</strong> 1970s for <strong>the</strong> entire UBRB. The<br />
mountain permafrost distribution in <strong>the</strong> UBRB was modelled<br />
for <strong>the</strong> first time, revealing a total permafrost area percentage<br />
<strong>of</strong> around 20–25% (compared to around 3% glacier area<br />
percentage). In contrast, <strong>the</strong> permafrost area in <strong>the</strong> UDRB is<br />
in <strong>the</strong> order <strong>of</strong> 3–4% in maximum.<br />
Adv. Sci. Res., 7, 21–36, 2011<br />
www.adv-sci-res.net/7/21/2011/