Assessing components of the natural environment of the Upper ...
Assessing components of the natural environment of the Upper ...
Assessing components of the natural environment of the Upper ...

You also want an ePaper? Increase the reach of your titles
YUMPU automatically turns print PDFs into web optimized ePapers that Google loves.
28 S. Lang et al.: <strong>Assessing</strong> <strong>components</strong> <strong>of</strong> <strong>the</strong> <strong>natural</strong> <strong>environment</strong><br />
Table 3.<br />
level 2.<br />
Classification scheme with subclasses for level 1 and<br />
BRAHMATWINN classification scheme<br />
Level 1 Level 2<br />
No. LULC No. LULC<br />
10 000 Agriculture 1201 Arable land<br />
1202 Pasture and/or meadow<br />
1203 Plantation<br />
20 000 Bare ground 2201 Soil<br />
2202 Rock and debris<br />
30 000 Forest 3201 Coniferous<br />
3202 Decidious<br />
3203 Evergreen<br />
3204 Mixed<br />
3205 Plantation<br />
40 000 Non forest vegetation 4201 Bushland<br />
4202 Alpine grassland<br />
4203 Grassland<br />
4204 Shrubland<br />
50 000 Ice and snow 5201 Glacier<br />
5202 Snow<br />
60 000 Built up areas 6201 Urban<br />
6202 Rural<br />
70 000 Open water 7201 Water courses<br />
7202 Water bodies<br />
80 000 Unclassified 8201 Clouds<br />
8202 Shadow<br />
and snow cover. Though, <strong>the</strong>se potential impacts affect only<br />
small areas due to <strong>the</strong> small permafrost area percentage in<br />
<strong>the</strong> Wang Chu.<br />
In <strong>the</strong> Salzach basin, UDRB, <strong>the</strong> area percentage underlain<br />
by permafrost is in <strong>the</strong> order <strong>of</strong> 3–4% (Table 2); perhaps even<br />
less, because <strong>the</strong> model applied to <strong>the</strong> UDRB allows slightly<br />
warmer conditions for <strong>the</strong> existence <strong>of</strong> permafrost compared<br />
to <strong>the</strong> UBRB permafrost model. Similar percentage numbers<br />
are found for <strong>the</strong> entire UDRB as for <strong>the</strong> Salzach.<br />
4.3 Land use and land cover<br />
For <strong>the</strong> LULC classification for <strong>the</strong> three Asian reference<br />
catchments Lhasa river (Tibet, China), Wang Chu (Bhutan),<br />
Brahmaputra near Guwahati (Assam, India), and <strong>the</strong> two<br />
European reference catchments Salzach (Austria/Germany)<br />
and Lech (Austria/Germany), suitable satellite data were acquired,<br />
selected and compiled. A joint LULC expert workshop<br />
was organized to work out a harmonized classification<br />
key (see Table 3) and thus to ascertain compatible classifications<br />
in Asia and EU. Level 1 and level 2 comprise 8 main<br />
classes and 22 subclasses, respectively. These classes can be<br />
derived from satellite imagery and additional, auxiliary data<br />
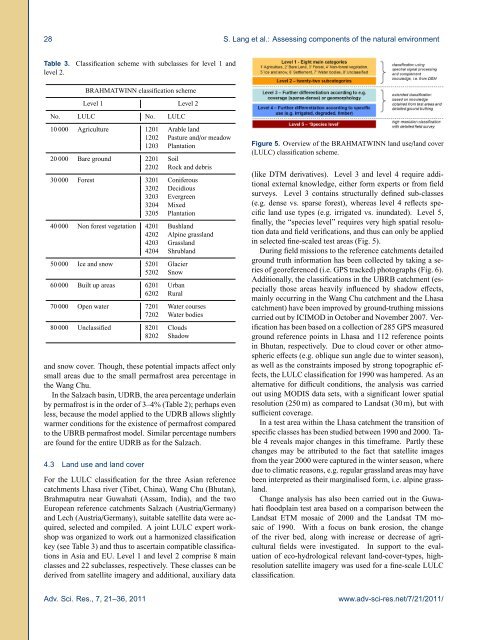
Figure 5. Overview <strong>of</strong> <strong>the</strong> BRAHMATWINN land use/land cover<br />
(LULC) classification scheme.<br />
(like DTM derivatives). Level 3 and level 4 require additional<br />
external knowledge, ei<strong>the</strong>r form experts or from field<br />
surveys. Level 3 contains structurally defined sub-classes<br />
(e.g. dense vs. sparse forest), whereas level 4 reflects specific<br />
land use types (e.g. irrigated vs. inundated). Level 5,<br />
finally, <strong>the</strong> “species level” requires very high spatial resolution<br />
data and field verifications, and thus can only be applied<br />
in selected fine-scaled test areas (Fig. 5).<br />
During field missions to <strong>the</strong> reference catchments detailed<br />
ground truth information has been collected by taking a series<br />
<strong>of</strong> georeferenced (i.e. GPS tracked) photographs (Fig. 6).<br />
Additionally, <strong>the</strong> classifications in <strong>the</strong> UBRB catchment (especially<br />
those areas heavily influenced by shadow effects,<br />
mainly occurring in <strong>the</strong> Wang Chu catchment and <strong>the</strong> Lhasa<br />
catchment) have been improved by ground-truthing missions<br />
carried out by ICIMOD in October and November 2007. Verification<br />
has been based on a collection <strong>of</strong> 285 GPS measured<br />
ground reference points in Lhasa and 112 reference points<br />
in Bhutan, respectively. Due to cloud cover or o<strong>the</strong>r atmospheric<br />
effects (e.g. oblique sun angle due to winter season),<br />
as well as <strong>the</strong> constraints imposed by strong topographic effects,<br />
<strong>the</strong> LULC classification for 1990 was hampered. As an<br />
alternative for difficult conditions, <strong>the</strong> analysis was carried<br />
out using MODIS data sets, with a significant lower spatial<br />
resolution (250 m) as compared to Landsat (30 m), but with<br />
sufficient coverage.<br />
In a test area within <strong>the</strong> Lhasa catchment <strong>the</strong> transition <strong>of</strong><br />
specific classes has been studied between 1990 and 2000. Table<br />
4 reveals major changes in this timeframe. Partly <strong>the</strong>se<br />
changes may be attributed to <strong>the</strong> fact that satellite images<br />
from <strong>the</strong> year 2000 were captured in <strong>the</strong> winter season, where<br />
due to climatic reasons, e.g. regular grassland areas may have<br />
been interpreted as <strong>the</strong>ir marginalised form, i.e. alpine grassland.<br />
Change analysis has also been carried out in <strong>the</strong> Guwahati<br />
floodplain test area based on a comparison between <strong>the</strong><br />
Landsat ETM mosaic <strong>of</strong> 2000 and <strong>the</strong> Landsat TM mosaic<br />
<strong>of</strong> 1990. With a focus on bank erosion, <strong>the</strong> change<br />
<strong>of</strong> <strong>the</strong> river bed, along with increase or decrease <strong>of</strong> agricultural<br />
fields were investigated. In support to <strong>the</strong> evaluation<br />
<strong>of</strong> eco-hydrological relevant land-cover-types, highresolution<br />
satellite imagery was used for a fine-scale LULC<br />
classification.<br />
Adv. Sci. Res., 7, 21–36, 2011<br />
www.adv-sci-res.net/7/21/2011/