physica status solid.. - Mechanical and Aerospace Engineering
physica status solid.. - Mechanical and Aerospace Engineering
physica status solid.. - Mechanical and Aerospace Engineering

You also want an ePaper? Increase the reach of your titles
YUMPU automatically turns print PDFs into web optimized ePapers that Google loves.
<strong>physica</strong><br />
<strong>status</strong><br />
<strong>solid</strong>i<br />
rrl<br />
100 J. N. Armstrong et al.: Strength of metals at the Fermi length scale<br />
200<br />
0<br />
200<br />
Conductance (2e 2 /h)<br />
150<br />
100<br />
50<br />
0<br />
G v<br />
u v w<br />
u v w<br />
F v Yield<br />
8 9 10 11 12<br />
Piezo Retraction (nm)<br />
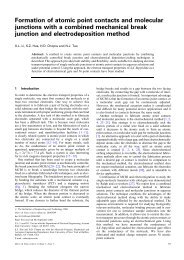
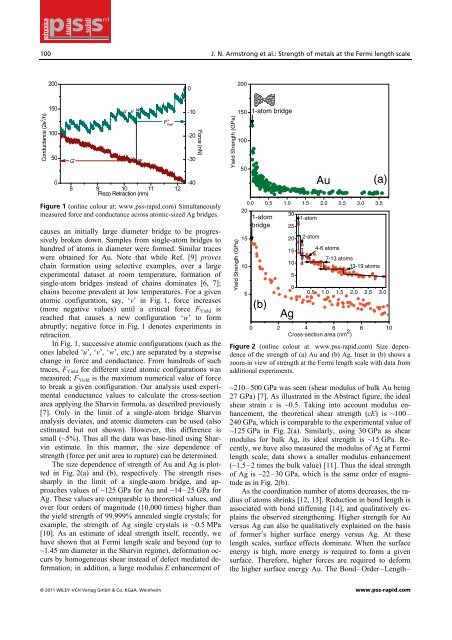
Figure 1 (online colour at: www.pss-rapid.com) Simultaneously<br />
measured force <strong>and</strong> conductance across atomic-sized Ag bridges.<br />
causes an initially large diameter bridge to be progressively<br />
broken down. Samples from single-atom bridges to<br />
hundred of atoms in diameter were formed. Similar traces<br />
were obtained for Au. Note that while Ref. [9] proves<br />
chain formation using selective examples, over a large<br />
experimental dataset at room temperature, formation of<br />
single-atom bridges instead of chains dominates [6, 7];<br />
chains become prevalent at low temperatures. For a given<br />
atomic configuration, say, ‘v’ in Fig. 1, force increases<br />
(more negative values) until a critical force F Yield is<br />
reached that causes a new configuration ‘w’ to form<br />
abruptly; negative force in Fig. 1 denotes experiments in<br />
retraction.<br />
In Fig. 1, successive atomic configurations (such as the<br />
ones labeled ‘u’, ‘v’, ‘w’, etc.) are separated by a stepwise<br />
change in force <strong>and</strong> conductance. From hundreds of such<br />
traces, F Yield for different sized atomic configurations was<br />
measured; F Yield is the maximum numerical value of force<br />
to break a given configuration. Our analysis used experimental<br />
conductance values to calculate the cross-section<br />
area applying the Sharvin formula, as described previously<br />
[7]. Only in the limit of a single-atom bridge Sharvin<br />
analysis deviates, <strong>and</strong> atomic diameters can be used (also<br />
estimated but not shown). However, this difference is<br />
small (~5%). Thus all the data was base-lined using Sharvin<br />
estimate. In this manner, the size dependence of<br />
strength (force per unit area to rupture) can be determined.<br />
The size dependence of strength of Au <strong>and</strong> Ag is plotted<br />
in Fig. 2(a) <strong>and</strong> (b), respectively. The strength rises<br />
sharply in the limit of a single-atom bridge, <strong>and</strong> approaches<br />
values of ~125 GPa for Au <strong>and</strong> ~14–25 GPa for<br />
Ag. These values are comparable to theoretical values, <strong>and</strong><br />
over four orders of magnitude (10,000 times) higher than<br />
the yield strength of 99.999% annealed single crystals; for<br />
example, the strength of Ag single crystals is ~0.5 MPa<br />
[10]. As an estimate of ideal strength itself, recently, we<br />
have shown that at Fermi length scale <strong>and</strong> beyond (up to<br />
~1.45 nm diameter in the Sharvin regime), deformation occurs<br />
by homogeneous shear instead of defect mediated deformation;<br />
in addition, a large modulus E enhancement of<br />
-10<br />
-20<br />
-30<br />
-40<br />
Force (nN)<br />
Yield Strength (GPa)<br />
Yield Strength (GPa)<br />
150<br />
100<br />
50<br />
1-atom bridge<br />
Au<br />
(a)<br />
0.0 0.5 1.0 1.5 2.0 2.5 3.0 3.5<br />
20<br />
30<br />
1-atom 1-atom<br />
bridge 25<br />
15<br />
10<br />
5<br />
(b)<br />
20<br />
15<br />
10<br />
5<br />
0<br />
Ag<br />
2-atom<br />
4-6 atoms<br />
7-13 atoms<br />
13-19 atoms<br />
0.5 1.0 1.5 2.0 2.5 3.0<br />
0 2 4 6 8 10<br />
Cross-section area (nm 2 )<br />
Figure 2 (online colour at: www.pss-rapid.com) Size dependence<br />
of the strength of (a) Au <strong>and</strong> (b) Ag. Inset in (b) shows a<br />
zoom-in view of strength at the Fermi length scale with data from<br />
additional experiments.<br />
~210–500 GPa was seen (shear modulus of bulk Au being<br />
27 GPa) [7]. As illustrated in the Abstract figure, the ideal<br />
shear strain ε is ~0.5. Taking into account modulus enhancement,<br />
the theoretical shear strength (εE) is ~100–<br />
240 GPa, which is comparable to the experimental value of<br />
~125 GPa in Fig. 2(a). Similarly, using 30 GPa as shear<br />
modulus for bulk Ag, its ideal strength is ~15 GPa. Recently,<br />
we have also measured the modulus of Ag at Fermi<br />
length scale; data shows a smaller modulus enhancement<br />
(~1.5–2 times the bulk value) [11]. Thus the ideal strength<br />
of Ag is ~22–30 GPa, which is the same order of magnitude<br />
as in Fig. 2(b).<br />
As the coordination number of atoms decreases, the radius<br />
of atoms shrinks [12, 13]. Reduction in bond length is<br />
associated with bond stiffening [14], <strong>and</strong> qualitatively explains<br />
the observed strengthening. Higher strength for Au<br />
versus Ag can also be qualitatively explained on the basis<br />
of former’s higher surface energy versus Ag. At these<br />
length scales, surface effects dominate. When the surface<br />
energy is high, more energy is required to form a given<br />
surface. Therefore, higher forces are required to deform<br />
the higher surface energy Au. The Bond–Order–Length–<br />
© 2011 WILEY-VCH Verlag GmbH & Co. KGaA, Weinheim www.pss-rapid.com