Summary of EPMA - Earth and Planetary Sciences Electron ...
Summary of EPMA - Earth and Planetary Sciences Electron ...
Summary of EPMA - Earth and Planetary Sciences Electron ...

Create successful ePaper yourself
Turn your PDF publications into a flip-book with our unique Google optimized e-Paper software.
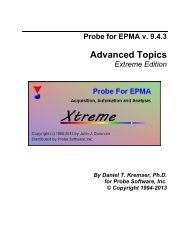
Everything You Always Wanted to Know About<br />
<strong>Electron</strong>-Probe Microanalysis (<strong>EPMA</strong>):<br />
An Overview<br />
Paul Carpenter<br />
<strong>Earth</strong> <strong>and</strong> <strong>Planetary</strong> <strong>Sciences</strong><br />
CB1169<br />
Washington University<br />
1 Brookings Drive<br />
St. Louis, MO 63130<br />
paulc@levee.wustl.edu<br />
e - Cu<br />
Monte Carlo<br />
σ<br />
=<br />
N<br />
(P -<br />
B)<br />
k =<br />
(P -<br />
B)<br />
smp<br />
std<br />
P<br />
Φ 0<br />
Cu Kα<br />
Φ(ρz)<br />
C = k * ZAF<br />
B<br />
<strong>Summary</strong> <strong>of</strong> <strong>EPMA</strong><br />
Characteristic x-rays measured by WDS on flat, polished<br />
(bulk) material at known x-ray take<strong>of</strong>f angle to<br />
spectrometer. Elements Be-U at ~0.01-100 wt%<br />
Peak intensities background <strong>and</strong> deadtime corrected,<br />
precision σ = sqrt(N) for N number <strong>of</strong> counts.<br />
Comparative technique: Ratio <strong>of</strong> x-ray intensity on sample<br />
is made to same on st<strong>and</strong>ard (“k-ratio”):<br />
k = (P-B) smp / (P-B) std<br />
Iterative correction for atomic number (Z), x-ray absorption<br />
(A), <strong>and</strong> x-ray fluorescence (F) due to other elements on<br />
element <strong>of</strong> interest. Correction is function composition:<br />
C = k * ZAF, accuracy typically ≥ 2% relative<br />
Issues: sample volume, st<strong>and</strong>ards, background<br />
determination, secondary fluorescence, accuracy<br />
<strong>EPMA</strong> Overview 2<br />
1
<strong>EPMA</strong> <strong>Summary</strong>: ZAF <strong>and</strong> X-ray Correction<br />
<br />
<br />
<br />
<br />
<br />
Measured x-ray intensities are converted to concentration units via:<br />
C sample = C std K * Z A F, K = (P-B) sample / (P-B) st<strong>and</strong>ard<br />
Matrix effects arise because each element present in the analytical<br />
volume influences x-ray generation <strong>and</strong> propagation <strong>of</strong> every other<br />
element.<br />
The atomic number factor Z corrects for differences in the stopping<br />
power (S) <strong>and</strong> backscattering (R) between the sample <strong>and</strong> st<strong>and</strong>ard.<br />
Example: Al Kα in Al 3 Cu 97 vs. Al metal<br />
The absorption factor A corrects for x-ray absorption within both the<br />
sample <strong>and</strong> st<strong>and</strong>ard. This is the largest correction parameter, <strong>and</strong> is<br />
critically dependent on accelerating voltage<br />
Example: Ni Kα absorbed by Fe<br />
The fluorescence factor F corrects for characteristic x-ray<br />
fluorescence within the sample <strong>and</strong> st<strong>and</strong>ard.<br />
Example: Fe Kα fluoresced by Ni Kα<br />
<strong>EPMA</strong> Overview 3<br />
<strong>Summary</strong> <strong>of</strong> <strong>EPMA</strong>, cont.<br />
Analytical volume determined by e - scattering, ~1µm,<br />
differs for x-rays <strong>of</strong> dissimilar energy.<br />
Best st<strong>and</strong>ards similar to sample to minimize ZAF<br />
correction. Lack <strong>of</strong> multielement st<strong>and</strong>ards a problem.<br />
St<strong>and</strong>ardless elusive due to uncertainty calculating WDS<br />
efficiency.<br />
Automated analysis: spot, line, grid, map.<br />
Z-axis positioning <strong>of</strong> sample critical for WDS focus, use <strong>of</strong><br />
optical microscope for positioning.<br />
EDS essential for ID <strong>of</strong> materials, mapping, quant.<br />
Technique provides complete analysis, limited by<br />
continuum background for trace elements.<br />
<strong>EPMA</strong> Overview 4<br />
2
<strong>Electron</strong> Microprobe Essential Characteristics<br />
Dedicated wavelength-dispersive spectrometers (WDS)<br />
Optical microscope coaxial with electron column, aut<strong>of</strong>ocus<br />
Stabilization <strong>of</strong> e- gun shift <strong>and</strong> tilt, feedback circuit<br />
Energy-dispersive spectrometer (EDS)<br />
Stage: multisample, non-tilting, large xy range<br />
Automation <strong>of</strong> vacuum, electron optic, stage, spectrometer<br />
S<strong>of</strong>tware system for imaging, quantitative analysis<br />
<strong>Electron</strong> gun: W, LaB6/CeB6, field emission<br />
Backscattered <strong>and</strong> secondary e- detectors<br />
Cathodoluminescence detector / spectrometer<br />
<strong>EPMA</strong> Overview 5<br />
Advances in <strong>EPMA</strong><br />
Improvements in vacuum systems, computer<br />
automation/operating systems, electronic stability<br />
Improved imaging resolution using field-emission gun <strong>and</strong><br />
CeB6 sources<br />
Specialized WDS analyzing crystals <strong>and</strong> high intensity<br />
spectrometer configurations<br />
SDD revolution transitioning to microprobe systems<br />
Cathodoluminescence spectrometers <strong>and</strong> detectors<br />
Research on st<strong>and</strong>ards <strong>and</strong> correction algorithms<br />
More <strong>and</strong> improved s<strong>of</strong>tware tools to aid the analyst<br />
X-ray mapping via stage <strong>and</strong> beam scanning<br />
<strong>EPMA</strong> Overview 6<br />
3
What Materials Are Analyzed by <strong>EPMA</strong>?<br />
Sample Requirements<br />
Samples must be:<br />
Solid (<strong>EPMA</strong> does not include VP conditions)<br />
Polished flat (~0.25µm)<br />
Conductive or made so by evaporation <strong>of</strong> carbon<br />
Stable in vacuum <strong>and</strong> under electron beam bombardment<br />
Materials historically analyzed:<br />
Elements Be-U<br />
Inorganics, metals/alloys, ceramics, minerals, glasses<br />
Biological, pharmaceutical, organic, etc. if fixated/stabilized<br />
Particles, thin films/multilayers, rough surfaces, tilted<br />
All deviations from flat <strong>and</strong> normal to beam must be treated<br />
with specific modifications to correction algorithms<br />
<strong>EPMA</strong> Overview 7<br />
Commercial <strong>Electron</strong> Microprobe Instruments<br />
JEOL JXA-8200/8500F, Cameca SX-100<br />
Continued integration <strong>of</strong> computer control <strong>and</strong> improvements in<br />
imaging <strong>and</strong> analytical capabilities.<br />
Additional options from Probe S<strong>of</strong>tware, Advanced Microbeam, <strong>and</strong><br />
Shimadzu for s<strong>of</strong>tware <strong>and</strong>/or hardware systems <strong>and</strong> upgrades<br />
<strong>EPMA</strong> Overview 8<br />
4
Microprobe Column with WDS, Stage Port, Optical<br />
Microscope<br />
<strong>EPMA</strong> Overview 9<br />
<strong>Electron</strong> Microprobe at Washington University STL<br />
Ion Pump – <strong>Electron</strong> Gun<br />
Silicon-drift Energy-dispersive<br />
Spectrometer<br />
<strong>Electron</strong> Column<br />
Gun<br />
Condenser Lens<br />
Objective Lens<br />
Cathodoluminescence Detector<br />
Wavelength-dispersive<br />
Spectrometer (5)<br />
Objective Lens Aperture<br />
Optical Microscope <strong>and</strong> Camera<br />
Sample exchange chamber<br />
Column Vacuum<br />
System <strong>and</strong><br />
Computer Boards<br />
(inside)<br />
Stage motors X, Y, Z<br />
Column <strong>Electron</strong>ics<br />
<strong>EPMA</strong> Overview 10<br />
5
Microprobe Column Cross-section<br />
<strong>EPMA</strong> Overview 11<br />
Microprobe Sample Holder <strong>and</strong> St<strong>and</strong>ard Mount<br />
<strong>EPMA</strong> Overview 12<br />
6
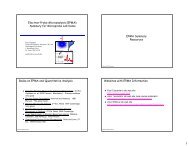
Introduction<br />
Resources<br />
Books on <strong>EPMA</strong> <strong>and</strong> Quantitative Analysis<br />
Scanning <strong>Electron</strong> Microscopy <strong>and</strong> X-ray Microanalysis, 3rd Ed.,<br />
Goldstein et. al. 2003 Plenum. M<strong>and</strong>atory! – Previous editions<br />
very good<br />
<strong>Electron</strong> Probe Quantitation, Heinrich <strong>and</strong> Newbury. 1991<br />
Plenum. “The green book”.<br />
<strong>Electron</strong> Microprobe Analysis, 2 nd Ed., Reed. 1997 Cambridge.<br />
Very good.<br />
<strong>Electron</strong> Microprobe Analysis <strong>and</strong> Scanning <strong>Electron</strong><br />
Microscopy in Geology, 2 nd Ed. Reed. 2006 Cambridge.<br />
X-ray Spectrometry in <strong>Electron</strong> Beam Instruments, Williams,<br />
Goldstein, <strong>and</strong> Newbury. 1995 Plenum.<br />
Quantitative <strong>Electron</strong>-Probe Microanalysis, Scott <strong>and</strong> Love, 2 nd<br />
Ed., 1995 Prentice Hall.<br />
<strong>EPMA</strong> Overview 14<br />
7
Journals on X-ray Spectrometry, Microscopy, <strong>and</strong><br />
Quantitative Analysis<br />
Microscopy <strong>and</strong> Microanalysis. MSA, MAS <strong>of</strong>ficial journal.<br />
Also proceedings <strong>of</strong> M&M meetings since 1995.<br />
Cambridge.<br />
X-ray Spectrometry. Elsevier.<br />
Scanning.<br />
Microbeam Analysis. Proceedings <strong>of</strong> Microbeam Analysis<br />
Society (up to 1995).<br />
<strong>EPMA</strong> Overview 15<br />
Microanalysis S<strong>of</strong>tware<br />
Free or Shareware<br />
CalcZAF– A collection <strong>of</strong> ZAF <strong>and</strong> Φ(ρz) algorithms<br />
used to convert relative x-ray intensities to<br />
concentration. Based on CITZAF (Armstrong).<br />
http://epmalab.uoregon.edu/calczaf.htm<br />
TRYZAF – Version <strong>of</strong> CITZAF used to compare<br />
correction algorithms <strong>and</strong> data sets for given<br />
elements.<br />
http://www.cstl.nist.gov/div837/Division/outputs/s<strong>of</strong>tware.htm<br />
GMR – Φ(ρz) thin-film correction program, includes<br />
contiuum fluorescence correction, used to calculate K<br />
or C for multilayer thin films on substrates.<br />
Casino – Monte Carlo simulation program for electron<br />
scattering <strong>and</strong> x-ray Φ(ρz) distributions.<br />
http://www.gel.usherbrooke.ca/casino<br />
<strong>EPMA</strong> Overview 16<br />
8
Microanalysis S<strong>of</strong>tware<br />
Free or Shareware<br />
Winxray – Program to generate EDS spectra using<br />
Monte Carlo <strong>and</strong> Φ(ρz) algorithms.<br />
http://montecarlomodeling.mcgill.ca<br />
NIST S<strong>of</strong>tware Products – DTSA-II (Desktop<br />
Spectrum Analyzer).<br />
http://www.cstl.nist.gov/div837/837.02/epq/dtsa2/<br />
Lispix – Image processing program by Dave Bright at<br />
NIST, very powerful features for x-ray maps.<br />
http://www.cstl.nist.gov/div837/Division/outputs/s<strong>of</strong>tware.htm<br />
Penelope – Advanced Monte Carlo program<br />
ftp://giga.sct.ub.es/serveis/msonda<br />
<strong>EPMA</strong> Overview 17<br />
Microanalysis Resources<br />
<strong>EPMA</strong> Course Notes on the WWW<br />
James Wittke, Univ. Northern Arizona, Geology 510 (new):<br />
http://www4.nau.edu/microanalysis/Microprobe/Probe.html<br />
John Donovan, University <strong>of</strong> Oregon, Geol 619:<br />
http://epmalab.uoregon.edu/geol619.htm<br />
John Fournelle, University <strong>of</strong> Wisconsin, Geol 777:<br />
http://www.geology.wisc.edu/~johnf/sx51.html<br />
Paul Carpenter, Washington University:<br />
http://xraysrv.wustl.edu/<br />
Lehigh Microscopy School Short Courses:<br />
http://www.lehigh.edu/microscopy/<br />
<strong>EPMA</strong> Overview 18<br />
9
<strong>Electron</strong>-Specimen Interactions<br />
<strong>and</strong><br />
X-ray Generation<br />
<strong>Electron</strong> – Specimen Interactions<br />
<strong>Electron</strong>s from the beam are involved in elastic <strong>and</strong><br />
inelastic scattering events in the sample.<br />
Elastic scattering is responsible for backscatteredelectrons<br />
<strong>and</strong> is a valuable compositional imaging<br />
tool, due to Z contrast.<br />
Inelastic scattering is responsible for characteristic<br />
<strong>and</strong> continuum x-ray production, secondary <strong>and</strong><br />
Auger electrons, electron-hole pairs in Si(Li) <strong>and</strong><br />
SDD detectors, cathodoluminescence (long λ<br />
radiation in vis, UV, <strong>and</strong> IR), lattice vibrations<br />
(phonons), <strong>and</strong> electron oscillations (plasmons).<br />
The probability <strong>of</strong> an elastic or inelastic scattering<br />
event taking place is described by Q, the scattering<br />
cross-section, (units cm 2 ), so as Q increases, the<br />
“area” increases as does the probability <strong>of</strong> an event.<br />
<strong>EPMA</strong> Overview 20<br />
10
<strong>Electron</strong>-Specimen Interaction <strong>and</strong> Signals<br />
Produced<br />
<strong>EPMA</strong> Overview 21<br />
When an energetic beam electron (1-30 keV) strikes<br />
the specimen (atoms)…What happens?<br />
Many things happen!<br />
Scattered primary e-<br />
Secondary e-<br />
Primary e-<br />
Avg ~ 5 o Inelastic scattering:<br />
Elastic scattering:<br />
Change direction (0 -180 o )<br />
No e - energy loss<br />
Characteristic X-ray<br />
Continuum X-ray<br />
No change in direction (~ 0.1 o )<br />
Energy loss: dE/ds ~ 10 eV/nm<br />
For 10000eV = 1000nm = 1 µm<br />
<strong>EPMA</strong> Overview 22<br />
11
Beam Spread Due to Scattering<br />
We wish it was like this:<br />
Beam<br />
Diameter<br />
Actually, it’s like this:<br />
Elastic scattering causes spread<br />
away from beam diameter, <strong>and</strong><br />
inelastic scattering limits the<br />
distance <strong>of</strong> travel.<br />
<strong>EPMA</strong> Overview 23<br />
Monte Carlo Modeling<br />
<br />
Monte Carlo simulations model electron-specimen<br />
interactions <strong>and</strong> x-ray production in the specimen.<br />
<strong>Electron</strong> scattering, slowing down, backscattering, x-<br />
ray production, etc. are all modeled using r<strong>and</strong>om<br />
number generation <strong>and</strong> r<strong>and</strong>om electron scattering<br />
directions.<br />
Good agreement is observed between Monte Carlo<br />
data <strong>and</strong> experimental measurements.<br />
This agreement is evidence <strong>of</strong> the accuracy <strong>of</strong><br />
quantitative analysis algorithms.<br />
<strong>EPMA</strong> Overview 24<br />
12
Calculating the <strong>Electron</strong>-Specimen Interaction<br />
Monte Carlo electron trajectory simulation:<br />
Calculate:<br />
The elastic scattering (step, angle)<br />
<strong>and</strong> inelastic scattering (energy loss).<br />
“Ride” the electron stepwise, always<br />
knowing the position (x,y,z), energy,<br />
<strong>and</strong> velocity.<br />
dE/ds<br />
Elastic<br />
Scattering<br />
Angle, φ<br />
Record distributions <strong>of</strong> backscattering,<br />
X-ray production.<br />
Step, S<br />
<strong>EPMA</strong> Overview 25<br />
Monte Carlo Calculations: X-rays<br />
<strong>Electron</strong> Trajectories<br />
Sites <strong>of</strong> Inner Shell Ionization:<br />
Characteristic X-rays<br />
Fe, 20 keV, 50 nm beam, E c = 7.111 keV, E kα = 6.403<br />
Interaction volume: Where everything<br />
interesting happens: electrons, X-rays, etc.<br />
<strong>EPMA</strong> Overview 26<br />
13
Casino Monte Carlo Program<br />
Simulation Fe 3<br />
C, 15 keV, 5000 trajectories, max depth ~750nm<br />
Red = backscattered e-, blue e- within Fe 3<br />
C.<br />
Scattering angle increases as e- energy decreases (curly trajectory)<br />
<strong>EPMA</strong> Overview 27<br />
Monte Carlo Simulation<br />
Effect <strong>of</strong> Varying Accelerating Voltage<br />
Pure Fe 26<br />
<strong>Electron</strong> range<br />
increases with AV<br />
R ~ E 1.67<br />
5 KeV 1 µm 10 KeV 1 µm<br />
R<br />
20 KeV 1 µm 30 KeV 1 µm<br />
<strong>EPMA</strong> Overview 28<br />
14
Monte Carlo Simulation<br />
Effect <strong>of</strong> Varying Atomic Number Z @ 25 keV<br />
<strong>Electron</strong> range<br />
decreases with Z<br />
R ~ A / (Z 0.89 ρ)<br />
Si 14 2 µm Ge 32<br />
2 µm<br />
R<br />
Sn 50 2 µm Pb 82<br />
2 µm<br />
<strong>EPMA</strong> Overview 29<br />
Energy Deposition: Experiment vs. Monte Carlo<br />
5 µm<br />
Everhart et al., 1972<br />
Casino:<br />
Energy deposition contours<br />
5-90% in Fe 3 C at 15keV<br />
Energy deposition per mm<br />
PMMA e - dose with etching<br />
to reveal scattering volume<br />
<strong>EPMA</strong> Overview 30<br />
15
<strong>Electron</strong> Range (Kanaya & Okayama)<br />
R K-O (µm) = 0.0276 (A/Z 0.89 ρ) E 0<br />
1.67<br />
Element<br />
5 keV<br />
10 keV<br />
20 keV<br />
30 keV<br />
<strong>Electron</strong> Range<br />
increases w E o ,<br />
decreases with Z<br />
C<br />
Al<br />
Fe<br />
450 nm<br />
413 nm<br />
159 nm<br />
1.4 µm<br />
1.3 um<br />
505 nm<br />
4.5 µm<br />
4.2 µm<br />
1.6 µm<br />
8.9 µm<br />
8.2 µm<br />
3.2 µm<br />
Ag<br />
135 nm<br />
431 nm<br />
1.4 µm<br />
2.7 µm<br />
Au<br />
85 nm<br />
270 nm<br />
860 nm<br />
1.7 µm<br />
<strong>EPMA</strong> Overview 31<br />
What Signals Come from the Specimen?<br />
Beam electrons that have<br />
undergone sufficient<br />
scattering to escape.<br />
Backscatter Coefficient<br />
η = n BSE /n B<br />
η = i BSE /i B<br />
Backscattered electrons<br />
Absorbed<br />
or specimen<br />
current electrons<br />
Cu, η ~ 30%<br />
<strong>EPMA</strong> Overview 32<br />
16
Characteristics <strong>of</strong> Backscattered <strong>Electron</strong>s:<br />
Effect <strong>of</strong> Specimen Composition, η vs. Z<br />
η<br />
BSE fraction η increases with Z<br />
η vs. Z is generally monotonic<br />
Higher Z: non-linear<br />
<strong>and</strong> shallow<br />
Initially linear <strong>and</strong> steep;<br />
best sensitivity dη/dZ<br />
Z<br />
For a mixture <strong>of</strong> atoms<br />
(e.g., alloys, compounds)<br />
SiC, Mg 2 SiO 4 , GaAs, IrSi, etc.<br />
η mix = η A C A + η B C B +...<br />
So the weighted average<br />
η is used for correction<br />
This approach is used for<br />
correction parameters when<br />
we don’t have specific data<br />
<strong>EPMA</strong> Overview 33<br />
Backscattering vs. Beam Energy<br />
10 keV<br />
20 keV<br />
As accelerating voltage is increased, penetration depth <strong>and</strong> scattering<br />
volume both increase, but bse fraction is weak function <strong>of</strong> voltage<br />
Fe<br />
<strong>EPMA</strong> Overview 34<br />
17
Contrast Mechanism<br />
Changes in the signal(s) (“Contrast”) collected at<br />
different points in the image convey information about<br />
specimen characteristics.<br />
Whenever a signal changes in a predictable way as a<br />
function <strong>of</strong> specimen properties, we have the basis for<br />
a contrast mechanism.<br />
Example: η vs. Z is monotonic <strong>and</strong> predictable. This<br />
forms the basis for atomic number (compositional)<br />
contrast.<br />
<strong>EPMA</strong> Overview 35<br />
Atomic Number Contrast<br />
Raney Ni-Al<br />
2 NiAl, Al<br />
Al-Cu eutectic<br />
Obsidian<br />
Ni-high<br />
Ni-med<br />
Cu<br />
Al<br />
Fe-oxide<br />
Glass<br />
Al<br />
50 µm 2 µm<br />
10 µm<br />
Backscattered-electrons provide a rapid <strong>and</strong> simple means to image<br />
differences in chemistry in the sample, via the dependence on average<br />
atomic number.<br />
<strong>EPMA</strong> Overview 36<br />
18
Compositional Mapping<br />
<br />
<br />
<br />
<br />
<br />
Normal x-ray mapping is performed by setting up an energy region <strong>of</strong><br />
interest (ROI) in the EDS spectrum. All x-rays falling in that ROI are<br />
assigned to the digital map for that element.<br />
Drawback is each map has only information for that element <strong>and</strong> can<br />
not be used to perform quantitative analysis. X-rays from other elements<br />
also may be counted in the ROI – peak overlaps, continuum x-rays, etc.<br />
Sophisticated mathematical approaches have been used in recent years<br />
to process x-ray map data. These involve correlation between<br />
elements, but also correlation between groups <strong>of</strong> elements.<br />
Examples <strong>of</strong> these approaches are Concentration Histogram Imaging<br />
<strong>and</strong> Principle Component Analysis.<br />
Spectrum Imaging is a mapping technique where the entire EDS<br />
spectrum is saved at each pixel location <strong>and</strong> is available for processing<br />
after the run.<br />
<strong>EPMA</strong> Overview 37<br />
Lunar Meteorite SaU 169 BSE Mosaic<br />
<strong>EPMA</strong> Overview 38<br />
19
Lunar Meteorite SaU 169 SDD X-ray Maps<br />
BSE Mg Ca<br />
Fe Al Si<br />
<strong>EPMA</strong> Overview 39<br />
Mean Atomic Number <strong>of</strong> Minerals<br />
<br />
<br />
<br />
<br />
<br />
<br />
<br />
<br />
Mean Z can be easily calculated (CalcZAF, for example)<br />
Typical range is ~ 10 – 20. Atomic number correction is limited if<br />
appropriate st<strong>and</strong>ards are used.<br />
Silicates<br />
Forsterite 10.6 Albite 10.7 Pyrope 10.7<br />
Fayalite 18.7 Anorthite 11.9 Alm<strong>and</strong>ine 15.6<br />
Oxides<br />
Periclase 10.4 Spinel 10.6 Quartz 10.8<br />
Ilmenite 19.0 Ulvospinel 20.0 Magnetite 21.0<br />
Sulfides<br />
Pyrite 20.7 Chalcocite 26.4 Galena 73.2<br />
Carbonates<br />
Dolomite 8.9 Calcite 12.4 Siderite 16.5 Cerussite 65.3<br />
Misc<br />
Apatite 14.1 Allanite 22.0 Zircon 24.8 Monazite 38.7<br />
See SJB Reed <strong>Electron</strong> Microprobe Analysis <strong>and</strong> Scanning <strong>Electron</strong><br />
Microscopy in Geology ISBN 0521483506 (paperback)<br />
<strong>EPMA</strong> Overview 40<br />
20
Backscattered <strong>Electron</strong>s: Energy Distribution<br />
Number <strong>of</strong> BSEs as a function <strong>of</strong><br />
energy relative to accelerating<br />
potential E o<br />
Total number <strong>of</strong> BSEs is integral<br />
η(Ε/Ε 0 )<br />
High Z materials have many BSEs with<br />
narrower range <strong>of</strong> energies <strong>and</strong><br />
peak at high E/E o<br />
Gold Z=79 for example<br />
Important for Z correction as BSEs add<br />
to x-ray generation<br />
Low Z materials have few BSEs with<br />
wide range <strong>of</strong> energies <strong>and</strong><br />
peak at low E/E o<br />
Carbon Z=6 for example<br />
Not so important for BSE portion <strong>of</strong><br />
Z correction<br />
<strong>EPMA</strong> Overview 41<br />
Backscattered <strong>Electron</strong>s: <strong>Summary</strong><br />
<br />
<br />
<br />
<br />
<br />
<br />
<br />
Origin: Beam electrons elastically scattered many times<br />
Abundance: large, 5%(C) - 50%(Au) <strong>of</strong> beam current<br />
Information carried: number sensitive to composition; number <strong>and</strong><br />
trajectories sensitive to topography<br />
Information Depth: 0.15 (Au) to 0.3 (C) D/R K-O for 90% BSE<br />
Lateral resolution: 0.2 (Au) to 0.5 (C) R/R K-O for 90% BSE<br />
Energy: variable, 0 to beam energy; for Z > 20, more than 50% <strong>of</strong> BSEs<br />
escape with more than half <strong>of</strong> beam energy; high Z elements scatter<br />
more high energy BSEs<br />
BSEs have sufficient energy to directly excite SEM detectors<br />
<strong>EPMA</strong> Overview 42<br />
21
Probabilities <strong>of</strong> Scattering Events<br />
BSE The probability <strong>of</strong> a BSE or<br />
SE scattering event is 5-6<br />
SE<br />
orders <strong>of</strong> magnitude greater<br />
than for an x-ray scattering<br />
event, i.e. 1 x-ray per 10 6<br />
X-rayelectrons!<br />
This is the reason that x-ray<br />
count rates are so much lower<br />
than electron “count rates”<br />
<strong>EPMA</strong> Overview 43<br />
The Physics Underlying the Spectrometries<br />
Beam electron<br />
E<br />
Incident Primary <strong>Electron</strong>, E<br />
Shell-to-shell transition<br />
Transition <strong>of</strong> Outer Shell <strong>Electron</strong><br />
Atomic electrons<br />
Shell binding energy, E c<br />
Beam electron<br />
E - E c<br />
Scattered Primary <strong>Electron</strong>, E - E c<br />
Ejected Orbital <strong>Electron</strong><br />
Ejected atomic electron<br />
Auger electron<br />
emission<br />
Auger Emission<br />
Fluorescence yield, ω<br />
Characteristic X-ray Emissio n<br />
Characteristic<br />
X-ray emission<br />
E ν = E K -E L<br />
<strong>EPMA</strong> Overview 44<br />
22
Families <strong>of</strong> X-rays<br />
X-ray Spectra<br />
Many ionization<br />
vacancy-filling<br />
possibilities from<br />
complex atoms lead to<br />
creation <strong>of</strong> families <strong>of</strong><br />
X-ray lines, e.g.,<br />
Kα-Kβ<br />
Lα-Lβ-Lγ-Lη-Ll<br />
Mα-Mβ-Mγ-Mζ-M II N IV<br />
<strong>EPMA</strong> Overview 45<br />
K-Family X-ray Spectra (EDS)<br />
<strong>EPMA</strong> Overview E 0 = 15 keV<br />
46<br />
23
L-Family X-ray Spectra (EDS)<br />
<strong>EPMA</strong> Overview E 0 = 15 keV<br />
47<br />
M-Family X-ray Spectra (EDS)<br />
<strong>EPMA</strong> Overview E 0 = 15 keV<br />
48<br />
24
Uranium M-Family X-ray Spectrum (EDS)<br />
<strong>EPMA</strong> Overview E 0 = 15 keV<br />
49<br />
Characteristic X-ray Energy vs. Z<br />
15 keV<br />
X-ray peak energy solid lines<br />
Excitation energy dashed lines<br />
At 15 keV at least one line can be excited for all Z<br />
<strong>EPMA</strong> Overview 50<br />
25
Fluorescence Yield ω vs. Z<br />
ω = fraction <strong>of</strong> ionizations resulting in characteristic x-<br />
ray emission relative to total number <strong>of</strong> ionizations, <strong>and</strong><br />
1-ω is the fraction <strong>of</strong> auger electrons.<br />
<strong>EPMA</strong> Overview 51<br />
X-ray Ionization Cross Section Q<br />
The ionization cross-section Q is the probability <strong>of</strong> generating<br />
an x-ray <strong>of</strong> a specific energy for a specific atom,<br />
e.g., Cu Kα from a Cu atom.<br />
Q has units <strong>of</strong> area, larger Q is a larger area<br />
presented to an electron (or fluorescing x-ray).<br />
Q is a function <strong>of</strong> overvoltage, U = E o / E c for an x-ray line.<br />
At 20 keV, typical values <strong>of</strong> U:<br />
C Kα, U = 20 / .2838 = 70.5<br />
Si Kα, U = 20 / 1.838 = 10.88<br />
Ni Kα, U = 20 / 8.332 = 2.4<br />
Au Lα, U = 20 / 11.918 = 1.67<br />
From U considerations alone one would use the highest<br />
possible U to generate x-rays for measurement.<br />
But x-ray absorption increases with U <strong>and</strong> limits emission.<br />
We measure the emitted x-rays, not the generated x-rays<br />
<strong>EPMA</strong> Overview 52<br />
26
Ionization Cross Section: Bethe Form<br />
Q = 6.51x10 -20 n s b s ln(c s E/E c ) /(E E c )<br />
Units: ionizations / e - / (atom/cm 2 )<br />
E beam electron energy (keV)<br />
E c critical excitation (binding) energy (keV)<br />
n s number <strong>of</strong> electrons in shell or subshell<br />
b s , c s constants for the shell or subshell<br />
Q = 6.51x10 -20 n s b s ln(c s U) / (UE c2 )<br />
U = E/E c overvoltage<br />
Plot QE c2 vs U<br />
<strong>EPMA</strong> Overview 53<br />
Plot <strong>of</strong> Ionization Cross Section QE 2 vs. Overvoltage<br />
QE 2 (x10 -20 , cm 2 -keV 2 )<br />
U range 2-10 typical<br />
@ 20 keV:<br />
C Kα, U = 20 / .2838 = 70.5<br />
Si Kα, U = 20 / 1.838 = 10.9<br />
Ni Kα, U = 20 / 8.332 = 2.4<br />
Au Lα, U = 20 / 11.918 = 1.67<br />
<strong>EPMA</strong> Rule:<br />
Avoid using overvoltage <strong>of</strong> less than 1.5 due to uncertainty in<br />
the accuracy <strong>of</strong> Q in this region.<br />
Q is zero at U = 1 where E o = E c<br />
Overvoltage, U<br />
<strong>EPMA</strong> Overview 54<br />
27
Cross Section for Inner Shell Ionization<br />
2<br />
-keV<br />
2<br />
)<br />
Ionization Cross Section (cm<br />
Ionization Cross Sections<br />
4 10 -20<br />
Green-Cosslett<br />
Mott-Massey<br />
Powell (1996)<br />
3 10 -20<br />
2 10 -20<br />
1 10 -20<br />
0<br />
5 10 -20 0 2 4 6 8 10<br />
Note the large disagreement between<br />
algorithms for Q at low U<br />
Overvoltage (U = E/E<br />
c )<br />
Powell, C.J., Rev. Mod. Phys. 48 (1976) 33; (1996)<br />
<strong>EPMA</strong> Overview 55<br />
K Shell Fluorescence Yield<br />
0.6<br />
I x ~ Q * ω<br />
Generated x-ray 0.5 intensity is proportional<br />
to the product <strong>of</strong> Q <strong>and</strong> ω<br />
0.4<br />
K shell Fluorescence Yield<br />
ω<br />
0.3<br />
0.2<br />
0.1<br />
0<br />
0 5 10 15 20 25 30 35 40<br />
Atomic number<br />
<strong>EPMA</strong> Overview 56<br />
28
Continuum (Bremsstrahlung) X-rays<br />
<br />
<br />
<br />
<br />
<br />
<br />
Bremsstrahlung means “braking radiation”.<br />
Primary beam electrons are decelerated by the repulsive electric<br />
field <strong>of</strong> electrons surrounding an atom.<br />
X-rays are emitted during this deceleration. The energy <strong>of</strong> a<br />
given x-ray depends on the degree <strong>of</strong> slowing down <strong>and</strong> is<br />
continuous in this respect.<br />
Continuum x-rays can be produced by any atom <strong>and</strong> are<br />
therefore not uniquely produced by a given element in the way<br />
that characteristic x-rays are.<br />
Continuum x-rays range in energy from essentially zero up to<br />
the nominal beam energy.<br />
The high energy cut<strong>of</strong>f <strong>of</strong> the EDS spectrum is known as the<br />
“Duane-Hunt Limit”.<br />
<strong>EPMA</strong> Overview 57<br />
Continuum X-rays<br />
Many different electron-specimen interactions can result in<br />
continuum x-ray emission. A 15 KeV beam electron could:<br />
(1) Slow down to zero velocity <strong>and</strong> energy — in one step<br />
<strong>and</strong> emit a 15 keV continuum x-ray.<br />
(2) Generate a Cu Kα x-ray <strong>and</strong> a 6.02 keV continuum x-ray:<br />
(E = 15 keV – 8.98 keV = 6.02 keV). And so on...<br />
Since any material can generate the full range <strong>of</strong> continuum x-<br />
ray energies, they are not diagnostic like characteristic x-rays.<br />
Higher background from high Z materials (Au vs. Si).<br />
The background or continuum must be subtracted from the peak<br />
intensity to perform quantitative analysis.<br />
In EDS spectra there may be a significant contribution <strong>of</strong><br />
continuum beneath a peak.<br />
<strong>EPMA</strong> Overview 58<br />
29
Schematic Energy-Dispersive Spectrum<br />
Continuum intensity increases at<br />
lower energies, but due to absorption<br />
we do not see these x-rays emitted<br />
X-ray Bremsstrahlung<br />
I B ~ Z i b (E 0 - E ν )/E ν<br />
Z = atomic number<br />
i b<br />
= beam current<br />
E 0<br />
= beam energy<br />
E ν<br />
= photon energy<br />
<strong>EPMA</strong> Overview 59<br />
NIST SRM 482 Cu 40 Au 60 Alloy<br />
Characteristic peaks for Cu L <strong>and</strong> K families,<br />
<strong>and</strong> Au M <strong>and</strong> L families<br />
Continuum is broad background upon which<br />
the characteristic peaks are superimposed<br />
<strong>EPMA</strong> Overview 60<br />
30
Duane – Hunt Limit:<br />
Detction <strong>of</strong> Charging <strong>and</strong> E o Measurement<br />
<br />
<br />
<br />
<br />
<br />
<br />
The DH limit is conveniently measured by EDS if the acquired<br />
upper energy limit exceeds the accelerating potential (as it<br />
should, i.e., use 0-20keV range for 15 keV accelerating potential).<br />
The DH limit is sensitive to sample charging <strong>and</strong> is an indicator <strong>of</strong><br />
problems with sample conductivity.<br />
Sample charge buildup decelerates incoming electrons, so a<br />
continuum x-ray produced will register with E < E o . Typically<br />
charging reduces the DH limit by several 10s-100s eV.<br />
The DH limit is the observed E o for a sample <strong>and</strong> is therefore a<br />
variable if charging exists.<br />
Pulse pileup causes x-rays to be recorded at an energy higher<br />
than actual, so be careful in interpreting the DH limit.<br />
For SDD EDS systems being run at high throughput in mapping<br />
mode, there can be significant pulse pileup at E o .<br />
<strong>EPMA</strong> Overview 61<br />
DH Limit <strong>of</strong> X-ray Bremsstrahlung (Continuum)<br />
Carbon (bulk) E 0 =15keV<br />
Use Log scale to see the DH limit<br />
Not linear scale<br />
Duane-Hunt Limit:<br />
Charging shifts the DH<br />
limit to lower E<br />
E ν = E 0<br />
<strong>EPMA</strong> Overview 62<br />
31
Range <strong>of</strong> Characteristic X-ray Production<br />
X-ray generation range in Al-Cu alloys<br />
Al-rich AlCu alloy<br />
Density 3 g/cm 2<br />
Cu-rich AlCu alloy<br />
Density 10 g/cm 2<br />
The depth distribution <strong>of</strong> primary x-ray generation<br />
is dependent on the sample composition!<br />
<strong>EPMA</strong> Overview 63<br />
Casino MC Simulation <strong>of</strong> Φ(ρz) Experiment<br />
Ni overlayer 25nm<br />
Cu layer 25nm<br />
Ni matrix<br />
<strong>EPMA</strong> Overview 64<br />
Depth ρz<br />
0.0<br />
0 100 200 300 400 500 600<br />
0.2<br />
0.4<br />
0.6<br />
Φ(ρz)<br />
0.8<br />
1.0<br />
1.2<br />
1.4<br />
1.6<br />
1.8<br />
Generated Φ(ρz)<br />
for Cu layer<br />
Generated Φ(ρz)<br />
for Ni overlayer<br />
<strong>and</strong> matrix<br />
The Φ(ρz) distribution for Cu Kα is obtained from the emitted intensity <strong>of</strong> a layer <strong>of</strong> Cu<br />
s<strong>and</strong>wiched in a matrix with similar Z (Ni) so that scattering properties are similar.<br />
Measurements are made for progressively buried layers.<br />
This intensity is scaled relative to that from an isolated Cu foil to yield the Φ(ρz) curve.<br />
The curves are then generalized to model x-ray behavior for elements in general.<br />
2.0<br />
32
X-ray absorption depends on path length <strong>and</strong> µ/ρ<br />
I / I 0 = exp[ -(µ/ρ) ρs]<br />
I<br />
I 0<br />
I 1 < I 2 due to s 1 > s 2 I 2<br />
s<br />
I 1 = emitted x-rays<br />
µ/ρ<br />
X-ray absorption here is photoelectric,<br />
which is an either/or operation.<br />
Either the photon is absorbed, or it<br />
s 1<br />
s 2<br />
escapes the specimen with the<br />
same characteristic energy with<br />
which it started.<br />
I 0 = generated x-rays<br />
For a given take<strong>of</strong>f angle, the x-ray<br />
absorption is determined by the path<br />
length s <strong>and</strong> mass absorption<br />
coefficent µ/ρ, which are both<br />
compositionally dependent.<br />
<strong>EPMA</strong> Overview 65<br />
Effect <strong>of</strong> X-ray Absorption: Trace Al in Cu @ 20 keV<br />
Al is strongly absorbed by Cu (µ/ρ<br />
Al Kα by Cu = 4764).<br />
What is f(χ)?<br />
f(χ) = emitted / generated intensity<br />
f(χ) = I emitted / I generated = ~0.5<br />
Rule <strong>of</strong> <strong>EPMA</strong>: f(χ) > 0.75<br />
i.e.,
Casino Φ(ρz) Curves Calculated for Fe 3 C<br />
Fe Kα<br />
C Kα<br />
Fe Lα<br />
Casino Monte Carlo calculated Φ(ρz) curves<br />
Generated x-ray distribution in blue, Emitted x-ray distribution in red<br />
These intensities can be used to calculate k-ratios <strong>and</strong> compared with k-ratios<br />
from experimental <strong>and</strong> Φ(ρz) algorithms<br />
<strong>EPMA</strong> Overview 67<br />
Wavelength-Dispersive Spectrometry<br />
<strong>EPMA</strong> Overview 68<br />
34
Wavelength-Dispersive Spectrometry (WDS)<br />
<strong>Summary</strong><br />
X-ray measurement by Bragg diffraction using crystals <strong>of</strong><br />
known d-spacing, counted by gas ionization in x-ray<br />
detector<br />
Superior resolution (~10eV) <strong>and</strong> P/B (~1000) result in<br />
excellent ability to resolve interferences, make precise<br />
measurements at concentrations down to 100-1000 ppm*<br />
Peak shape <strong>and</strong> shift observed for low energy x-rays<br />
Serial acquisition mode, complemented by EDS+SDD<br />
Mechanical alignment <strong>and</strong> reproducibility issues,<br />
temperature dependence <strong>of</strong> d-spacing (PET)<br />
<strong>EPMA</strong> Overview 69<br />
WDS Spectrometry: Advances<br />
Spectrometer mechanisms established for decades,<br />
counting electronics simple compared to EDS/SDD<br />
Reliance on sealed <strong>and</strong> flow proportional counters<br />
Exciting possibilities with SDD detector element for high<br />
throughput pulse processing<br />
Layered dispersive crystals enhance light element<br />
capabilities for Be, B, C, N, O, F<br />
Specialized H-type <strong>and</strong> large crystal spectrometers for high<br />
sensitivity<br />
S<strong>of</strong>tware: peak overlap correction, multiple spectrometer<br />
measurement (trace elements), multiple st<strong>and</strong>ards,<br />
multiple kV/probe current configurations<br />
CL systems<br />
Compositional mapping via beam, stage, mosaic imaging<br />
<strong>EPMA</strong> Overview 70<br />
35
WDS Checklist for Analysts: Measurement<br />
Microprobe stabilized? Vacuum, column alignment,<br />
gun/beam, sample, etc.<br />
Spectrometers aligned, deadtime calibrated, PHA set for<br />
elements to be analyzed, esp. for light elements<br />
Wavelength scans on st<strong>and</strong>ards <strong>and</strong> unknowns including<br />
high <strong>and</strong> low concentrations, interfering elements<br />
Background selection: Use full width from high conc.<br />
st<strong>and</strong>ard, otherwise overestimating background<br />
Avoid large differences in count rate <strong>and</strong> reliance on<br />
deadtime correction<br />
Peak shape <strong>and</strong> shift, st<strong>and</strong>ard vs. samples, use correct<br />
position for measurements if different on std vs. sample<br />
Beam sensitive materials: defocus, correct for timedependent<br />
behavior <strong>of</strong> st<strong>and</strong>ard <strong>and</strong> sample<br />
<strong>EPMA</strong> Overview 71<br />
WDS Checklist for Analysts: Analysis<br />
<br />
<br />
<br />
<br />
<br />
<br />
<br />
Intelligently choose primary <strong>and</strong> secondary st<strong>and</strong>ards:<br />
Spectrometer setup vs. perform accurate microanalysis<br />
Consult µ/ρ data <strong>and</strong> be wary <strong>of</strong> high absorption correction<br />
Adjust kV accordingly, use alternate analytical line<br />
High absorption dictates st<strong>and</strong>ard selection, esp. light elements<br />
Use highest practical energy x-ray line:<br />
Fewer peak interferences <strong>and</strong> absorption correction is smaller<br />
K in preference to L (use K up to ~Se)<br />
L in preference to M (use L up to ~Bi)<br />
<strong>EPMA</strong> is surface analysis, emphasis on cleanliness <strong>and</strong> C-coat thickness<br />
Correction algorithms:<br />
Φ(ρz) superior to ZAF<br />
Assess accuracy by reference to different algorithms <strong>and</strong> µ/ρ sets<br />
Always using one Φ(ρz) <strong>and</strong> µ/ρ set will someday result in mistake<br />
Employ s<strong>of</strong>tware tools to underst<strong>and</strong> analytical problem:<br />
Monte Carlo/simulation: Scattering volume, spatial constraints<br />
CalcZAF: Correction algorithms, nature <strong>of</strong> analytical constraints<br />
Is the sample presented consistent with what you observe?<br />
Multilayer, particles, misidentified materials, etc.<br />
<strong>EPMA</strong> Overview 72<br />
36
WDS Anatomy<br />
An electron microprobe typically has up to 5<br />
spectrometers each with 1-4 diffracting crystals.<br />
The crystal <strong>and</strong> detector are moved synchronously via<br />
the drive motor. Position here is high theta, low E.<br />
Spectrometer drive motor<br />
w/ vacuum feedthrough<br />
Crystal<br />
movement<br />
Crystals w/ flipping motor<br />
Mechanical alignment track<br />
Proportional X-ray counter<br />
<strong>EPMA</strong> Overview 73<br />
WDS Spectrometer<br />
<strong>EPMA</strong> Overview 74<br />
37
<strong>Electron</strong> Microprobe Column<br />
Spectrometer Alignment: Baseplate <strong>and</strong> Crystal<br />
Baseplate: Place Rowl<strong>and</strong> circle at Z focus<br />
Crystal: Align all crystals on Rowl<strong>and</strong> circle<br />
Spectrometer design keeps detector on RC<br />
Note: Different K-ratio = misalignment<br />
Multiple spectrometer comparison required<br />
to demonstrate all WDS <strong>and</strong> EDS are<br />
mutually aligned<br />
<strong>EPMA</strong> Overview 75<br />
WDS Spectrometer Units<br />
Bragg diffraction equation<br />
including index <strong>of</strong> refraction term:<br />
nλ = 2d sinθ (1-k/n 2 )<br />
n = diffraction order, λ = wavelength<br />
d = d-spacing <strong>of</strong> analyzing crystal<br />
θ = diffraction angle, k = refraction factor<br />
Cameca: sinθ = nλ (1 – k / n 2 ) / 2d<br />
For JEOL instruments:<br />
nλ/2d = sinθ = L/2R where R is rowl<strong>and</strong> radius<br />
L = (R/d) nλ, L value in mm<br />
JEOL: L = (R / d) nλ (1 – k / n 2 )<br />
12.3985<br />
E =<br />
(keV)<br />
λ ( Angstroms)<br />
<strong>EPMA</strong> Overview 76<br />
38
Diffracting Crystal Element Ranges<br />
<strong>EPMA</strong> Overview 77<br />
LDE Diffracting Crystal Element Ranges<br />
<strong>EPMA</strong> Overview 78<br />
39
L-Value X-ray Peak Positions for JEOL Microprobe<br />
<strong>EPMA</strong> Overview 79<br />
WDS <strong>and</strong> EDS Comparison: Kakanui Hornblende<br />
WDS TAP GFC, SiLi EDS, Energy Scale<br />
Intensity: WDS 10 sec/.01 mm = ~19K sec<br />
EDS 1000 sec<br />
10000000<br />
1000000<br />
100000<br />
10000<br />
1000<br />
100<br />
O<br />
0.50<br />
0.60<br />
Kakanui Hornblende WDS<br />
Kakanui Hornblende EDS<br />
Fe<br />
0.70<br />
0.80<br />
0.90<br />
1.00<br />
Na<br />
1.10<br />
1.20<br />
Mg<br />
1.30<br />
Energy, keV<br />
<strong>EPMA</strong> Overview 80<br />
1.40<br />
Al<br />
1.50<br />
1.60<br />
1.70<br />
Si<br />
1.80<br />
1.90<br />
2.00<br />
100000<br />
10000<br />
1000<br />
100<br />
40
WDS Wavelength Scan<br />
TAP Spec 2 25 KV 300 nA 70 - 266 mm 10 sec per point 0.1 / .09 mm step<br />
WDS Scan TAP Kakanui Hornblende<br />
Counts per 10<br />
10000000<br />
1000000<br />
100000<br />
10000<br />
1000<br />
WDS Spectra show high order reflections (II, III, etc.)<br />
Si Kα <strong>and</strong> detailed presence <strong>of</strong> x-ray lines not resolved by EDS<br />
WDS Scans must be used for peak overlap <strong>and</strong> background evaluation<br />
Al Kα<br />
Mg Kα<br />
Si Kα ΙΙ<br />
Al Kα ΙΙ<br />
Na Kα<br />
Mg Kα ΙΙ<br />
Si Kα ΙΙΙ<br />
Fe Lα,β<br />
O Kα<br />
100<br />
70<br />
80<br />
90<br />
100<br />
110<br />
120<br />
130<br />
140<br />
150<br />
160<br />
170<br />
180<br />
190<br />
200<br />
210<br />
220<br />
230<br />
240<br />
250<br />
260<br />
Spectrometer position, mm<br />
<strong>EPMA</strong> Overview 81<br />
WDS Detector: Ar Ionization Counter<br />
Ar ionization energy 27 eV<br />
The number <strong>of</strong> ionizations is: n = Photon energy / 27 eV<br />
Compare with Si EDS 3.8 eV detection process, factor <strong>of</strong> 7<br />
Photon<br />
Energy<br />
eV<br />
Ar+ per<br />
photon<br />
Be Kα<br />
Mg Kα<br />
Fe Kα<br />
Ge Kα<br />
Zr Kα<br />
110<br />
1254<br />
6403<br />
9885<br />
15774<br />
4<br />
46<br />
237<br />
366<br />
584<br />
These low signals are then amplified by the counter which<br />
is operated in the proportional mode, with 10 2 – 10 5 amplification<br />
<strong>EPMA</strong> Overview 82<br />
41
100<br />
CSi<br />
B<br />
Fe Fe Fe<br />
80<br />
100<br />
Normalized Xṟay Intensity N<br />
Si (WDS)<br />
W (EDS)<br />
Energy Resolution EDS vs. WDS<br />
<strong>EPMA</strong> Overview STE(WDS)<br />
TAP(WDS)<br />
83<br />
PET(WDS)<br />
LIF(WDS) Si P<br />
Na<br />
Ca<br />
20<br />
(keV)FWHM (keV)FWHM (keV)FWHM (keV)<br />
60<br />
10<br />
Fe Ni<br />
40<br />
WDS Exhibits Superior Peak Resolution, P/B,<br />
Precision for Typical Systems<br />
0.002.00<br />
2.004.00<br />
4.006.00<br />
6.008.00<br />
8.0010.0<br />
EDS<br />
X-ray Energy (keV)<br />
Si 1<br />
1.60 1.70 1.80 1.90 2.00<br />
Energy (keV) 0<br />
McSwiggen<br />
<strong>EPMA</strong> Overview 84<br />
42
Ti Kβ<br />
Ce Lα<br />
Cs Lβ3<br />
La Lα<br />
Cs Lβ1<br />
Ti Kα<br />
Ba Lα<br />
Zn Kα II<br />
Cs Lα<br />
Ni Kβ II<br />
WDS Spectrum Simulation<br />
Cameca, M&M 2001<br />
<strong>EPMA</strong> Overview 85<br />
WDS Scan: LiF on JEOL 733 w/ sealed Xe counter<br />
Corning 95IR trace element glasses (~0.79 wt% oxide)<br />
Counts<br />
LiF crystal preferred for trace element <strong>EPMA</strong>: P/B <strong>and</strong> resolution<br />
Note: 2 nd order peaks from ~5000ppm elements, Xe edge<br />
Interferences Ti Kβ Corning – V Kα, 95IRV, Ba Lβ1 95IRW, – Ce Lα, <strong>and</strong> La 95IRX Lα – Cs Lβ1 (unresolved, 95IRW)<br />
Ti Kα – Ba Lα, Zn Kα II – LIF<br />
Cs 170<br />
Lα<br />
- 210 mm<br />
2500<br />
2250<br />
2000<br />
1750<br />
1500<br />
1250<br />
1000<br />
La Lβ1 V Kα<br />
Xe Abs L III<br />
95IRV<br />
95IRW<br />
95IRX<br />
Superimposed WDS scans<br />
95IRV, 95IRW, <strong>and</strong> 95IRX<br />
Zn Kβ II Ba Lβ1<br />
750<br />
500<br />
250<br />
0<br />
170 175 180 185 190 195 200 205 210<br />
Spectrometer Position, mm<br />
<strong>EPMA</strong> Overview 86<br />
43
WDS Scan: PET on JEOL 733<br />
Corning 95IR trace element glasses (~0.79 wt% oxide)<br />
PET not preferred for trace element <strong>EPMA</strong> (if LiF applicable)<br />
Interferences V Kβ – Corning Cr Kα, Ti 95IRV, Kβ – 95IRW, V Kα, <strong>and</strong> Ba 95IRX Lβ1 – Ce Lα, La Lα –<br />
Cs Lβ1 (unresolved, 95IRW) PET Ti Kα 70 – - 90 Ba mm Lα<br />
Counts per sec<br />
2000<br />
1800<br />
1600<br />
1400<br />
1200<br />
1000<br />
800<br />
600<br />
400<br />
200<br />
0<br />
Ba Lγ<br />
Cs Lγ2<br />
Cr Kα 1,2<br />
Ce Lβ1<br />
V Kβ<br />
Ce Lβ3<br />
Ce Lβ4<br />
Cs Lγ<br />
Ba Lβ2<br />
La Lβ3<br />
La Lβ4<br />
La Lβ1<br />
V Kα 1,2<br />
70 71 72 73 74 75 76 77 78 79 80 81 82 83 84 85 86 87 88 89 90<br />
Spec pos mm<br />
95IRV<br />
95IRW<br />
95IRX<br />
<strong>EPMA</strong> Overview 87<br />
Ti Kβ<br />
Cs Lβ2<br />
Ba Lβ4<br />
Ce Lα<br />
Ba Lβ4<br />
Ba Lβ1<br />
Cs Lβ3<br />
La Lα<br />
Cs Lβ4<br />
Cs Lβ1<br />
Ti Kα 1,2<br />
Ba Lα<br />
Comparison <strong>of</strong> C Kα Full Peak on Graphite w Fe 3 C<br />
1000000<br />
100000<br />
Carbon in Steel: LDE2 Wavelength Scans 10 KV<br />
Graphite<br />
Fe3C C Ka<br />
10000<br />
1000<br />
100<br />
85<br />
90<br />
95<br />
100<br />
105<br />
110<br />
115<br />
120<br />
125<br />
130<br />
135<br />
140<br />
145<br />
150<br />
155<br />
160<br />
165<br />
Position, mm LDE2<br />
<strong>EPMA</strong> Overview 88<br />
44
Experimental WDS Scans Carbon in Steel<br />
LDE2: No Reflections > 2 nd order<br />
Counts<br />
2000<br />
1000<br />
Fe Lα II<br />
Carbon in Steel: LDE2 Wavelength Scans 10 KV<br />
Fe Ll, Lη II<br />
C Kα<br />
Fe3C C Ka<br />
1.29 % C<br />
1.01% C<br />
0.62% C<br />
1080 Steel<br />
0.308% C<br />
0.63% C NiFe<br />
Fe metal<br />
Fe Lα III<br />
Ni Lα III<br />
0<br />
95 100 105 110 115 120 125 130 135 140 145 150 155 160<br />
Position, mm LDE2<br />
<strong>EPMA</strong> Overview 89<br />
Beam Sensitive Materials<br />
Is the sample or st<strong>and</strong>ard stable under the electron beam? At the<br />
probe current proposed for measurement?<br />
Reduce the probe current, at constant beam diameter, to reduce<br />
beam damage. Voltage is not an issue for SEM/<strong>EPMA</strong>.<br />
Defocusing the beam reduces the electron dose per unit area, <strong>and</strong><br />
is the most effective means <strong>of</strong> reducing damage.<br />
Determine stability by performing “time scan”, measuring the count<br />
rate as a function <strong>of</strong> time; the count rate should not go up or down.<br />
Recheck sample charging.<br />
Alternatively, perform replicate analyses on the same spot. If<br />
subsequent analyses duplicate the first, either no damage has<br />
occurred or it all occurred in the first analysis.<br />
After completion <strong>of</strong> the analysis, inspect the analysis point using<br />
secondary <strong>and</strong> backscattered-electron imaging. There should be<br />
no detectable damage or burn mark.<br />
<strong>EPMA</strong> Overview 90<br />
45
Beam-sensitive Materials:<br />
Time-dependent X-ray Count Rate<br />
Normalized X-ray Intensity vs. Time (2000 sec FS)<br />
Intensity Relative to Maximum<br />
1.00<br />
0.95<br />
0.90<br />
0.85<br />
0.80<br />
0.75<br />
0.70<br />
0.65<br />
K, 50 um<br />
K, 20 um<br />
K, 10 um<br />
K, 5 um<br />
95IRV: K<br />
Corning Glass 95IRV, K intensity<br />
20 KeV, 100 nA, 20 sec count interval, PETH spectrometer<br />
Effect <strong>of</strong> beam diameter<br />
5 µm<br />
0 180 360 540 720 900 1080 1260 1440 1620 1800 1980<br />
Time, seconds<br />
Time, seconds (2000 sec FS)<br />
10 µm<br />
Calculated ∆T for i, d<br />
100 nA<br />
250 nA<br />
1<br />
96 K<br />
240<br />
Diameter, µm<br />
5<br />
19<br />
48<br />
10<br />
10<br />
24<br />
20<br />
5<br />
12<br />
100<br />
1<br />
2.4<br />
∆T (degrees K) from Castaing equation:<br />
∆T = 4.8 E o<br />
i / λ d<br />
E o<br />
beam voltage keV<br />
i probe current uA<br />
λ thermal conductivity W/cm deg K<br />
d beam diameter in µm<br />
<strong>EPMA</strong> Overview 91<br />
Accuracy, WDS vs. EDS<br />
WDS Alignment Verification<br />
46
CMASTF Silicate St<strong>and</strong>ards<br />
Geological materials are multicomponent<br />
<br />
<br />
<br />
<br />
End-member stoichiometric silicate <strong>and</strong> oxide mineral st<strong>and</strong>ards<br />
Primary st<strong>and</strong>ards:<br />
MgO, Al 2 O 3 , SiO 2 , CaSiO 3 , TiO 2 , <strong>and</strong> Fe 2 O 3<br />
Analyzed suite <strong>of</strong> stoichiometric st<strong>and</strong>ards, natural <strong>and</strong> synthetic<br />
materials:<br />
Second set <strong>of</strong> primary st<strong>and</strong>ards on different mounts<br />
Spinel MgAl 2 O4, Enstatite MgSiO 3 , Forsterite Mg 2 SiO 4<br />
Kyanite Al 2 SiO 5<br />
Fayalite Fe 2 SiO 4<br />
Well characterized natural mineral st<strong>and</strong>ards <strong>and</strong> glasses:<br />
Olivines (Mg,Fe) 2 SiO 4<br />
Diopside CaMgSi 2 O 6 , Anorthite CaAl 2 Si 2 O 8 , Sphene CaTiSiO 5<br />
Ilmenite FeTiO 3<br />
Synthetic glasses in CMAS <strong>and</strong> CMASF system:<br />
Weill CMAS glasses, NBS K411, K412<br />
<strong>EPMA</strong> Overview 93<br />
CMASTF Stds: Natural & Synthetic Minerals<br />
Composition in Wt% Oxide<br />
St<strong>and</strong>ard<br />
Alaska Anorthite<br />
Boyd Olivine<br />
Ilmen Mtns Ilmenite<br />
K411 Glass<br />
K412 Glass<br />
Kyanite P236<br />
Natural Bridge Diopside<br />
ORNL, RDS Fayalite<br />
San Carlos Olivine<br />
Shankl<strong>and</strong> Forsterite<br />
Springwater Olivine<br />
Taylor Kyanite<br />
Taylor Olivine<br />
Taylor Sphene<br />
Taylor Spinel<br />
Weill A<br />
Weill B<br />
Weill D<br />
Weill E*<br />
Weill Enstatite Glass<br />
Weill F<br />
Weill G<br />
Weill H<br />
Weill I<br />
Weill J<br />
MgO<br />
51.63<br />
0.31<br />
14.67<br />
19.33<br />
18.31<br />
49.42<br />
57.30<br />
43.58<br />
0.00<br />
50.78<br />
28.34<br />
11.05<br />
13.99<br />
17.97<br />
6.00<br />
40.15<br />
10.07<br />
32.69<br />
5.22<br />
19.03<br />
1.01<br />
Al2O3<br />
36.03<br />
0.10<br />
9.27<br />
62.91<br />
0.06<br />
62.70<br />
1.36<br />
71.66<br />
16.07<br />
16.05<br />
20.96<br />
8.99<br />
0.00<br />
30.93<br />
3.31<br />
41.90<br />
2.01<br />
19.02<br />
SiO2<br />
44.00<br />
40.85<br />
54.30<br />
45.35<br />
37.09<br />
55.40<br />
29.49<br />
40.81<br />
42.70<br />
38.95<br />
37.00<br />
41.15<br />
30.83<br />
49.72<br />
48.99<br />
45.07<br />
79.97<br />
59.85<br />
52.06<br />
61.12<br />
30.91<br />
52.95<br />
42.98<br />
CaO<br />
19.09<br />
15.47<br />
15.25<br />
25.78<br />
28.82<br />
23.15<br />
20.97<br />
16.00<br />
5.04<br />
6.94<br />
2.89<br />
21.97<br />
26.01<br />
36.99<br />
TiO2<br />
45.70<br />
0.01<br />
37.80<br />
FeO* or<br />
Fe2O3<br />
0.62<br />
7.17<br />
46.54<br />
14.42<br />
9.96<br />
0.26<br />
70.51<br />
9.55<br />
16.62<br />
0.16<br />
7.62<br />
0.66<br />
<strong>EPMA</strong> Overview 94<br />
47
Pouchou Experimental Binary K-ratio Data Set (n=756)<br />
Φ(ρz) Algorithm – No silicates or multi-element<br />
materials<br />
Armstrong PRZ Heinrich 1986<br />
140<br />
Average K corr / K exp = 1.0079 +/- 0.0382 (1 σ)<br />
120<br />
100<br />
80<br />
Armstrong Φ(ρz)<br />
Heinrich 1986 macs<br />
60<br />
40<br />
20<br />
0<br />
0.80 0.85 0.90 0.95 1.00 1.05 1.10 1.15<br />
<strong>EPMA</strong> Overview 95<br />
Ag Lα NIST SRM 481 AgAu Alloy (ψ=40)<br />
C / K<br />
2.20<br />
2.00<br />
1.80<br />
1.60<br />
1.40<br />
1.20<br />
C vs. C / K plot for Ag Lα data<br />
y = mx + b<br />
α factor is b intercept<br />
slope is 1-α<br />
30 KV<br />
25 KV<br />
20 KV<br />
15 KV<br />
10 KV<br />
1.00<br />
0.0 0.2 0.4 0.6 0.8 1.0<br />
C Ag, weight fraction<br />
<strong>EPMA</strong> Overview 96<br />
48
Accuracy Study for <strong>EPMA</strong><br />
Comparison <strong>of</strong> Measured to Calculated K-ratio<br />
<br />
<br />
K measured dependent on:<br />
Accelerating Potential<br />
Probe current<br />
Detector (gas, sealed)<br />
Pulse processing<br />
PHA calibration<br />
Deadtime<br />
Spectrometer alignment<br />
Sample homogeneity<br />
P-B determination, stripping, counting<br />
statistics<br />
Other sampling/drift factors<br />
K calculated dependent on:<br />
Correct composition <strong>of</strong> st<strong>and</strong>ard<br />
Correction algorithms<br />
Data sets, mass absorption coefficients<br />
Other algorithmic factors<br />
measured<br />
C = K * ZAF<br />
calculated<br />
Evaluate :<br />
= C / ZAF<br />
measured<br />
calculated<br />
sample<br />
st<strong>and</strong>ard<br />
<strong>EPMA</strong> Overview 97<br />
K<br />
K<br />
(P − B)<br />
=<br />
(P − B)<br />
K<br />
K<br />
Historical CMAS Data<br />
Caltech MAC Probe, Circa 1980’s<br />
Shaw Data Set: Caltech MAC Probe (38.5 deg, 15 kV)<br />
Armstrong φ(ρz), FFAST macs<br />
Measured Wt% / Accepted Wt%<br />
1.10<br />
1.05<br />
1.00<br />
0.95<br />
Mg<br />
Al<br />
Si<br />
Ca<br />
0.90<br />
0 10 20 30 40 50 60 70 80 90<br />
Weight % Oxide<br />
<strong>EPMA</strong> Overview 98<br />
49
Caltech JEOL 733 1990’s<br />
Spectrometer 1 TAP for Mg Al Si (Ca PET)<br />
Shaw Data Set: Caltech Jeol 733 -- TAP1 MgAlSi PET3 Ca<br />
Armstrong φ(ρz), FFAST macs, 15 kV<br />
Measured Wt% / Accepted Wt%<br />
1.10<br />
1.05<br />
1.00<br />
0.95<br />
Mg<br />
Al<br />
Si<br />
Ca<br />
0.90<br />
0 5 10 15 20 25 30 35 40<br />
Weight % Oxide<br />
<strong>EPMA</strong> Overview 99<br />
WU JXA-8200 CMASTF Data Set<br />
All WDS Data Superimposed<br />
K meas / K calc<br />
1.20<br />
1.10<br />
1.00<br />
0.90<br />
0.80<br />
0 10 20 30 40 50 60 70 80 90 100<br />
Oxide Weight Percent<br />
Mg1 TAP<br />
Mg2 TAP<br />
Al1 TAP<br />
AL2 TAP<br />
Si1 PET<br />
Si1 TAP<br />
Si2 TAP<br />
Si3 PET<br />
Si4 PET<br />
Si5 PETH<br />
Ca1 PET<br />
Ca3 PET<br />
Ca4 PET<br />
Ca5 PETH<br />
Ca3 LIF<br />
Ca4 LIF<br />
Ca5 LIFH<br />
Ti1 PET<br />
Ti3 PET<br />
Ti4 PET<br />
Ti5 PETH<br />
Ti3 LIF<br />
Ti4 LIF<br />
Ti5 LIFH<br />
Fe3 LIF<br />
Fe4 LIF<br />
Fe5 LIFH<br />
<strong>EPMA</strong> Overview 100<br />
50
<strong>EPMA</strong>:<br />
What’s New <strong>and</strong> Important About<br />
Energy-Dispersive Spectrometry<br />
Silicon Drift EDS Detectors<br />
EDS Analyzer System<br />
<strong>EPMA</strong> Overview 102<br />
51
Conventional SiLi EDS Detector<br />
<strong>EPMA</strong> Overview 103<br />
Silicon Drift Detector<br />
Entrance window<br />
<strong>EPMA</strong> Overview 104<br />
52
Washington University<br />
<strong>Earth</strong> <strong>and</strong> <strong>Planetary</strong> <strong>Sciences</strong> JEOL JXA-8200<br />
SDD<br />
JEOL e2v Silicon Drift Detector<br />
130 eV resolution<br />
3 time constants T3 T2 T1<br />
Stage <strong>and</strong> beam mapping<br />
Quantitative EDS analysis LLSQ<br />
<strong>EPMA</strong> Overview 105<br />
JEOL 8200 Stage Maps: Lunar Meteorite SAU169<br />
WDS vs. SDD Mg @ 15KV, 120nA, 25ms dwell<br />
Mg WDS 1061 max counts, Mg SDD 527 max counts<br />
1024x1024 stage map, 8 hours<br />
<strong>EPMA</strong> Overview 106<br />
53
Lunar Meteorite SAU169<br />
Stage map 1024x1024, 25 ms, 8 hr run<br />
Backscattered electron vs. Fe SDD maps<br />
<strong>EPMA</strong> Overview 107<br />
Lunar Meteorite SAU169<br />
Stage map 1024x1024, 25 ms, 8 hr run: Ca Kα<br />
SDD<br />
<strong>EPMA</strong> Overview 108<br />
54
WU8200 JEOL SDD<br />
55<br />
Fe Source Mn Kα Resolution 130 eV<br />
Counts per 100 sec<br />
1000000<br />
100000<br />
10000<br />
1000<br />
100<br />
10<br />
1<br />
Washington University JEOL 8200<br />
SDD Mn Spectra T3 15 KeV, 100 sec<br />
55Fe Source ~255 Cps 0.27% Deadtime<br />
3 4 5 6 7 8 9 10 11 12 13 14<br />
Energy, KeV<br />
300nA T3<br />
200nA T3<br />
150nA T3<br />
100nA T3<br />
50nA T3<br />
25nA T3<br />
10nA T3<br />
Mn 55Fe<br />
140k cps<br />
125k cpx<br />
110k cps<br />
80K cps<br />
50k cps<br />
25k cps<br />
10K cps<br />
<strong>EPMA</strong> Overview 109<br />
SiLi vs. SDD Detector Efficiency<br />
Si(Li)<br />
SDD<br />
Detector Efficiency Curve 0-20 keV<br />
SiLi 100% efficiency for ~5-15 kV<br />
SDD Reduced efficiency above ~12 kV<br />
<strong>EPMA</strong> Overview Energy (keV)<br />
110<br />
55
SDD Performance with increasing Count Rate<br />
Manganese Test - 10mm2 Droplet<br />
Manganese Test - 10mm2 Droplet<br />
6<br />
150<br />
5.95<br />
1uSec<br />
2uSec<br />
4uSec<br />
8uSec<br />
145<br />
140<br />
135<br />
1uSec<br />
2uSec<br />
4uSec<br />
8uSec<br />
130<br />
eV<br />
5.9<br />
FWHM<br />
125<br />
120<br />
5.85<br />
115<br />
110<br />
105<br />
5.8<br />
0 20 40 60 80<br />
Deadtime<br />
100<br />
0 20 40 60 80<br />
Deadtime<br />
<strong>EPMA</strong> Overview 111<br />
Throughput Comparison <strong>of</strong> SDD <strong>and</strong> SiLi<br />
Detectors<br />
SDD High throughput<br />
SiLi Low throughput<br />
<strong>EPMA</strong> Overview 112<br />
56
Mapping Performance SnCuZn Alloys<br />
SiLi vs. SDD<br />
SiLi<br />
SDD<br />
<strong>EPMA</strong> Overview 113<br />
Washington University JXA-8200 SDD<br />
Corning 95IRV: K, Ti, Cr, Fe, Ce, Hf<br />
Counts<br />
1000000<br />
100000<br />
10000<br />
1000<br />
Washington University JXA-8200 SDD<br />
Corning 95-Series Trace Element Glasses @ 15 KeV, 50 nA<br />
O<br />
Mg, Al, Si<br />
Ca<br />
K<br />
Ti,<br />
Ce<br />
Cr<br />
Fe<br />
Hf<br />
95IRV, T3, 250s<br />
95IRV, T3, 5s<br />
100<br />
10<br />
1<br />
0 1 2 3 4 5 6 7 8 9 10<br />
Energy, KeV<br />
<strong>EPMA</strong> Overview 114<br />
57
Washington University JXA-8200 SDD<br />
Corning 95IRW: V, Mn, Co, Cu, Cs, Ba, La, Th<br />
Counts<br />
1000000<br />
100000<br />
10000<br />
1000<br />
Washington University JXA-8200 SDD<br />
Corning 95-Series Trace Element Glasses @ 15 KeV, 50 nA<br />
O<br />
Mg, Al, Si<br />
Th<br />
Ca<br />
Ba<br />
La<br />
V<br />
Mn<br />
Co<br />
Cu<br />
95IRW, T3, 250s<br />
95IRW, T3, 5s<br />
100<br />
10<br />
1<br />
0 1 2 3 4 5 6 7 8 9 10<br />
Energy, KeV<br />
<strong>EPMA</strong> Overview 115<br />
Washington University JEOL JXA-8200<br />
SDD Quantitative Analysis Data<br />
<br />
<br />
<br />
<br />
<br />
SDD great for mapping, what about quantitative analysis?<br />
SDD EDS data acquired at 120s, 60s, <strong>and</strong> 3s acquisitions<br />
at T3 time constant<br />
St<strong>and</strong>ards used: MgO, Al 2 O 3 , SiO 2 , CaSiO 3 , TiO 2 , <strong>and</strong><br />
Fe 2 O 3<br />
Linear least-squares peak deconvolution (JEOL s<strong>of</strong>tware)<br />
Extracted raw K-ratios processed using Armstrong Φ(ρz)<br />
<strong>and</strong> FFAST macs for comparison with WDS data<br />
<strong>EPMA</strong> Overview 116<br />
58
CMASTF St<strong>and</strong>ard Analyses<br />
WU8200 SDD LLSQ 120 sec. Acquisition T3<br />
Measured K Relative to Calculated K<br />
W U8200 SDD 120 sec Acquisition<br />
1.20<br />
1.10<br />
Mg Km/Kc<br />
Al Km/Kc<br />
Si Km/Kc<br />
Ca Km/Kc<br />
Ti Km/Kc<br />
Fe Km/Kc<br />
Km / Kc<br />
1.00<br />
0.90<br />
0.80<br />
0 10 20 30 40 50 60 70 80 90 100<br />
Weight Percent Oxide<br />
<strong>EPMA</strong> Overview 117<br />
CMASTF St<strong>and</strong>ard Analyses<br />
WU8200 SDD LLSQ 60 sec. Acquisition T3<br />
Measured K Relative to Calculated K<br />
WU8200 SDD 60 sec Acquisition<br />
1.20<br />
1.10<br />
Mg Km/Kc<br />
Al Km/Kc<br />
Si Km/Kc<br />
Ca Km/Kc<br />
Ti Km/Kc<br />
Fe Km/Kc<br />
Km / Kc<br />
1.00<br />
0.90<br />
0.80<br />
0 10 20 30 40 50 60 70 80 90 100<br />
Weight Percent Oxide<br />
<strong>EPMA</strong> Overview 118<br />
59
CMASTF St<strong>and</strong>ard Analyses<br />
WU8200 SDD LLSQ 3 sec. Acquisition T3<br />
Measured K Relative to Calculated K<br />
WU8200 SDD 3 sec Acquisition<br />
1.20<br />
1.10<br />
Mg Km/Kc<br />
Al Km/Kc<br />
Si Km/Kc<br />
Ca Km/Kc<br />
Ti Km/Kc<br />
Fe Km/Kc<br />
Km / Kc<br />
1.00<br />
0.90<br />
0.80<br />
0 10 20 30 40 50 60 70 80 90 100<br />
Weight Percent Oxide<br />
<strong>EPMA</strong> Overview 119<br />
Average Kmeas / Kcalc for CMASTF St<strong>and</strong>ards<br />
WU8200 SDD Data @ 120, 60, 3 s acquisition T3<br />
120s Data<br />
Average<br />
1 σ<br />
Relative %<br />
Mg<br />
1.0122<br />
0.0063<br />
0.62<br />
Al<br />
1.0064<br />
0.0122<br />
1.21<br />
Si<br />
1.0017<br />
0.0078<br />
0.78<br />
Ca<br />
0.9926<br />
0.0066<br />
0.67<br />
Ti<br />
1.0021<br />
0.0106<br />
1.06<br />
Fe<br />
1.0108<br />
0.0140<br />
1.38<br />
60s Data<br />
Average<br />
1.0058<br />
1.0022<br />
0.9969<br />
0.9895<br />
0.9975<br />
1.0083<br />
1 σ<br />
0.0118<br />
0.0162<br />
0.0069<br />
0.0066<br />
0.0150<br />
0.0113<br />
Relative %<br />
1.17<br />
1.61<br />
0.69<br />
0.67<br />
1.51<br />
1.12<br />
3s Data<br />
Average<br />
1 σ<br />
Relative %<br />
1.0061<br />
0.0162<br />
1.61<br />
1.0135<br />
0.0263<br />
2.59<br />
1.0001<br />
0.0104<br />
1.04<br />
0.9933<br />
0.0213<br />
2.14<br />
0.9947<br />
0.0118<br />
1.19<br />
1.0123<br />
0.0211<br />
2.09<br />
<strong>EPMA</strong> Overview 120<br />
60
Fast Discriminator<br />
The fast discriminator setting is used to differentiate<br />
between noise <strong>and</strong> x-ray pulses.<br />
A pulse having a voltage that exceeds the threshold<br />
is “detected”, all others are ignored.<br />
The FD is good at discriminating high energy photons<br />
from noise, but is bad at discriminating low energy<br />
(i.e. light element) photons.<br />
If the FD is set too high, low energy photons are<br />
ignored. If the FD is set too low, noise is processed<br />
<strong>and</strong> competes with real x-rays for processing time.<br />
Slow drift in the detector electronics requires periodic<br />
inspection <strong>of</strong> the FD setting. It is critical to set the FD<br />
properly for light element analysis.<br />
<strong>EPMA</strong> Overview 121<br />
Light Element EDS Analysis<br />
<strong>and</strong><br />
Detector Performance<br />
<strong>EPMA</strong> Overview 122<br />
61
Fast Discriminator Setting<br />
<strong>EPMA</strong> Overview 123<br />
Boron Kα in Silicon – 10kV 40 degrees<br />
B 95 Si 5 (B 88.0 %)<br />
B 9 Si 1 (B 77.6 %)<br />
B 7 Si 1 (B 72.9 %)<br />
B 5 Si 1 (B 65.8 %)<br />
B 2 Si 1 (B 43.5 %)<br />
BSi (B 27.8 %)<br />
µ/ρ for B Kα by Si is ~85000<br />
<strong>EPMA</strong> Overview 124<br />
62
Boron EDS Spectra 10kV, 40 degrees<br />
Red: Boron metal<br />
Green: Boron Nitride BN (43.6% B)<br />
Blue: LaB 6 (31.9% B)<br />
µ/ρ: B Kα by N 10,118<br />
B Kα by La 11,684<br />
<strong>EPMA</strong> Overview 125<br />
Ni Kα <strong>and</strong> Lα vs. Ice Thickness<br />
Applicable to SiLi LN-cooled EDS systems only!<br />
Generated Pure Ni spectra 20keV<br />
Detector ice thickness 0-5 mm<br />
No effect on Ni Kα<br />
Strong absorption <strong>of</strong> Ni Lα<br />
Presence <strong>of</strong> O Kα<br />
<strong>EPMA</strong> Overview 126<br />
63
Ni Lα vs. Ice Thickness<br />
Applicable to SiLi LN-cooled EDS systems only!<br />
0 µm<br />
0.1 µm<br />
0.5 µm<br />
1 µm<br />
2 µm<br />
3 µm<br />
4 µm<br />
5 µm<br />
Generated Pure Ni spectra<br />
20keV<br />
Strong absorption <strong>of</strong> Ni Lα<br />
Presence <strong>of</strong> O Kα<br />
<strong>EPMA</strong> Overview 127<br />
MSFC Link Recondition EDS<br />
Applicable to SiLi LN-cooled EDS systems only!<br />
After recondition<br />
Before recondition<br />
Result <strong>of</strong> reconditioning<br />
MSFC Link EDS<br />
(removal <strong>of</strong> ~ 0.75 µm ice)<br />
<strong>EPMA</strong> Overview 128<br />
64
Ice Accumulation Monitor:<br />
Ratio <strong>of</strong> Ni Lα / Ni Kα<br />
Applicable to SiLi LN-cooled EDS systems only!<br />
The effect <strong>of</strong> accumulated ice may be<br />
modeled using the DTSA program.<br />
The absorption <strong>of</strong> ice is then added<br />
to total absorption by window<br />
components <strong>and</strong> detector efficiency.<br />
<strong>EPMA</strong> Overview 129<br />
Qualitative Analysis<br />
Reliance on EDS for ID <strong>of</strong> Elements<br />
<strong>EPMA</strong> Overview 130<br />
65
Qualitative Analysis (EDS)<br />
Qualitative analysis is the identification <strong>of</strong> the<br />
elements present.<br />
The presence or absence <strong>of</strong> an element is<br />
established based on the presence or absence <strong>of</strong> x-<br />
ray peaks or families <strong>of</strong> peaks.<br />
Approximate relative concentrations may be<br />
estimated using relative peak heights, but may be<br />
subject to large uncertainty.<br />
X-ray database – list <strong>of</strong> x-ray peaks <strong>and</strong> heights.<br />
Energy calibration <strong>of</strong> EDS spectrum.<br />
<strong>EPMA</strong> Overview 131<br />
Relative X-ray Line Weights<br />
X-ray lines intensities are referenced relative to the most<br />
intense peak, i.e., Kα, Lα, or Mα.<br />
These peaks are assigned a 100% relative intensity.<br />
All other family lines for that element are scaled relatively:<br />
These line weights are only approximately known <strong>and</strong> need<br />
revision<br />
Note: Absolute x-ray intensity depends on: keV, U, E c , µ/ρ,<br />
detector efficiency, etc.<br />
So intensity <strong>of</strong> Al Kα is not equal to Cu Kα, etc.<br />
The relative intensity values are at best consistent only for<br />
a given family <strong>of</strong> an element.<br />
<strong>EPMA</strong> Overview 132<br />
66
Au L Family from Pure Au<br />
Use the position <strong>of</strong> KLM markers primarily, with relative<br />
intensity secondarily, in identification <strong>of</strong> an element<br />
<strong>EPMA</strong> Overview 133<br />
WDS Scan Au 25kV<br />
LIF Crystal -- Au 25KV 250nA 10 sec 0.2 mm<br />
1000000<br />
Au L family 1 st order<br />
100000<br />
Counts per 10 sec<br />
10000<br />
1000<br />
Au L family 2 nd order<br />
Au L family 3 rd order<br />
100<br />
65 75 85 95 105 115 125 135 145 155 165 175 185 195 205 215 225 235 245<br />
Spectrometer position, mm<br />
<strong>EPMA</strong> Overview 134<br />
67
WDS Scan Au 25kV<br />
1000000<br />
Au Lβ2 20%<br />
Au Lβ3 6%<br />
Au Lβ1 50%<br />
Au Lα1 100%<br />
Counts per 10 sec<br />
100000<br />
Au Lβ5 1%<br />
Au Lβ4 4%<br />
Au LN 1%<br />
Au Lα2 10%<br />
Au LL 3%<br />
10000<br />
1000<br />
65 70 75 80 85 90 95 100 105<br />
Spectrometer position, mm<br />
<strong>EPMA</strong> Overview 135<br />
X-ray Database—Line Weights<br />
AuLα 1,2<br />
AuLβ 1,2,3,etc.<br />
Weights<br />
<strong>of</strong><br />
lines<br />
Gold<br />
E 0 =20keV<br />
AuLl<br />
AuLγ 1,2,3,etc.<br />
<strong>EPMA</strong> Overview 136<br />
68
Peak Identification – Is it Si Kα or ?<br />
Spectrum Displayed/Acquired at 0-10 keV<br />
Initial ID indicates Ti, Si, <strong>and</strong> O. Poor energy match for Si Kα<br />
<strong>EPMA</strong> Overview 137<br />
Is it O Kα or Ti Lα ?<br />
Spectrum Acquired at 0-10 keV<br />
Closer inspection <strong>of</strong> low energy peak. Is it O Kα or Ti Lα ?<br />
Clues:<br />
Ti Kα,β match means energy<br />
calibration is good.<br />
So match for Si Kα cannot be<br />
correct, O Kα problematic.<br />
Expect consistent energy<br />
calibration throughout range<br />
<strong>EPMA</strong> Overview 138<br />
69
SrTiO 3 Confirmed by 20 keV Acquisition<br />
ID <strong>of</strong> Sr Kα,Kβ peaks at higher energy<br />
Sr Lα assignment instead <strong>of</strong> Si Kα.<br />
Low energy peak is O Kα + Ti Lα.<br />
Morals:<br />
ID from high to low energy (high Z to low Z)<br />
Use higher voltage to do ID, conventional voltage<br />
for quantitative analysis<br />
<strong>EPMA</strong> Overview 139<br />
Benitoite BaTiSi 3 O 9<br />
Ba M family peak. But which one is<br />
it? Ba is Z = 56.<br />
The REE’s (Z 57-71) are the lowest<br />
Z elements to have a Mα peak.<br />
<strong>EPMA</strong> Overview 140<br />
70
Ba has no Mα line, only Mγ, Mz1, Mz2, etc.<br />
Lanthanum is lowest Z with Ma line<br />
Lower Z elements have M lines, not<br />
Ma though. Be aware when ID’ing<br />
low energy peaks <strong>of</strong> high Z materials<br />
As you look at materials with higher<br />
Z, <strong>and</strong> use higher E o , you will find<br />
many x-ray lines to be identified.<br />
<strong>EPMA</strong> Overview 141<br />
Classic Overlap: S Kα, Mo Lα, <strong>and</strong> Pb Mα<br />
PbS <strong>and</strong> MoS 2 have peak overlaps<br />
It is possible from inspection <strong>of</strong> peak<br />
shape <strong>and</strong> resolution to partially<br />
discriminate these overlaps<br />
Mo L family, Pb M family<br />
Acquisition at higher voltage would<br />
allow ID <strong>of</strong> Mo K-lines <strong>and</strong> Pb L-<br />
lines <strong>and</strong> is definitive<br />
<strong>EPMA</strong> Overview 142<br />
71
Cathodoluminescence Advances<br />
Luminoscope CL image <strong>of</strong> typical single Crystal<br />
Diamond, South Africa<br />
growth zoning<br />
HFW ~3 mm (courtesy <strong>of</strong> S. Shirey)<br />
CL <strong>EPMA</strong> Zircon ZrSiO 4<br />
<strong>EPMA</strong> Overview 143<br />
Cathodoluminescence<br />
<br />
<br />
<br />
<br />
<br />
<br />
<br />
<br />
CL is the emission <strong>of</strong> photons in the visible light region resulting from<br />
electron bombardment; <strong>EPMA</strong> with focused beam is excellent for CL<br />
The spectroscopy <strong>and</strong> interpretation <strong>of</strong> CL are complex<br />
CL is produced by defects (semiconductors) <strong>and</strong>/or trace elements<br />
(minerals)<br />
Activation can be produced by trace elements at ppb-ppm<br />
concentrations, well below nominal <strong>EPMA</strong> sensitivity (bse, x-ray)<br />
Minerals: activation by Mn, REE, etc., quenched at high concentration<br />
<strong>and</strong> by Fe<br />
CL collected by photomultiplier, parabolic mirror, fiber optic/grating<br />
systems<br />
Total CL signal vs. spectral <strong>and</strong> hyperspectral data collection<br />
Quantification requires spectrum peak deconvolution<br />
<strong>EPMA</strong> Overview 144<br />
72
Types <strong>of</strong> <strong>EPMA</strong> CL systems<br />
PMT collector<br />
wRGB filter turret<br />
Optical microscope w/ spectrometer<br />
spectrometer<br />
mirrors<br />
air-cooled CCD<br />
(supplanted by<br />
LN 2 -cooled unit)<br />
slits<br />
HSPMT<br />
Color glass filters<br />
retractable mirrors<br />
PMT/CCD w/ spectrometer<br />
<strong>EPMA</strong> Overview 145<br />
Combined CL, BSE, SE Images in Zircon<br />
Zircon ZrSiO 4<br />
R BSE<br />
G CL<br />
B SE<br />
BSE CL SE<br />
<strong>EPMA</strong> Overview 146<br />
73
Luminescence database<br />
<br />
<br />
<br />
Database covers luminescence<br />
generated by<br />
Cathodoluminescence<br />
Photoluminescence<br />
Ionoluminescence<br />
X-ray induced luminescence<br />
Database contains<br />
Minerals (92) <strong>and</strong> Compounds (64)<br />
List <strong>of</strong> emitters both Intrinsic <strong>and</strong><br />
Extrinsic<br />
Major <strong>and</strong> minor classification<br />
Peak with FWHM or B<strong>and</strong><br />
Spectra available as an image & text<br />
Search by Mineral or Compound name<br />
or formula<br />
Details on references for further<br />
information:<br />
www.csiro.au/luminescence<br />
300 500 700 900<br />
Wavelength (nm)<br />
McRae, CSIRO<br />
<strong>EPMA</strong> Overview 147<br />
Quartz grains with overgrowth<br />
X-ray map<br />
Al<br />
Fe<br />
Si<br />
0 3000µm<br />
Cathodoluminescence<br />
McRae, CSIRO<br />
<strong>EPMA</strong> Overview 148<br />
74
Comparison between LA-ICP-MS <strong>and</strong> CL region<br />
Sm 3+<br />
200.0<br />
Eu 3+<br />
200.0<br />
LA-ICPMS (ppm)<br />
150.0<br />
100.0<br />
50.0<br />
LA-ICPMS (ppm)<br />
150.0<br />
100.0<br />
50.0<br />
0.0<br />
0.0<br />
0 20 40 60 80 100 0 5 10 15 20 25 30 35<br />
1.91 eV CL Intensity<br />
2.0 eV CL Intensity<br />
Dy 3+<br />
Er 3+<br />
300.0<br />
150.0<br />
LA-ICPMS (ppm)<br />
250.0<br />
200.0<br />
150.0<br />
100.0<br />
50.0<br />
0.0<br />
0 10 20 30 40 50 60<br />
2.17 eV CL Intensity<br />
LA-ICPMS (ppm)<br />
100.0<br />
50.0<br />
0.0<br />
0 5 10 15 20 25 30<br />
2.24 eV CL Intensity<br />
McRae, CSIRO<br />
<strong>EPMA</strong> Overview 149<br />
Calibrated CL maps<br />
Spectral collection using microprobe optical microscope<br />
200 ppm<br />
Sm 3+<br />
100 ppm<br />
1 mm<br />
0<br />
200 ppm<br />
Eu 3+<br />
100 ppm<br />
<strong>EPMA</strong> Overview 150<br />
0<br />
McRae, CSIRO<br />
75
Pink Spodumene – Kunzite (LiAlSi 2 O 6 )<br />
1 mm<br />
2.04 eV 2.72 eV 2.93 eV<br />
CL activation by trace Mn (?)<br />
McRae, CSIRO<br />
<strong>EPMA</strong> Overview 151<br />
Combined CL, BSE, X-ray Mapping<br />
<strong>EPMA</strong> Overview 152<br />
76
Quantitative Analysis<br />
Part 1<br />
Quantitative Analysis<br />
Peak Intensity Measurement<br />
Precision <strong>and</strong> Accuracy<br />
Matrix Effects -- ZAF Correction<br />
Case Studies<br />
Quantitative Analysis <strong>Summary</strong><br />
Quantitative analysis is the measurement <strong>of</strong> the<br />
amount or concentration <strong>of</strong> each element present.<br />
Results are presented in weight or atomic percent<br />
(or fraction).<br />
X-ray intensity is measured on both sample <strong>and</strong><br />
st<strong>and</strong>ard, using exactly the same analysis<br />
conditions. Comparative technique.<br />
Corrections are made for the effects <strong>of</strong> atomic<br />
number, fluorescence, <strong>and</strong> absorption for all<br />
elements in both the sample <strong>and</strong> the st<strong>and</strong>ard.<br />
Errors are dependent on instrumental setup, x-ray<br />
intensities, degree <strong>of</strong> certaintly <strong>of</strong> st<strong>and</strong>ard<br />
composition, <strong>and</strong> correction algorithms used.<br />
<strong>EPMA</strong> Overview 154<br />
77
Intensity Measurement: K-ratio<br />
The fundamental measurement is the characteristic<br />
background-subtracted peak intensity (x-ray counts)<br />
<strong>of</strong> the chosen element. This intensity is measured on<br />
the sample <strong>and</strong> divided by the same on the st<strong>and</strong>ard.<br />
This is the k-ratio:<br />
K = (P – B) sample / (P – B) st<strong>and</strong>ard<br />
By definition, K=1 if the st<strong>and</strong>ard is analyzed as an<br />
“unknown”, <strong>and</strong> K=0 at zero concentration (below the<br />
detection limit).<br />
Further corrections may need to be made for any<br />
difference in count time t, deadtime, <strong>and</strong> probe current<br />
i, that were used when acquiring the sample <strong>and</strong><br />
st<strong>and</strong>ard. In the case <strong>of</strong> EDS, elements are counted<br />
for live time, so the deadtime correction has already<br />
been performed.<br />
K is multiplied by: ( i sample / i std ) * ( t sample / t std )<br />
<strong>EPMA</strong> Overview 155<br />
Peak Intensity Measurement<br />
<strong>EPMA</strong> Overview 156<br />
78
How to Extract Peak from Background?<br />
WDS: excellent resolution -- measurements are made<br />
on top <strong>of</strong> the peak <strong>and</strong> two adjacent backgrounds,<br />
then background under the peak is determined from<br />
y=mx+b fit to the two backgrounds, then background<br />
is subtracted from the peak intensity.<br />
EDS spectra have much poorer resolution, <strong>and</strong> it is<br />
not clear which counts belong to the peak <strong>and</strong> which<br />
belong to the background.<br />
Additional problems: absorption edges due to<br />
elements in the sample result in a discontinuity in the<br />
background (absorption edges are produced by the<br />
detector as well). Incomplete charge collection results<br />
in counts well away from the peak.<br />
<strong>EPMA</strong> Overview 157<br />
Matrix Effects<br />
<strong>and</strong><br />
X-ray Correction<br />
79
Matrix Effects <strong>and</strong> X-ray Correction<br />
If we take the measured x-ray intensity k, <strong>and</strong> attempt to<br />
equate that to concentration:<br />
i A,unk /i A,std = k A = C A / C std , i.e., k ~ C<br />
we find very large errors result.<br />
We need to correct for matrix effects.<br />
Matrix effects arise because the element is influenced by<br />
other elements in the analytical volume.<br />
The k-value we measure for element “A” is influenced by<br />
the presence <strong>of</strong> elements “B”, “C” ,etc. that are present in<br />
the excitation volume <strong>of</strong> the sample.<br />
The physical origins <strong>of</strong> matrix effects occur because <strong>of</strong> the<br />
processes <strong>of</strong> electron backscattering <strong>and</strong> stopping power<br />
(Z), x-ray absorption (A), <strong>and</strong> x-ray fluorescence (F):<br />
C = C std k Z A F<br />
<strong>EPMA</strong> Overview 159<br />
Matrix Effects—Fe Ni Alloy<br />
Similar Z, Absorption <strong>and</strong> Fluorescence<br />
Fe Kα enhanced<br />
Ni Kα reduced<br />
Measured K <strong>and</strong> known C show<br />
systematic differences. Why?<br />
The Fe Kα intensity is enhanced,<br />
due to fluorescence by Ni Kα, <strong>and</strong><br />
Ni Kα intensity is reduced, due to<br />
absorption by Fe atoms. Because Z<br />
for Fe <strong>and</strong> Ni are similar (26 vs. 28),<br />
the matrix corrections are for x-ray<br />
fluorescence <strong>and</strong> x-ray absorption.<br />
Fe Kα 6.403 keV, E c 7.111 keV<br />
Ni Kα 7.477 keV, E c 8.331 keV<br />
<strong>Summary</strong>: FeNi system<br />
Absorption <strong>and</strong> fluorescence<br />
Similar Z – no atomic number<br />
correction (similar scattering)<br />
<strong>EPMA</strong> Overview 160<br />
80
Matrix Effects—Cu-Au Alloy<br />
Different Z, Stopping Power & Backscattering<br />
Cu Kα enhanced<br />
Au Lα reduced<br />
Measured K <strong>and</strong> known C show<br />
systematic differences.<br />
The Cu Kα intensity is enhanced,<br />
<strong>and</strong> Au Lα intensity is reduced.<br />
Absorption <strong>and</strong> fluorescence are<br />
small (1% <strong>and</strong> 2%). Because Z for<br />
Cu <strong>and</strong> Au are different (29 vs. 79),<br />
the matrix corrections are for<br />
stopping power S <strong>and</strong><br />
backscattering R.<br />
Cu: S>R, Z
CalcZAF Output for Anorthite: Absorption Example<br />
15kV, 40 deg Armstrong Φ(ρz), FFAST macs<br />
Ca-Al2-Si2-O8 = Ca1Si2Al2O8 = 278.216g/mol, Ca 14.41% Si 20.19% Al 19.4% O 46.01%<br />
Ca 14.4061 Si 20.1901 Al 19.3964 O 46.0074<br />
Sample 1<br />
Current Mass Absorption Coefficients From:<br />
FFAST Chantler (NIST v 2.1, 2005)<br />
Z-LINE X-RAY Z-ABSOR MAC<br />
Ca ka Ca 1.4160e+02<br />
Ca ka Si 5.5490e+02<br />
Ca ka Al 4.3680e+02<br />
Ca ka O 1.1130e+02<br />
Si ka Ca 1.0871e+03<br />
Si ka Si 3.2500e+02<br />
Si ka Al 3.3036e+03<br />
Si ka O 9.7140e+02<br />
Al ka Ca 1.6558e+03<br />
Al ka Si 4.9540e+02<br />
Al ka Al 3.7410e+02<br />
Al ka O 1.4974e+03<br />
O ka Ca 2.1866e+04<br />
O ka Si 7.5458e+03<br />
O ka Al 5.6796e+03<br />
O ka O 1.1220e+03<br />
ELEMENT ABSFAC ZEDFAC FINFAC STP-POW BKS-COR F(x)e<br />
Ca ka 1.0364 3.9856 4.1306 .2259 .9002 .9649<br />
Si ka 1.0965 3.9489 4.3299 .2309 .9119 .9120<br />
Al ka 1.1178 4.0854 4.5667 .2246 .9175 .8946<br />
O ka 1.3968 3.9154 5.4691 .2438 .9546 .7159<br />
Output shows parsed anorthite<br />
composition<br />
Lists mass absorption coefficients for<br />
all elements in anorthite<br />
Next are ZAF factors for pure<br />
elements which are ultimate reference<br />
for any material<br />
ABSFAC = absorption correction<br />
STP-POW = stopping power pure el<br />
BKS-COR = backscatter corr. pure el<br />
F(x)e = f(chi) pure el (emit/gen)<br />
<strong>EPMA</strong> Overview 163<br />
CalcZAF Output for Anorthite: Absorption Example<br />
15kV, 40 deg Armstrong Φ(ρz), FFAST macs<br />
SAMPLE: 1, ITERATIONS: 0, Z-BAR: 11.90996<br />
ELEMENT ABSCOR FLUCOR ZEDCOR ZAFCOR STP-POW BKS-COR F(x)u<br />
Ca ka 1.0337 1.0000 1.0562 1.0918 1.1115 .9502 .9335<br />
Si ka 1.2992 .9984 1.0164 1.3184 1.0343 .9827 .7020<br />
Al ka 1.2146 .9870 1.0441 1.2517 1.0546 .9901 .7365<br />
O ka 2.8721 .9995 .9550 2.7415 .9324 1.0242 .2493<br />
ELEMENT K-RAW K-VALUE ELEMWT% OXIDWT% ATOMIC% FORMULA KILOVOL<br />
Ca ka .00000 .13195 14.406 ----- 7.692 1.000 15.0<br />
Si ka .00000 .15314 20.190 ----- 15.385 2.000 15.0<br />
Al ka .00000 .15495 19.396 ----- 15.385 2.000 15.0<br />
O ka .00000 .16782 46.007 ----- 61.538 8.000 15.0<br />
TOTAL: 100.000 ----- 100.000 13.000<br />
Next are ZAF factors for anorthite sample,<br />
followed by analysis.<br />
This is running ZAF in reverse:<br />
Input C to calculate k<br />
For analysis we measure k to calculate C<br />
ABSCOR = absorption correction, A<br />
FLUCOR = characteristic fluorescence correction, F<br />
ZEDCOR = atomic number correction, Z<br />
ZAFCOR = total multiplicative ZAF factor<br />
STP-POW = stopping power portion <strong>of</strong> Z<br />
BKS-COR = backscatter portion <strong>of</strong> Z<br />
F(x)u = f(chi) this material (emitted intensity/generated intensity)<br />
K-value = k-ratio relative to pure element calculated by this ZAF algorithm <strong>and</strong> mac<br />
Note that C/K is > 1 which indicates reduction in x-ray intensity (primarily due to absorption)<br />
For most materials the absorption correction ABSCOR dominates<br />
<strong>EPMA</strong> Overview 164<br />
82
CalcZAF Output for Fe 10 Ni 90 : Fluorescence Example<br />
15kV, 40 deg Armstrong Φ(ρz), FFAST macs<br />
Current Mass Absorption Coefficients From:<br />
FFAST Chantler (NIST v 2.1, 2005)<br />
Z-LINE X-RAY Z-ABSOR MAC<br />
Ni ka Ni 5.6700e+01<br />
Ni ka Fe 3.6260e+02<br />
Fe ka Ni 8.5900e+01<br />
Fe ka Fe 6.6100e+01<br />
ELEMENT ABSFAC ZEDFAC FINFAC STP-POW BKS-COR F(x)e<br />
Ni ka 1.0117 4.3419 4.3924 .2135 .9269 .9885<br />
Fe ka 1.0152 4.3900 4.4566 .2087 .9161 .9851<br />
SAMPLE: 2, ITERATIONS: 0, Z-BAR: 27.80882<br />
ELEMENT ABSCOR FLUCOR ZEDCOR ZAFCOR STP-POW BKS-COR F(x)u<br />
Ni ka 1.0060 1.0000 .9987 1.0047 .9994 .9993 .9826<br />
Fe ka 1.0037 .7733 1.0135 .7866 1.0056 1.0079 .9815<br />
ELEMENT K-RAW K-VALUE ELEMWT% OXIDWT% ATOMIC% FORMULA KILOVOL<br />
Ni ka .00000 .90019 90.441 ----- 90.000 .900 15.0<br />
Fe ka .00000 .12152 9.559 ----- 10.000 .100 15.0<br />
TOTAL: 100.000 ----- 100.000 1.000<br />
FeNi alloy is a good example <strong>of</strong> x-ray<br />
fluorescence <strong>and</strong> absorption.<br />
Ni Ka line energy is just above the edge<br />
energy for Fe K:<br />
Ni Kα 7.477 keV, Fe K Ec 7.111 keV<br />
Ni Kα x-rays are absorbed by Fe atoms <strong>and</strong><br />
fluoresce Fe Ka x-rays in the process.<br />
The emitted Fe Kα intensity consists <strong>of</strong> both<br />
primary <strong>and</strong> fluoresced x-rays <strong>and</strong> the<br />
FLUCOR value <strong>of</strong> 0.77 reduces the Fe k-ratio<br />
to correct for fluorescence by Ni.<br />
ABSCOR = absorption correction, A<br />
FLUCOR = characteristic fluorescence correction, F<br />
ZEDCOR = atomic number correction, Z<br />
ZAFCOR = total multiplicative ZAF factor<br />
STP-POW = stopping power portion <strong>of</strong> Z<br />
BKS-COR = backscatter portion <strong>of</strong> Z<br />
F(x)u = f(chi) this material (emitted intensity/generated intensity)<br />
K-value = k-ratio relative to pure element calculated by this ZAF algorithm <strong>and</strong> mac<br />
Note for Fe C/K is < 1 which indicates enhancement in x-ray intensity due to fluorescence<br />
Fluorescence is important when the line energy is higher <strong>and</strong> close to the edge energy <strong>of</strong> other<br />
matrix elements. It is most important for K by K, less so for fluorescence by L <strong>and</strong> M lines.<br />
<strong>EPMA</strong> Overview 165<br />
CalcZAF Output for Cu 20 Au 80 : Atomic Number Example<br />
15kV, 40 deg Armstrong Φ(ρz), FFAST macs<br />
Current Mass Absorption Coefficients From:<br />
FFAST Chantler (NIST v 2.1, 2005)<br />
Z-LINE X-RAY Z-ABSOR MAC<br />
Au la Au 1.2340e+02<br />
Au la Cu 2.3150e+02<br />
Cu ka Au 1.9710e+02<br />
Cu ka Cu 4.9900e+01<br />
ELEMENT ABSFAC ZEDFAC FINFAC STP-POW BKS-COR F(x)e<br />
Au la 1.0219 6.6339 6.7789 .1405 .9319 .9786<br />
Cu ka 1.0102 4.5717 4.6182 .2042 .9334 .9899<br />
CuAu alloy is a good example <strong>of</strong> atomic<br />
number effects.<br />
<strong>Electron</strong> backscattering by Au is greater than<br />
for Cu, so Cu atoms have enhanced x-ray<br />
production due to both primary <strong>and</strong><br />
backscattered electron bombardment.<br />
SAMPLE: 3, ITERATIONS: 0, Z-BAR: 75.26826<br />
ELEMENT ABSCOR FLUCOR ZEDCOR ZAFCOR STP-POW BKS-COR F(x)u<br />
Au la 1.0009 1.0000 1.0316 1.0326 1.0361 .9957 .9777<br />
Cu ka 1.0347 .9565 .7585 .7507 .6862 1.1054 .9568<br />
ELEMENT K-RAW K-VALUE ELEMWT% OXIDWT% ATOMIC% FORMULA KILOVOL<br />
Au la .00000 .89618 92.537 ----- 80.000 .800 15.0<br />
Cu ka .00000 .09942 7.463 ----- 20.000 .200 15.0<br />
TOTAL: 100.000 ----- 100.000 1.000<br />
The emitted Cu Kα intensity is higher due to<br />
backscattering <strong>and</strong> the ZEDCOR value <strong>of</strong><br />
0.75 reduces the Cu k-ratio to correct for this.<br />
ABSCOR = absorption correction, A<br />
FLUCOR = characteristic fluorescence correction, F<br />
ZEDCOR = atomic number correction, Z<br />
ZAFCOR = total multiplicative ZAF factor<br />
STP-POW = stopping power portion <strong>of</strong> Z<br />
BKS-COR = backscatter portion <strong>of</strong> Z<br />
F(x)u = f(chi) this material (emitted intensity/generated intensity)<br />
K-value = k-ratio relative to pure element calculated by this ZAF algorithm <strong>and</strong> mac<br />
Note for Cu C/K is < 1 which indicates enhancement in x-ray intensity due to backscattering by Au<br />
Backscattering is important when there is a large difference in atomic number <strong>of</strong> elements in<br />
the material.<br />
<strong>EPMA</strong> Overview 166<br />
83
End<br />
More to come…<br />
84