Sharper low-power STED nanoscopy by time gating
Sharper low-power STED nanoscopy by time gating
Sharper low-power STED nanoscopy by time gating

You also want an ePaper? Increase the reach of your titles
YUMPU automatically turns print PDFs into web optimized ePapers that Google loves.
© 2011 Nature America, Inc. All rights reserved.<br />
sharper <strong>low</strong>-<strong>power</strong> sted<br />
<strong>nanoscopy</strong> <strong>by</strong> <strong>time</strong> <strong>gating</strong><br />
Giuseppe Vicidomini 1,3,4 , Gael Moneron 1,4 ,<br />
Kyu Y Han 1,3,4 , Volker Westphal 1 , Haisen Ta 1 ,<br />
Matthias Reuss 2 , Johann Engelhardt 2 ,<br />
Christian Eggeling 1 & Stefan W Hell 1,2<br />
applying pulsed excitation together with <strong>time</strong>-gated detection<br />
improves the fluorescence on-off contrast in continuous-wave<br />
stimulated emission depletion (cW-sted) microscopy, thus<br />
revealing finer details in fixed and living cells using moderate<br />
light intensities. this method also enables super-resolution<br />
fluorescence correlation spectroscopy with cW-sted beams,<br />
as demonstrated <strong>by</strong> quantifying the dynamics of labeled lipid<br />
molecules in the plasma membrane of living cells.<br />
Stimulated emission depletion (<strong>STED</strong>) 1,2 and other fluorescence<br />
<strong>nanoscopy</strong> approaches provide relatively noninvasive insight into the<br />
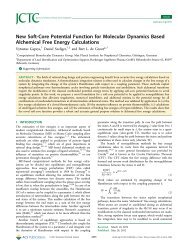
figure | Principle of g-<strong>STED</strong>. (a) Microscope<br />
setup with pulsed excitation and CW-<strong>STED</strong> lasers,<br />
whose beams are combined <strong>by</strong> dichroic mirrors<br />
(gray) and which form diffraction-limited Gaussian<br />
and doughnut-shaped focal intensity distribution,<br />
respectively (inset scale bars, 200 nm).<br />
Fluorescence light (magenta) is detected <strong>by</strong> the<br />
objective lens and imaged onto a single-photoncounting<br />
(SPC) detector, whose detection events<br />
are <strong>time</strong>-gated with respect to the excitation<br />
pulses (Trigger) and registered <strong>by</strong> a computer.<br />
(b) Time-correlated single-photon counting<br />
histograms of the fluorescence of a single isolated<br />
NV center in bulk diamond for indicated CW-<br />
<strong>STED</strong> beam <strong>power</strong> (P <strong>STED</strong> ) with experimental <strong>time</strong><br />
sequence (top) of excitation, stimulated emission<br />
(<strong>STED</strong>) and signal detection. The <strong>time</strong>-gated<br />
detection is characterized <strong>by</strong> the <strong>time</strong> delay T g and<br />
detection period ∆T. (c) Fluorescence (arbitrary<br />
units; a.u.) detected from a single isolated NV<br />
center as a function of P <strong>STED</strong> for different <strong>time</strong><br />
gates T g (mean ± s.d.; n = 4) and as a function<br />
of T g for P <strong>STED</strong> = 5.1 mW (inset, mean ± s.d.;<br />
n = 4). Solid lines show theoretical fittings.<br />
(d–f) Fluorescence images of a single isolated NV<br />
CW-<br />
<strong>STED</strong><br />
Pulsed<br />
excitation<br />
Objective<br />
Doughnut<br />
beam<br />
Gaussian<br />
beam<br />
Trigger<br />
brief communications<br />
nanoscale distribution of biomolecules in cells and tissues 3 . Nanoscopy<br />
<strong>by</strong> <strong>STED</strong> stands out <strong>by</strong> instantly providing signal from predetermined<br />
nanosized regions in the sample 3 , which makes it suited not only for<br />
imaging living cells but also for investi<strong>gating</strong> nanoscale molecular<br />
interactions <strong>by</strong> fluorescence correlation spectroscopy (FCS) 4 .<br />
In a typical <strong>STED</strong> microscope, an excitation beam is aligned with<br />
a doughnut-shaped <strong>STED</strong> beam (Fig. 1a) to transiently turn fluorophores<br />
off 2 <strong>by</strong> stimulated emission. The fluorophore remains dark<br />
if the local intensity of the <strong>STED</strong> beam exceeds I s = hν/(στ f ), with<br />
hν/σ denoting the photon energy divided <strong>by</strong> the stimulated emission<br />
cross-section 3 and τ f , the fluorescent state life<strong>time</strong>. Applying<br />
a doughnut crest intensity I m >> I s ensures that emission is possible<br />
only in a narrow range ∆r ≈ λ/(2NA(1 + I m /I s ) 1/2 ) around the<br />
doughnut center 3 , with λ denoting the wavelength of light and NA,<br />
the numerical aperture of the lens. Scanning the beams across the<br />
sample discerns adjacent features that are as little as ∆r < λ/(2NA)<br />
apart, because the <strong>STED</strong> beam forces them to emit sequentially.<br />
As τ f ≈ 10 −9 s and σ ≈10 −16 cm 2 , attaining superresolution<br />
requires I m = 0.1–1 GW cm −2 , which is conveniently supplied <strong>by</strong><br />
continuous-wave lasers providing an average <strong>power</strong> >300 mW 5,6 .<br />
To operate at <strong>low</strong>er average <strong>power</strong>, most <strong>STED</strong> nanoscopes use<br />
center for confocal (left) and CW-<strong>STED</strong> (right, P <strong>STED</strong> = 47 mW) (d), g-<strong>STED</strong> (right, T g = 15 ns) and a fluorescence life<strong>time</strong> image for the CW-<strong>STED</strong> recording (left) (e)<br />
and normalized intensity profiles through the centers of the images (f). Scale bars, 200 nm (d,e). Excitation, 532 nm; repetition rate and average <strong>power</strong><br />
10 MHz and 10 µW (b,c) and 20 MHz and 11 µW (d,e), respectively. <strong>STED</strong>, 740 nm; diffraction-limited Gaussian (b,c) and doughnut-shaped spot (d,e).<br />
1 Max Planck Institute for Biophysical Chemistry, Department of NanoBiophotonics, Göttingen, Germany. 2 German Cancer Research Center, Optical Nanoscopy Division,<br />
Heidelberg, Germany. 3 Present addresses: Italian Institute of Technology, Department of Nanophysics, Genoa, Italy (G.V.) and Department of Physics, University of Illinois<br />
at Urbana-Champaign, Urbana, Illinois, USA (K.Y.H.). 4 These authors contributed equally to this work. Correspondence should be addressed to S.W.H. (shell@gwdg.de).<br />
Received 25 JanuaRy; accepted 13 May; published online 5 June 2011; doi:10.1038/nMeth.1624<br />
a<br />
b Tg ∆T c<br />
Fluorescence (a.u.)<br />
d<br />
10 3<br />
10 2<br />
10<br />
0 20 30 60 80 100<br />
Time (ns)<br />
Confocal CW-<strong>STED</strong><br />
0 272<br />
Intensity (counts)<br />
SPC<br />
detector<br />
P <strong>STED</strong> = 0 mW<br />
P <strong>STED</strong> = 1.2 mW<br />
P <strong>STED</strong> = 4.6 mW<br />
22 246<br />
Intensity (counts)<br />
Time<br />
gate<br />
Computer<br />
Excitation<br />
<strong>STED</strong><br />
Detection<br />
1<br />
Fluorescence (a.u.)<br />
e<br />
f<br />
Intensity (a.u.)<br />
14<br />
τ (ns)<br />
nature methods | ADVANCE ONLINE PUBLICATION |<br />
0<br />
0.19<br />
Tg = 0 ns<br />
Tg = 5 ns<br />
Tg = 15 ns<br />
P <strong>STED</strong> = 5.1 mW<br />
0<br />
0 5 10 15<br />
Tg (ns)<br />
0<br />
0 5 10 15 20 25<br />
P<strong>STED</strong> (mW)<br />
1<br />
0<br />
Life<strong>time</strong> g-<strong>STED</strong><br />
14 80<br />
Intensity (counts)<br />
g-<strong>STED</strong> CW-<strong>STED</strong><br />
Confocal<br />
–100 0<br />
r (nm)<br />
100
© 2011 Nature America, Inc. All rights reserved.<br />
brief communications<br />
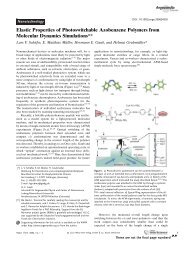
figure | g-<strong>STED</strong> fluorescence <strong>nanoscopy</strong>.<br />
(a–c) Images of 40-nm-diameter yel<strong>low</strong>-green beads (a),<br />
keratin fused to the fluorescent protein citrine<br />
in a living PtK2 cell (b) and vimentin filaments in<br />
a fixed PtK2 cell labeled <strong>by</strong> immunocytochemistry<br />
with the organic dye Alexa Fluor 488 (c). Shown are<br />
CW-<strong>STED</strong>, g-<strong>STED</strong> and confocal (top right corners)<br />
recordings as well as normalized intensity (arbitrary<br />
units; a.u.) profiles along the dashed lines. Scale<br />
bars, 1 µm. Insets show magnified views of the<br />
marked areas, renormalized in signal intensity.<br />
Excitation, 485 nm, 80 MHz and 11 µW. <strong>STED</strong>, 592<br />
nm and P <strong>STED</strong> = 370 mW (a) and 200 mW (b); gated<br />
detection: T g = 2 ns (a) and 1.5 ns (b) and ∆T = 8 ns.<br />
pulsed beams for both excitation and<br />
<strong>STED</strong> 1,2,4,7 . Whereas using continuouswave<br />
lasers instead is much simpler 5 , for<br />
a given average <strong>power</strong>, CW-<strong>STED</strong> beams<br />
yield a much <strong>low</strong>er I m and hence a poorer<br />
resolution. Moreover, unlike in the pulsed<br />
mode in which excitation and <strong>STED</strong> can<br />
occur sequentially, in the continuous-wave<br />
mode, <strong>STED</strong> is compromised <strong>by</strong> ongoing<br />
excitation and hence a less pronounced<br />
fluorescence on-off contrast at the doughnut<br />
slope. The poorer contrast entails <strong>low</strong>er<br />
spatial frequencies in the image, masking<br />
the high spatial frequencies yielding the<br />
superresolution. It is manifested as a pedestal<br />
in the effective point spread function<br />
(E-PSF) of the microscope 8 , compromis-<br />
ing the separation of object details. Here we solve this problem<br />
of CW-<strong>STED</strong> <strong>nanoscopy</strong> <strong>by</strong> implementing pulsed-laser excitation<br />
and continuous-wave laser <strong>STED</strong> in conjunction with <strong>time</strong>-<br />
gated detection.<br />
Time-gated detection has been used in fluorescence microscopy<br />
for suppressing background. Since the early days of <strong>STED</strong> <strong>nanoscopy</strong><br />
it has been known that in pulsed <strong>STED</strong> schemes, photons should be<br />
detected after the <strong>STED</strong> pulse has left 9,10 ; this has been shown in a<br />
recent experiment using <strong>time</strong>-correlated single-photon counting 11 .<br />
Here we exploit photon arrival <strong>time</strong>s to improve the spatial resolution<br />
provided <strong>by</strong> CW-<strong>STED</strong> beams so that, in conjunction with <strong>time</strong><br />
filtering, finer details are gained with <strong>low</strong>er intensities.<br />
In our scheme, the overlap between the excitation and the <strong>STED</strong><br />
beam is restricted to the duration of the excitation pulse ( τ after excitation<br />
enhances the fluorescence on-off contrast that is critical to<br />
attaining subdiffraction resolution and ensures that fluorescence<br />
light is recorded mainly from fluorophores from the doughnut<br />
center, where the <strong>STED</strong> beam is inherently weak (Fig. 1c–e).<br />
Our gated-<strong>STED</strong> (g-<strong>STED</strong>) <strong>nanoscopy</strong> can be realized <strong>by</strong> offline<br />
processing of <strong>time</strong>-correlated single-photon counting recordings<br />
| ADVANCE ONLINE PUBLICATION | nature methods<br />
a<br />
Yel<strong>low</strong>-green beads<br />
b<br />
Citrine-keratin (living cell)<br />
c<br />
Alexa Fluor 488–vimentin (fixed cell)<br />
CW-<strong>STED</strong><br />
0 119<br />
Intensity (counts per 5 µs)<br />
0 95<br />
Intensity (counts per 5 µs)<br />
0 281<br />
Intensity (counts per 50 µs)<br />
g-<strong>STED</strong><br />
0 38<br />
Intensity (counts per 5 µs)<br />
0 25<br />
Intensity (counts per 5 µs)<br />
0 93<br />
Intensity (counts per 50 µs)<br />
–200 0<br />
r (nm)<br />
or in real <strong>time</strong> using a fast electronic gate (Supplementary Note 1).<br />
The improvement of g-<strong>STED</strong> over standard CW-<strong>STED</strong> is evidenced<br />
<strong>by</strong> the E-PSF measured with fluorescent nitrogen vacancy<br />
(NV) color centers in diamond. As τ scales inversely with the <strong>STED</strong><br />
intensity, <strong>time</strong>-gated detection acts like a spatial filter reducing<br />
the E-PSF amplitude at the periphery and hence the E-PSF pedestal.<br />
Thus, <strong>low</strong> spatial frequency contributions from the periphery,<br />
which are large for standard CW-<strong>STED</strong> microscopy 8 , are suppressed<br />
(Fig. 1d–f and Supplementary Fig. 2). As the contrast<br />
between adjacent features is increased, the capability to discern<br />
features is improved (Fig. 2a and Supplementary Fig. 3). Features<br />
that are 50 nm apart can be clearly separated with a CW-<strong>STED</strong><br />
beam of only 77 mW average <strong>power</strong>. More than twice the <strong>power</strong><br />
is required to achieve the same separation without <strong>time</strong>-<strong>gating</strong><br />
(Supplementary Fig. 4); yet the resulting image is more blurred.<br />
Removing the pedestal inherently also reduces the full-width<br />
half-maximum (FWHM) (Supplementary Fig. 4). With <strong>time</strong> <strong>gating</strong>,<br />
<strong>low</strong> spatial frequencies along with their noise are discarded,<br />
which improves the resolving <strong>power</strong> without notably expanding<br />
the core bandwidth of image frequencies per se. Time <strong>gating</strong><br />
also rejects ‘desired’ photons, namely those that are emitted in T g<br />
from the doughnut center (Supplementary Fig. 4). Therefore,<br />
the increase in separation capability has to be pondered against<br />
the reduction in signal. A longer acquisition <strong>time</strong> can compensate<br />
for the concomitant decrease in signal-to-background (or<br />
signal-to-noise) ratio provided that the background noise is <strong>low</strong>er<br />
than the shot noise of the desired signal. However, both theory<br />
(Supplementary Note 1) and experiments show that the E-PSF is<br />
Intensity (a.u.)<br />
Intensity (a.u.)<br />
Intensity (a.u.)<br />
1<br />
0<br />
1<br />
0<br />
1<br />
0<br />
42 nm<br />
–200 0<br />
r (nm)<br />
–200 0<br />
r (nm)<br />
g-<strong>STED</strong><br />
CW-<strong>STED</strong><br />
Confocal<br />
200<br />
200<br />
200<br />
60 nm<br />
67 nm
© 2011 Nature America, Inc. All rights reserved.<br />
a<br />
t xy (ms)<br />
3<br />
2<br />
1<br />
CW-<strong>STED</strong><br />
T g = 1 ns<br />
T g = 2 ns<br />
T g = 3 ns<br />
0<br />
0 100 200 300<br />
P<strong>STED</strong> (mW)<br />
240<br />
200<br />
150<br />
100<br />
50<br />
FWHM (nm)<br />
b 1 0 mW<br />
c 4<br />
0.8<br />
–1<br />
0 1 2 3<br />
Tg (ns)<br />
substantially sharpened with rather short T g (for example, 5 ns in<br />
Supplementary Fig. 2) causing a signal reduction 600 mW in previous<br />
recordings of similar samples 5,6 ) highlights the potential of g-<strong>STED</strong><br />
<strong>nanoscopy</strong> for live-cell imaging. We recorded similar images with<br />
several other fluorescence markers (Supplementary Fig. 6).<br />
In combination with FCS, <strong>STED</strong> is very <strong>power</strong>ful for studying<br />
the molecular dynamics on the plasma membrane of living cells 4,13 .<br />
However, CW-<strong>STED</strong>–FCS has been precluded so far <strong>by</strong> the pedestal<br />
of the E-PSF defining the probing area 8,13 . Time <strong>gating</strong> resolves<br />
this limitation: g-<strong>STED</strong>–FCS data recordings of molecular three-<br />
and two-dimensional free diffusion (Supplementary Fig. 7 and<br />
Fig. 3a) show that the <strong>time</strong> the molecules require to cross the probing<br />
volume decreased both with increasing <strong>STED</strong> intensity (I m ) and<br />
detection delay (T g ). We obtained ∆r < 100 nm and < 50 nm (that<br />
is, a sixfold and >25-fold smaller area of detection compared to the<br />
confocal one) at a CW-<strong>STED</strong> <strong>power</strong> of 60 mW and 350 mW, respectively,<br />
entailing I m = 19 MW cm −2 and 109 MW cm −2 . Removal of<br />
the pedestal is reflected <strong>by</strong> the increase of the anomaly coefficient α<br />
with T g 4,13 . For free diffusion, α ≈ 1 for Gaussian E-PSFs, but without<br />
the pedestal removed it is 100 nm, confirming our previous<br />
<strong>STED</strong>-FCS measurements using pulsed beams 4,13 .<br />
As g-<strong>STED</strong> differs from reported pulsed or continuous-wave<br />
schemes <strong>by</strong> the fact that the beam-induced on-off transition<br />
is not quickly establishing equilibrium, ∆r fol<strong>low</strong>s an equation<br />
Anomalous α<br />
0.9<br />
170 mW<br />
Pulse<br />
340 mW<br />
Intensity<br />
3 ns<br />
τ fl<br />
–200 r (nm) 200<br />
4<br />
Ratio t xy (SM/PE)<br />
3<br />
2<br />
1<br />
CW-<strong>STED</strong><br />
T g = 1 ns<br />
T g = 2 ns<br />
T g = 3 ns<br />
0 100 200 300<br />
P <strong>STED</strong> (mW)<br />
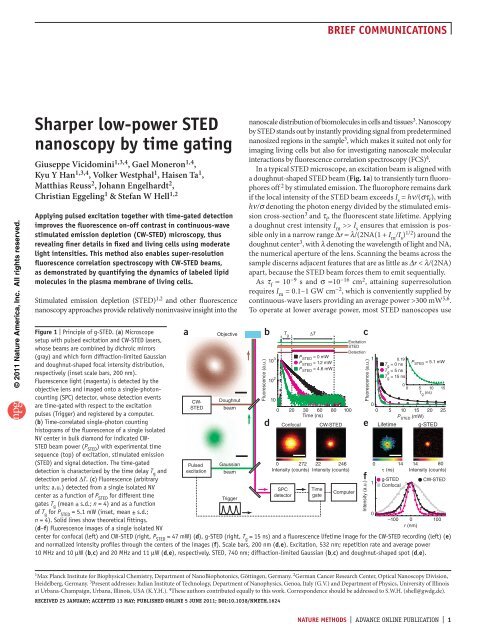
figure | g-<strong>STED</strong>-FCS. (a) Dependence of the lateral focal transit <strong>time</strong> txy on P<strong>STED</strong> of an Atto647Nlabeled<br />
phosphoethanolamine lipid in a supported lipid bilayer, determined <strong>by</strong> FCS for indicated<br />
Tg values (mean + s.d.; n = 6). The right axis reports the FWHM of the E-PSF calculated from<br />
√ (txy (P<strong>STED</strong> )/txy (0)). Lines show theoretical fittings that match g-<strong>STED</strong> but not CW-<strong>STED</strong> <strong>nanoscopy</strong><br />
data. (b) Dependence of the anomaly coefficient α of the same data on Tg for indicated P<strong>STED</strong> values. α ≈ 1 for Gaussian E-PSFs as for Tg > 1 ns and α < 1 for Gaussian-Lorentzian shapes as for<br />
nongated CW-<strong>STED</strong> (Tg < 0 ns, shaded area; dashed line, <strong>time</strong> point of maximum of excitation pulse).<br />
(c) Dependence of the ratio of the lateral focal transit <strong>time</strong> txy (n = 6; median + s.e.m. ≈ 10%)<br />
of fluorescent lipid analogs of sphingomyelin (SM) and phosphoethanolamine (PE) in the plasma<br />
membrane of living PtK2 on P<strong>STED</strong> for different Tg values and CW-<strong>STED</strong> beam <strong>power</strong>. The dashed<br />
and dotted lines report the values determined from previous pulsed <strong>STED</strong>-FCS data for ~70 nm and<br />
40–50 nm large focal spots, respectively4 . Excitation, 635 nm, 80 MHz and 12 µW (a,b) and 8 µW (c),<br />
<strong>STED</strong>, 770 nm; gated detection, ∆T = 8 ns.<br />
0 ns<br />
brief communications<br />
(Supplementary Note 1) that has been<br />
derived for the <strong>STED</strong> concept and its generalization<br />
called reversible saturable optical<br />
fluorescence transitions (RESOLFT) with<br />
non-equilibrium transitions between the on<br />
state and the off state 12 . Clearly, ∆r decreases<br />
with the duration of the <strong>STED</strong> illumination<br />
before detection, which here is T g .<br />
g-<strong>STED</strong> is applicable to virtually all fluorophores,<br />
including the fluorescent proteins,<br />
because the absolute values of τ fl and T g are<br />
not critical but their ratio is. The improvement<br />
is attained without increasing the intensity<br />
I m ; in fact, <strong>gating</strong> facilitates reducing I m<br />
in practical imaging. For attaining the same<br />
separation, we applied I m = 100 MW cm −2 ,<br />
which is ~10 <strong>time</strong>s <strong>low</strong>er than in typical<br />
pulsed systems. One also has to bear in mind<br />
that continuous-wave beams are less prone<br />
to inducing multiphoton processes known to<br />
stress the sample. In fact, of all <strong>STED</strong> modali-<br />
ties reported so far, g-<strong>STED</strong> provides the sharpest images with the<br />
<strong>low</strong>est peak <strong>power</strong>. Moreover, as suitable continuous-wave (fiber)<br />
lasers are available at any visible wavelength, g-<strong>STED</strong> is destined for<br />
broad implementation.<br />
methods<br />
Methods and any associated references are available in the online<br />
version of the paper at http://www.nature.com/naturemethods/.<br />
Note: Supplementary information is available on the Nature Methods website.<br />
acknoWledgments<br />
We thank A. Schönle and M. Leutenegger for fruitful discussions, A. Schönle for<br />
support with the software Imspector, V. Müller and A. Honigmann for support<br />
with the FCS measurements, and U. Gemm for support with the electronics.<br />
C. Wurm, T. Gilat and E. Rothermel helped prepare samples.<br />
author contributions<br />
G.V., G.M., J.E., C.E. and S.W.H. conceived and designed the study. G.V. performed<br />
theoretical studies. V.W. designed electronic components. G.V., G.M., K.Y.H., H.T.<br />
and M.R. performed experiments. G.V., G.M., K.Y.H. and C.E. analyzed data. G.V.,<br />
G.M., C.E. and S.W.H. wrote the manuscript. All authors discussed the conceptual<br />
and practical implications of the method at all stages.<br />
comPeting financial interests<br />
The authors declare competing financial interests: details accompany the fulltext<br />
HTML version of the paper at http://www.nature.com/naturemethods/.<br />
Published online at http://www.nature.com/naturemethods/.<br />
reprints and permissions information is available online at http://www.nature.<br />
com/reprints/index.html.<br />
1. Hell, S.W. & Wichmann, J. Opt. Lett. 9, 780–782 (1994).<br />
2. Klar, T.A., Jakobs, S., Dyba, M., Egner, A. & Hell, S.W. Proc. Natl. Acad.<br />
Sci. USA 97, 8206–8210 (2000).<br />
3. Hell, S.W. Nat. Methods 6, 24–32 (2009).<br />
4. Eggeling, C. et al. Nature 457, 1159–1162 (2009).<br />
5. Willig, K.I., Harke, B., Medda, R. & Hell, S.W. Nat. Methods 4, 915–918 (2007).<br />
6. Moneron, G. et al. Opt. Express 8, 1302–1309 (2010).<br />
7. Donnert, G. et al. Proc. Natl. Acad. Sci. USA 0 , 11440–11445 (2006).<br />
8. Leutenegger, M., Eggeling, C. & Hell, S.W. Opt. Express 8, 26417–26429<br />
(2010).<br />
9. Schrader, M. et al. Bioimaging , 147–153 (1995).<br />
10. Westphal, V. & Hell, S.W. Phys. Rev. Lett. 94, 143903 (2005).<br />
11. Auksorius, E. et al. Opt. Lett. , 113–115 (2008).<br />
12. Hell, S.W., Jakobs, S. & Kastrup, L. Appl. Phys., A Mater. Sci. Process. 77,<br />
859–860 (2003).<br />
13. Ringemann, C. et al. N. J. Phys. , 103054 (2009).<br />
nature methods | ADVANCE ONLINE PUBLICATION |
© 2011 Nature America, Inc. All rights reserved.<br />
online methods<br />
Microscope setup. Experiments were performed on two homebuilt<br />
<strong>STED</strong> microscopes similar to those described previously<br />
6,14 . The first setup 14 was used to image NV color centers<br />
and Atto647N-stained samples and to perform FCS measurements<br />
of lipid diffusion on membranes. The setup had a 532 nm<br />
(PicoTA, PicoQuant) or a 635 nm pulsed diode laser (LDH-D-<br />
C-635, PicoQuant) for excitation and a titanium:sapphire laser<br />
tuned to 740–770 nm and operating in continuous-wave mode for<br />
<strong>STED</strong> (Mira900, Coherent). In case of continuous-wave excitation,<br />
we used a 532 nm continuous-wave laser (Verdi, Coherent).<br />
The fluorescence was detected with a single-photon avalanche<br />
photodiode (APD) (id100-MMF50, ID Quantique) for imaging<br />
or split <strong>by</strong> a 50:50 beam splitter and detected <strong>by</strong> two APDs<br />
(SPCMAQR-13-FC, Perkin Elmer Optoelectronics) for FCS. The<br />
detector signals were acquired <strong>by</strong> a <strong>time</strong>-correlated single-photon<br />
counting (TCSPC) board (SPC-730 or DPC-230, Becker & Hickl)<br />
for post-acquisition, <strong>time</strong>-<strong>gating</strong>, life<strong>time</strong> analysis and calculation<br />
of the correlation functions. Scanning of the sample was realized<br />
using a three-axis piezo table (NanoMax, Thorlabs).<br />
The second setup 6 was used for imaging and FCS in the visible<br />
range, that is, of the yel<strong>low</strong>-green beads, Alexa Fluor 488–,<br />
Oregon Green–, Chromeo 488– or Citrine-labeled samples and<br />
Rhodamine diffusion. This microscope used a fast beam-scanning<br />
configuration with a pulsed laser module at 485 nm (LDH-D-<br />
C-485, PicoQuant) for excitation and a continuous-wave fiber laser<br />
at 592 nm for <strong>STED</strong> (MPB Communications). For imaging, the<br />
fluorescence was detected with a photomultiplier (H7422PA-40,<br />
Hamamatsu) and the signal was acquired <strong>by</strong> a custom field programmable<br />
array (FPGA) board synchronized with the beam<br />
scanner 6 . In that case, the gated detection was performed <strong>by</strong> intercalating<br />
an additional custom-made circuit between the signal<br />
output of the detector and the input of the acquisition FPGA. In<br />
brief, the additional electronics produced a logical ‘and’ between<br />
the signal from the detector and a delay- and width-adjustable<br />
pulse derived from the synchronization signal from the excitation<br />
laser source. A second logical ‘and’ between the signal from the<br />
detector and the logical inverse of the gate was also recorded on<br />
a second channel to compare the performance of g-<strong>STED</strong> with<br />
the previously reported CW-<strong>STED</strong> (<strong>by</strong> summing the two channels).<br />
For FCS measurements, we applied an APD (id100-MMF50,<br />
Quantique) for fluorescence detection (instead of the photomultiplier)<br />
and an external correlator (Flex02-08D, http://correlator.<br />
com/) in combination with the custom-build <strong>gating</strong> electronics<br />
for data acquisition (instead of the FPGA).<br />
In both setups, the focal <strong>STED</strong> doughnut was created <strong>by</strong> placing<br />
a polymer phase plate (RPC Photonics) in the circular polarized<br />
<strong>STED</strong> beam introducing a circular phase ramp from 0 to 2π into<br />
the back aperture of a 1.4 NA objective lens (100×, oil, Leica).<br />
Excitation and <strong>STED</strong> beams were overlapped and separated from<br />
the fluorescence <strong>by</strong> two dichroic mirrors. The fluorescence was<br />
detected <strong>by</strong> the same objective lens, cleaned up with appropriate<br />
bandpass and notch filters and collected through a multimode<br />
fiber for confocal detection.<br />
Both for <strong>STED</strong> and excitation light we indicate the <strong>power</strong> P measured<br />
at the back aperture of the objective. In the continuous-wave<br />
case, the <strong>STED</strong> intensity at the maximum of the focal spot can be<br />
estimated <strong>by</strong> I m = k P <strong>STED</strong> / A <strong>STED</strong> , where A <strong>STED</strong> denotes the focal area<br />
and k a scaling factor k = 1 for the diffraction-limited Gaussian spot<br />
and k = 0.3 for the doughnut-shaped spot. We determined A <strong>STED</strong> ≈<br />
π(FWHM <strong>STED</strong> /2) 2 from the FWHM diameter, FWHM <strong>STED</strong> , of<br />
the diffraction-limited Gaussian spot. The values of FWHM <strong>STED</strong><br />
of ~350 nm in the case of near-infrared <strong>STED</strong> and ~270 nm in the<br />
case of the visible <strong>STED</strong> were measured from scattering the light on a<br />
80-nm gold bead of subdiffraction diameter (gold colloid, En.GC80,<br />
BBinternational) in a nonconfocal mode (Fig. 1a).<br />
NV color center and fluorescent beads. Experiments on negatively<br />
charged NV color centers 15 , whose absorption and emission maxima<br />
are at around 560 nm and 700 nm, respectively, were performed on<br />
type IIa polycrystalline diamond grown <strong>by</strong> chemical vapor<br />
deposition (CVD) 14 . The sample was prepared <strong>by</strong> mounting the<br />
bulk CVD diamond on a standard glass coverslip. The sample of<br />
40-nm diameter yel<strong>low</strong>-green fluorescent particles (Yel<strong>low</strong>-green<br />
FluoSpheres, Molecular Probes; excitation and emission maxima<br />
at 505 nm and 515 nm, respectively) was prepared <strong>by</strong> drop casting<br />
a 1:1,000 solution of the beads on a coverslip coated with poly-llysine<br />
(Sigma) and mounted with Mowiol (Sigma-Aldrich).<br />
Plasmid construction. Standard methods were used for cloning. To<br />
tag Keratin19 (Krt19) at the C terminus with Citrine 16 , the expression<br />
plasmid pMD-Krt19-Citrine was constructed <strong>by</strong> Gateway<br />
vector conversion (Invitrogen) from the donor vector pDONR223-<br />
Krt19 (ref. 17) and the empty destination vector pMD-Citrine.<br />
Cell culture, transfection and mounting of the cells. PtK2 cells<br />
were cultivated in DMEM medium with Glutamax and 4.5%<br />
(w/v) glucose (Invitrogen) supplemented with 50 µg ml −1 penicillin,<br />
50 µg ml −1 streptomycin, 1 mM Na-pyruvate and 10%<br />
(v/v) FCS (Invitrogen) at 37 °C, 7% CO 2 . Cells were grown overnight<br />
on glass cover slides until they reached ~80% confluence.<br />
For immunofluorescence labeling, cells were fixed with ice-cold<br />
methanol (−20 °C) for 4 min fol<strong>low</strong>ed <strong>by</strong> incubation in blocking<br />
buffer (PBS containing 1% BSA). Then vimentin or tubulin<br />
filaments were stained using a labeling protocol involving a primary<br />
antibody (anti-vimentin mouse IgG (V9) or anti–β-tubulin<br />
mouse IgG, Sigma) and a secondary antibody (sheep anti-mouse<br />
IgG, Dianova) labeled with Alexa Fluor 488 (Invitrogen), Oregon<br />
Green (Invitrogen) or Chromeo 488 (Active Motif) (vimentin)<br />
and Atto 647N (Atto-Tec). Both antibodies were diluted in blocking<br />
buffer and incubated for 1 h each fol<strong>low</strong>ed <strong>by</strong> several washing<br />
steps in blocking buffer. Samples were finally embedded in<br />
Mowiol. For live-cell imaging, 1–4 d after introducing the plasmid<br />
(Nanofectin kit, PAA Laboratories), cells expressing keratin-<br />
Citrine were visible and were mounted with cell culture medium<br />
without phenol red for observations on the microscope. For FCS<br />
measurements, incorporation of the fluorescent lipid analogs into<br />
the plasma membrane of living PtK2cells was accomplished via<br />
bovine serum albumin (BSA) complexes as described previously 4 .<br />
Briefly, cells were washed with Dulbecco’s modified Eagle medium<br />
without Phenol Red buffered with 10 mM HEPES (HDMEM) and<br />
incubated with BSA-lipid complexes on ice for 30 min, washed<br />
in cold HDMEM and incubated at 37 °C for 4 min in HDMEM.<br />
Two analogs were used: Atto647N-labeled phospholipid PE (N-<br />
(Atto647N)-1,2-dipalmitoyl-sn-glycero-3-phosphoethanolamine<br />
(head-group labeling), Atto-Tec) or Atto647N-labeled sphingolipid<br />
SM (N-(Atto647)-sphingomyelin (acyl chain replacement),<br />
Atto-Tec). We applied different concentrations of BSA-lipid<br />
nature methods doi:10.1038/nmeth.1624
© 2011 Nature America, Inc. All rights reserved.<br />
complexes for incubation on ice depending on the lipid type:<br />
5–50 nM for SM and 10–300 nM for PE.<br />
Supported lipid layer. A single-component supported lipid<br />
bilayer was used as a control for free Brownian diffusion. We<br />
created the supported lipid bilayer on cover glass fol<strong>low</strong>ing the<br />
procedure described in reference 18. Briefly, the lipid DOPC (1,2dioleoyl-sn-glycero-3-phosphocholine)<br />
(Avanti Polar Lipids) and<br />
the fluorescent lipid (PE) analog were mixed in organic solvents<br />
(3:1 chloroform:MeOH) at a lipid concentration of ~10 mg ml −1 .<br />
The concentration of the fluorescent lipid analogs was on the<br />
order of 10 −4 mol %. Fifty microliters of the lipid stock solution<br />
were evaporated for 30 min under vacuum. The dry lipid film<br />
was s<strong>low</strong>ly rehydrated with 50 µl buffer solution (150 mM NaCl<br />
and 10 mM HEPES) and resuspended <strong>by</strong> vigorous vortexing.<br />
A small aliquot (10 µl) of the suspension was then diluted in<br />
140 µl of the same buffer solution and sonicated for 30 min at<br />
35 °C until the buffer-lipid solution had become transparent. This<br />
solution was placed into a microscopy chamber with plasmacleaned<br />
(Femto-RF, Diener Electronic) standard microscope<br />
cover glass. A small amount of MgCl 2 (to a final concentration<br />
of 3 mM) was added to force vesicle spreading and to initialize<br />
the bilayer formation. Thirty minutes later, the sample was thoroughly<br />
rinsed and kept under buffer solution.<br />
FCS in solution. FCS data of three-dimensional molecular diffusion<br />
in solution were recorded for the organic dye Rhodamine<br />
110 (Radiant Dyes) dissolved in 2,2′-thiodiethanol (TDE, Sigma-<br />
Aldrich; 98%, 2% water) to a final concentration of 100 nM.<br />
Measurements were performed at 20 °C in 50 µl samples sealed on<br />
microscope cover glass. We analyzed the normalized correlation<br />
data according to common FCS theory including diffusion and<br />
triplet-state dynamics and assuming a spatial three-dimensional<br />
Gaussian profile of the detected fluorescence 19<br />
GN ( tc ) = + GN ( )<br />
⎛<br />
−1 1 0 1 + tc / txy 1<br />
⎝<br />
( 1 + T / ( 1 − T) exp ( −tc<br />
/ tT ) ))<br />
tc / tz<br />
−1/<br />
2<br />
doi:10.1038/nmeth.1624<br />
( ) +<br />
( )<br />
(1)<br />
The lateral t xy = FWHM 2 /(8Dln2) and axial transit <strong>time</strong> t z =<br />
FWHM z 2 /(8Dln2) through the three-dimensional Gaussian profile<br />
are given <strong>by</strong> the diffusion constant D and the lateral and axial<br />
FWHM diameter FWHM xy and FWHM z , respectively. On-off<br />
blinking of the molecular fluorescence from the transition into<br />
the dye’s dark triplet state was regarded in the FCS analysis <strong>by</strong> the<br />
characteristic parameters of an average triplet population T and<br />
a triplet correlation <strong>time</strong> τ T .<br />
FCS on membranes. Correlation data on membranes were<br />
recorded for diffusing fluorescent lipid analogs either in supported<br />
lipid bilayers or in the plasma membrane of living cells.<br />
Correlation data were analyzed using a model of two-dimensional<br />
anomalous subdiffusion as outlined previously 4,13<br />
( )<br />
GN ( tc ) = + GN ( )<br />
⎛<br />
a −1<br />
1 0 1 + ( tc / t<br />
⎝ xy)<br />
( 1 + T / ( 1 − T) exp ( −tc<br />
/ tT<br />
) ))<br />
(2)<br />
Here t xy is the focal transit <strong>time</strong> given <strong>by</strong> the diameter of the<br />
Gaussian-like assumed focal spot, the free diffusion constant and<br />
<strong>by</strong> diffusion confinements such as transient trapping. The anomalous<br />
coefficient α is = 1 for free diffusion through Gaussianlike<br />
detection spots, and