

Workstation Calculation Guide - Morningstar
Workstation Calculation Guide - Morningstar
Workstation Calculation Guide - Morningstar

You also want an ePaper? Increase the reach of your titles
YUMPU automatically turns print PDFs into web optimized ePapers that Google loves.
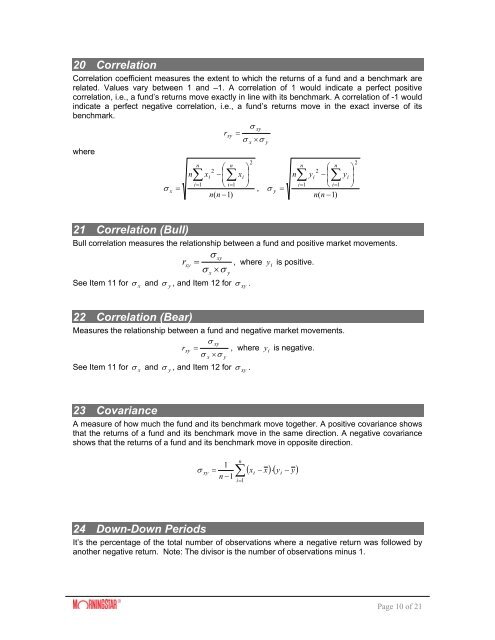
20 Correlation<br />
Correlation coefficient measures the extent to which the returns of a fund and a benchmark are<br />
related. Values vary between 1 and –1. A correlation of 1 would indicate a perfect positive<br />
correlation, i.e., a fund’s returns move exactly in line with its benchmark. A correlation of -1 would<br />
indicate a perfect negative correlation, i.e., a fund’s returns move in the exact inverse of its<br />
benchmark.<br />
where<br />
r xy<br />
xy<br />
<br />
<br />
n<br />
<br />
n<br />
<br />
2<br />
n <br />
xi<br />
<br />
xi<br />
<br />
i1<br />
i1<br />
<br />
x <br />
,<br />
n(<br />
n 1)<br />
x<br />
2<br />
y<br />
y<br />
<br />
n<br />
n<br />
<br />
i1<br />
<br />
n<br />
2<br />
y <br />
i <br />
<br />
i<br />
n(<br />
n 1)<br />
<br />
1<br />
2<br />
<br />
y <br />
i<br />
<br />
<br />
21 Correlation (Bull)<br />
Bull correlation measures the relationship between a fund and positive market movements.<br />
<br />
xy<br />
r xy<br />
, where y i is positive.<br />
<br />
See Item 11 for and , and Item 12 for .<br />
x<br />
y<br />
x<br />
y<br />
xy<br />
22 Correlation (Bear)<br />
Measures the relationship between a fund and negative market movements.<br />
xy<br />
r xy , where y i is negative.<br />
<br />
See Item 11 for and , and Item 12 for .<br />
x<br />
y<br />
x<br />
y<br />
xy<br />
23 Covariance<br />
A measure of how much the fund and its benchmark move together. A positive covariance shows<br />
that the returns of a fund and its benchmark move in the same direction. A negative covariance<br />
shows that the returns of a fund and its benchmark move in opposite direction.<br />
<br />
xy<br />
1<br />
<br />
n 1<br />
n<br />
<br />
i1<br />
x<br />
xy<br />
y<br />
i<br />
i<br />
24 Down-Down Periods<br />
It’s the percentage of the total number of observations where a negative return was followed by<br />
another negative return. Note: The divisor is the number of observations minus 1.<br />
Page 10 of 21