ATBD - GHG-CCI
ATBD - GHG-CCI
ATBD - GHG-CCI

Create successful ePaper yourself
Turn your PDF publications into a flip-book with our unique Google optimized e-Paper software.
ESA Climate Change Initiative (<strong>CCI</strong>)<br />
Algorithm Theoretical Basis Document<br />
Version 2 (<strong>ATBD</strong>v2) – UoL-FP<br />
for the Essential Climate Variable (ECV)<br />
Greenhouse Gases (<strong>GHG</strong>)<br />
Page 18<br />
Version 2 – Draft 1<br />
18 March 2013<br />
the site altitude is lower than the lowest level of a grid point the pressure is calculated with respect<br />
to the lowest level, where the temperature and molar mass are extrapolated downwards based on<br />
the lapse rate and gradient of the 5 lowest levels above, respectively. The surface pressure for the<br />
site can then be resolved by interpolating the pressures with latitude, longitude and time.<br />
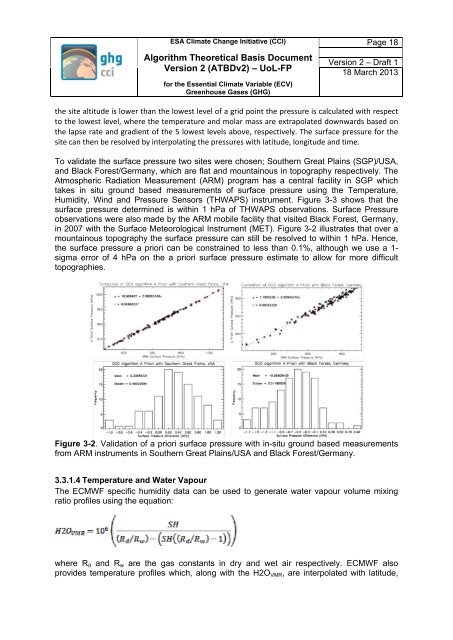
To validate the surface pressure two sites were chosen; Southern Great Plains (SGP)/USA,<br />
and Black Forest/Germany, which are flat and mountainous in topography respectively. The<br />
Atmospheric Radiation Measurement (ARM) program has a central facility in SGP which<br />
takes in situ ground based measurements of surface pressure using the Temperature,<br />
Humidity, Wind and Pressure Sensors (THWAPS) instrument. Figure 3-3 shows that the<br />
surface pressure determined is within 1 hPa of THWAPS observations. Surface Pressure<br />
observations were also made by the ARM mobile facility that visited Black Forest, Germany,<br />
in 2007 with the Surface Meteorological Instrument (MET). Figure 3-2 illustrates that over a<br />
mountainous topography the surface pressure can still be resolved to within 1 hPa. Hence,<br />
the surface pressure a priori can be constrained to less than 0.1%, although we use a 1-<br />
sigma error of 4 hPa on the a priori surface pressure estimate to allow for more difficult<br />
topographies.<br />
Figure 3-2. Validation of a priori surface pressure with in-situ ground based measurements<br />
from ARM instruments in Southern Great Plains/USA and Black Forest/Germany.<br />
3.3.1.4 Temperature and Water Vapour<br />
The ECMWF specific humidity data can be used to generate water vapour volume mixing<br />
ratio profiles using the equation:<br />
where R d and R w are the gas constants in dry and wet air respectively. ECMWF also<br />
provides temperature profiles which, along with the H2O VMR , are interpolated with latitude,