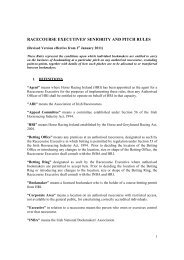
ATTENDANCE <strong>2008</strong> TOTAL ATTENDANCE 2004 - <strong>2008</strong> 1550000 1500000 1.52 1450000 1400000 1350000 1.39 1.43 1.44 1.39 1300000 1250000 1200000 Year 2004 2005 2006 2007 <strong>2008</strong> TOP SEVEN FESTIVALS BY ATTENDANCE 2007 - <strong>2008</strong> Festival No. of Days 2007 <strong>2008</strong> Variance % +/- Galway 7 203,380 192,321 -11,059 -5.4 Punchestown 4 90,868 105,669 14,801 16.3 Listowel 7 106,822 87,919* -18,903 -17.7 Leopardstown (Christmas) 4 61,488 59,379 -2,109 -3.4 Curragh (Derby Meeting) 3 45,359 43,336 -2,023 -4.5 Fairyhouse (Easter) 3 36,897 31,953 -4,944 -13.4 Limerick (Christmas) 4 28,347 24,207 -4,140 -14.6 Total 32 573,161 544,784 -28,377 -5.0 *only 5 days run in <strong>2008</strong> 28 FACTBOOK <strong>2008</strong>
AVERAGE ATTENDANCE BY RACECOURSE 2007 - <strong>2008</strong> Racecourse Number of Number of Total Total Average Average Variance Variance % Fixtures Fixtures Attendance Attendance Attendance Attendance +/- 2007 <strong>2008</strong> 2007 <strong>2008</strong> 2007 <strong>2008</strong> Ballinrobe 9 9 26,066 23,150 2,896 2,572 -324 -11% Bellewstown 5 5 16,521 16,172 3,304 3,234 -70 -2% Clonmel 11 12 18,690 17,379 1,558 1,580 22 1% Cork 19 19 54,245 45,552 2,855 2,397 -458 -16% Curragh 19 19 131,809 123,833 6,885 6,518 -367 -5% Downpatrick 9 10 17,300 20,456 1,922 2,046 124 6% Down Royal 11 12 43,161 45,672 3,924 3,806 -118 -3% Dundalk 12 29 31,117 53,873 2,335 2,114 -221 -9% Fairyhouse 21 22 80,896 66,423 3,753 3,019 -734 -20% Galway 12 10 220,598 200,782 18,369 20,078 1,709 9% Gowran Park 17 16 41,975 39,489 2,418 2,468 50 2% Killarney 8 9 28,955 29,455 3,619 3,273 -346 -10% Kilbeggan 8 9 53,494 40,250 6,803 5,031 -1,772 -26% Laytown 1 1 5,200 4,150 Leopardstown 22 23 170,182 155,574 7,736 6,764 -972 -13% Limerick 20 19 76,214 65,499 3,832 3,447 -385 -10% Listowel 9 9 111,351 91,267 12,372 10,141 -2,231 -18% Naas 15 15 32,721 30,894 2,181 2,060 -121 -6% Navan 17 17 49,645 44,107 2,960 2,595 -365 -12% Punchestown 18 18 120,598 128,997 6,700 7,167 467 7% Roscommon 9 7 30,785 25,198 3,510 3,600 90 3% Sligo 8 7 21,097 18,339 2,637 2,620 -17 -1% Thurles 11 11 20,815 24,141 1,892 2,195 303 16% Tipperary 12 11 27,871 19,586 2,319 1,781 -538 -23% Tralee 7 3 26,324 8,088 3,761 2,696 -1,065 -28% Tramore 11 11 38,825 33,609 3,530 3,055 -475 -13% Wexford 9 9 25,134 20,199 2,793 2,244 -549 -20% Total 330 342 1,521,589 1,392,134 4,611 4,071 -540 -12% FACTBOOK <strong>2008</strong> 29