Sewer System Facilities Plan Executive Summary - DC Water
Sewer System Facilities Plan Executive Summary - DC Water
Sewer System Facilities Plan Executive Summary - DC Water

You also want an ePaper? Increase the reach of your titles
YUMPU automatically turns print PDFs into web optimized ePapers that Google loves.
DISTRICT OF COLUMBIA<br />
WATER AND SEWER AUTHORITY<br />
Serving the Public ▪ Protecting the Environment<br />
<strong>Sewer</strong> <strong>System</strong> <strong>Facilities</strong> <strong>Plan</strong><br />
<strong>Executive</strong> <strong>Summary</strong><br />
June 2009<br />
Engineering Program Management Consultant-3A<br />
Delon Hampton & Associates, Chartered<br />
Limno-Tech, Inc<br />
J-Dos Internationale, Inc.
Note to Readers<br />
This <strong>Sewer</strong> <strong>System</strong> <strong>Facilities</strong> <strong>Plan</strong>, drafted in 2008, identifies a comprehensive program<br />
to address currently known problems in the sewer infrastructure and a proactive<br />
component for annual system renewal. It specifically addresses the needs of the District<br />
of Columbia’s sewer system outside of the Blue Plains Advanced Wastewater Treatment<br />
<strong>Plan</strong>t. The draft reflected consultant recommendations that were evaluated during the<br />
year by various stakeholders within <strong>DC</strong> WASA. This 2009 publication reflects the input<br />
and guidance provided by those stakeholders.<br />
The <strong>Facilities</strong> <strong>Plan</strong> lays out a recommended 10-year program of sewer system<br />
improvements. The <strong>Facilities</strong> <strong>Plan</strong> provides a guiding framework for sewer system<br />
investments that are implemented through the 10-year Capital Improvements Program<br />
(CIP). Through the annual CIP process, projects and needs identified in the <strong>Facilities</strong><br />
<strong>Plan</strong> are prioritized and the most important projects are budgeted. Ultimately, the CIP<br />
reflects consideration of many factors, including impact of the proposed expenditures on<br />
customer rates, spending needs for other service areas (e.g., wastewater treatment and<br />
water infrastructure), and new sewer system needs that may emerge over the course of<br />
the year. Thus, readers are cautioned that the projects and dollars specified in this <strong>Plan</strong><br />
will be modified through each annual CIP process.
<strong>DC</strong>WASA<br />
<strong>Sewer</strong> <strong>System</strong> Facilties <strong>Plan</strong><br />
<strong>Executive</strong> <strong>Summary</strong><br />
<strong>Executive</strong> <strong>Summary</strong><br />
1. OVERVIEW AND PURPOSE<br />
The District of Columbia <strong>Water</strong> and <strong>Sewer</strong> Authority (WASA or Authority) provides wastewater<br />
collection and treatment for the District of Columbia, and wastewater treatment for surrounding areas<br />
including parts of suburban Virginia and Maryland at the District’s Advanced Wastewater Treatment<br />
<strong>Plan</strong>t (Blue Plains). In addition, WASA has certain responsibilities for maintaining the storm sewer<br />
system as part of an agreement with the District of Columbia.<br />
The vast majority of the sewers that were constructed more than one hundred years ago are still in<br />
operation today. The effect of age on the sewer pipes is expected to deteriorate the condition and<br />
performance of the system. It is typically much more expensive and disruptive to replace an asset<br />
than to upgrade or maintain it. The sewer system service can be maintained through a reinvestment<br />
program designed to extend the performance of the sewer system. As a result, WASA conducted this<br />
study to assess the condition of the sewers to determine what improvements were necessary to<br />
maintain and renew the system. The purpose of this study is to:<br />
• Evaluate the condition and hydraulic capacity of critical elements of the sewer system<br />
• Develop a records system for capturing sewer inspection data electronically<br />
• Identify rehabilitation needs based on the assessment to extend the service life of the sewer<br />
system<br />
• Prioritize rehabilitation needs into a practical capital improvement program<br />
• Identify operation and maintenance practices needed to improve the functioning of the system<br />
• Develop a program of ongoing inspection and rehabilitation to maintain the performance of the<br />
system<br />
The sewer pumping stations were assessed by others and were therefore not addressed as part of this<br />
study. Reference information is provided so the reader understands the relationship of the pumping<br />
stations and their operation to the collection of wastewater and storm water within the city.<br />
1.1 Regulatory Requirements<br />
WASA is required to operate the sewer system facilities in accordance with certain regulatory<br />
requirements governed by two permits and two consent decree agreements.<br />
The contents of this report were prepared to comply with the conditions outlined in the permits and<br />
decrees listed below:<br />
• National Pollutant Discharge Elimination <strong>System</strong> (NPDES) Permit for Blue Plains and the<br />
Combined <strong>Sewer</strong> <strong>System</strong><br />
• NPDES permit for the Municipal Separate Storm <strong>Sewer</strong> <strong>System</strong><br />
• 3-Party (Nine Minimum Controls) Consent Decree<br />
• Long Term Control <strong>Plan</strong> Consent Decree<br />
The sewer assessment program included the above requirement in our review of current activities.<br />
The recommended plan maintains compliance with these regulatory requirements.<br />
ES-1
<strong>DC</strong>WASA<br />
<strong>Sewer</strong> <strong>System</strong> Facilties <strong>Plan</strong><br />
<strong>Executive</strong> <strong>Summary</strong><br />
2. EXISTING SYSTEMS<br />
WASA operates and maintains the storm, sanitary and combined sewer systems within the District of<br />
Columbia. WASA also operates and maintains the Potomac Interceptor which conveys wastewater<br />
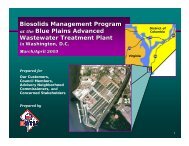
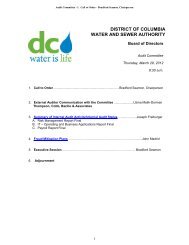
from Maryland and Virginia to Blue Plains. The Blue Plains service area covers approximately 735<br />
square miles. Figure ES-1 displays the Blue Plains service area.<br />
A schematic is presented of the major conveyance pipelines and pumping stations in the sewer<br />
system in Figure ES-2. It is convenient to think of the drainage areas as being divided into two<br />
subsystems - an Anacostia system and a Potomac/Rock Creek system. The Northeast Boundary,<br />
Navy Yard, Fort Stanton, and Tiber Creek drainage areas are part of the Anacostia system. The other<br />
drainage areas are part of the Potomac/Rock Creek system, with the B St/New Jersey Avenue<br />
drainage area serving as a link between the Anacostia and Potomac/Rock Creek systems. Table ES-1<br />
provides an inventory of the sewer system.<br />
Table ES-1 <strong>Sewer</strong> <strong>System</strong> Inventory<br />
Estimated Quantities<br />
Item<br />
Combined Separate Storm Total<br />
<strong>Sewer</strong> Pipes (miles)<br />
Figure ES-1<br />
Blue Plains<br />
Service Area<br />
Montgomery County, MD<br />
Loudoun County, VA<br />
Prince Georges County, MD<br />
Fairfax County, VA<br />
District of Columbia<br />
H:\1163\Mast<strong>Plan</strong>\Tech Mem\TM18 <strong>DC</strong> WW Quantity Assessment\Report\GIS Files<br />
Legend<br />
Blue Plains Service Area Communities<br />
District of Columbia<br />
Fairfax City<br />
Falls Church City<br />
Fairfax County<br />
Prince George's County<br />
Montgomery County<br />
Alexandria City<br />
Arlington County<br />
Loudoun County<br />
1 inch equals 25,000 feet<br />
Fairfax City<br />
Falls<br />
Church, VA<br />
Arlington,VA<br />
Alexandria, VA<br />
EPMC-3A<br />
GREELEY AND HANSEN<br />
Blue Plains Service Area<br />
D.C. WATER AND SEWER AUTHORITY
<strong>DC</strong>WASA<br />
<strong>Sewer</strong> <strong>System</strong> Facilties <strong>Plan</strong><br />
<strong>Executive</strong> <strong>Summary</strong><br />
Figure ES-3 shows the size distribution of sewers for various installation years expressed in 10-year<br />
increments. The pipe ages are unknown for a large inventory of pipes. However, the curve below<br />
demonstrates that the city infrastructure expanded significantly between the 1920’s and 1960s. We<br />
assumed a similar distribution pattern for the pipe of unknown installation dates and concluded that<br />
most of the sewer system inventory is likely older than 50 to 75 years.<br />
Figure ES-3 Pipe Size Distribution by Installed Date<br />
<strong>Sewer</strong> Pipe Lengths (LF<br />
4,000,000<br />
3,500,000<br />
3,000,000<br />
2,500,000<br />
2,000,000<br />
1,500,000<br />
1,000,000<br />
500,000<br />
0<br />
>=72-in<br />
24-72-in<br />
<strong>DC</strong>WASA<br />
<strong>Sewer</strong> <strong>System</strong> Facilties <strong>Plan</strong><br />
<strong>Executive</strong> <strong>Summary</strong><br />
would also need to consider WASA long-term program needs as identified below:<br />
• On-going Inspections; A regular and systematic inspection and rehabilitation of the sewer<br />
system. A method was selected that would help identify inspection priorities, keep track of and<br />
manage data, and to produce meaningful summary reports for management.<br />
• Maintenance Management and Work Order <strong>System</strong>; A system for storing, tracking and<br />
organizing maintenance on the system and for administering work orders to crews performing<br />
the work. WASA is currently using a computerized maintenance system which can be linked<br />
to the inspection database through MAXIMO software.<br />
• Asset Management <strong>System</strong>; The database development system will help keep an inventory and<br />
accounting of all major capital assets. These techniques are not only limited to assets such as<br />
sewers, but also major facilities and equipment such as treatment plants, pump stations, and<br />
vehicles.<br />
An application oriented project database was prepared, which gives:<br />
1. Capability to interactively and graphically access, query and manipulate the data stored<br />
2. Tools to extract reports, create projects, identify problem areas and visualize the sewer system<br />
of interest<br />
3. Options to select and prioritize rehabilitation needs based on structural and maintenance defects<br />
statistical values<br />
4. Cost options for selected rehabilitation and maintenance techniques<br />
A graphical information system (GIS) of the sewer system was also developed to serve as the base<br />
mapping for the program. The GIS was developed using WASA’s sewer counter maps and the D.C<br />
Governments GIS base mapping. A scanned image of the paper counter maps was overlaid on the<br />
<strong>DC</strong> GIS base mapping. The scanned counter map was “rubber-sheeted” so that it matched the<br />
background GIS mapping.<br />
The collected data is systematically organized using GIS based database management system. This<br />
system allows users to (1) sort/query data that satisfies specific needs, (2) identify trends of data on<br />
maps with age, material, location or other attribute, (3) view attribute data, maps and image data all<br />
at the same time, and (4) summarize results in various formats and transfer or print them.<br />
The customized geo-database uses various software to acquire, store and manipulate data. Links to<br />
digital photos and video clips are maintained by queries in the database and they are assigned proper<br />
names on the server. The design of the database allowed the sewer system information to be readily<br />
referenced, queried, updated and manipulated. <strong>Sewer</strong> inspection data acquisition and management<br />
system consist of ArcGIS and Access databases.<br />
In order to let users easily operate ArcGIS, several customer built application functions were<br />
installed in GIS program including the following:<br />
• Manhole Inspection - all inspected manholes on the GIS manhole layer can be highlighted<br />
ES-6
<strong>DC</strong>WASA<br />
<strong>Sewer</strong> <strong>System</strong> Facilties <strong>Plan</strong><br />
<strong>Executive</strong> <strong>Summary</strong><br />
• Pipe Inspections – all inspected pipe segments on the sewer layer can be highlighted<br />
• ID Report – A search form allows users to search manholes or pipe inspection reports based on<br />
Object ID or Survey ID<br />
• TV Search – A search form allows users to search pipe inspection records based on criteria<br />
defined by the user.<br />
• Segment Rating – pipe segments can be highlighted based on their structure condition rating<br />
• TV Inspection Rating -pipe segments on the sewer layer can be grouped by their structure<br />
conditions.<br />
All these functions can be displayed in GIS. After clicking on a function name or icon, GIS will<br />
automatically run a subroutine that directs the Access database to retrieve and process the related<br />
data, and then present the results in the GIS. Figure ES-4 shows a drop down menu that a user can<br />
activate so the inspection data and report information is readily available.<br />
Figure ES-4 Example of Information Available<br />
4. SEWER INSPECTION RESULTS<br />
ES-7
<strong>DC</strong>WASA<br />
<strong>Sewer</strong> <strong>System</strong> Facilties <strong>Plan</strong><br />
<strong>Executive</strong> <strong>Summary</strong><br />
A sewer inspection plan was prepared to identify the sewers proposed to be inspected. The sewer<br />
system inventory consists of approximately 1,860 miles or about 10 million feet of sewers.<br />
Sufficient information of the sewer system inventory was needed so that WASA could gain an<br />
understanding of the overall condition of the system. Due to limitations related to time, funding, and<br />
practicality, it was not feasible to inspect the whole sewer system. Six priority levels were<br />
established and critical sewers were grouped into the priority levels identified below:<br />
• Priority 1 – sewers with suspected problems or with a significant potential for problems based<br />
on their nature or location. These include sewers responsible for flooding, siphons, sewers<br />
under buildings, stream crossings, and sewers identified by staff with suspected problems.<br />
• Priority 2 - the outfall sewers, between the pumping stations and Blue Plains.<br />
• Priority 3 - major trunk sewers in the combined, sanitary and storm sewers service areas.<br />
• Priority 4 - geographically representative combined, separate sanitary and storm sewers.<br />
• Priority 5 - force mains<br />
• Priority 6 - high profile areas<br />
The sewer condition assessment was prepared using an inspection defect coding system based on the<br />
National Association of <strong>Sewer</strong> Service Companies’ (NASSCO) system. The rating system was<br />
available through their Pipeline Assessment Certification Program (PACP). This rating system is<br />
well accepted in the industry and was adopted to provide a means for repeatable assessment<br />
inspection based on a national standard.<br />
The inspection form for PACP inspections provides an area for the inspector to include comments or<br />
remarks. If the inspector observes a defect or additional valuable information that does not fall into<br />
one of the standardized codes, a comment can be added at that station (length of sewer from starting<br />
point). The grades for the structural ratings used the numeric coding system below:<br />
1 – Excellent; Minor defects<br />
2 – Good; Defects that have not begun to deteriorate<br />
3 – Fair; Moderate defects that will continue to deteriorate<br />
4 – Poor; Severe defects that will become Grade 5 defects within the foreseeable future<br />
5 – Attention required; Defects requiring a high priority for repair or attention<br />
The WASA client based system followed the same structural rating system as described in the PACP<br />
system with additional revisions to highlight the frequency of defects along a pipe segment utilizing a<br />
“normalizing” feature. The normalizing features were added to the average structural rating to<br />
produce a Total Structural Segment Rating (SSR) which can be used to prioritize the inspection data.<br />
A special priority was developed to rate the visual inspection data gathered to assess sewers in stream<br />
valleys. Visual inspections of the exposed sewers and structures were not considered as part of the<br />
PACP Rating <strong>System</strong>. A rating system was developed for this portion of the assessment based on the<br />
judgment of the survey team that included a professional engineer.<br />
ES-8
<strong>DC</strong>WASA<br />
<strong>Sewer</strong> <strong>System</strong> Facilties <strong>Plan</strong><br />
<strong>Executive</strong> <strong>Summary</strong><br />
The sewer assessment program evaluated the condition of the most critical sewers within the District.<br />
As a result of the inspection activity, some early action items where taken by WASA as either a<br />
capital program or a maintenance activity. When serious sewer system defects were identified, the<br />
matter was brought to the attention of the Department of <strong>Sewer</strong> Services and immediate action was<br />
taken.<br />
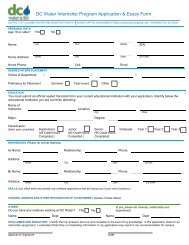
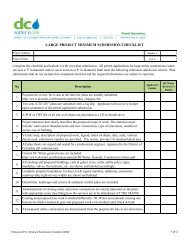
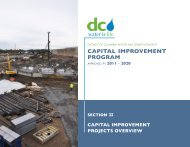
Figure ES-5 shows the location of the major wastewater sewer systems in the District of Columbia,<br />
while Figure ES-6 shows the results of the structural segment ratings.<br />
ES-9
10<br />
39<br />
10<br />
19<br />
20<br />
38<br />
6<br />
22<br />
13<br />
21<br />
15<br />
16<br />
23<br />
8<br />
37<br />
2<br />
9<br />
24<br />
4<br />
25<br />
27<br />
33<br />
35<br />
17<br />
36 2<br />
1 - East Outfall Relief <strong>Sewer</strong><br />
2 – Anacostia Force Main<br />
3 – Anacostia Main Interceptor<br />
4 – B Street / New Jersey Ave<br />
5 – West Outfall Relief <strong>Sewer</strong><br />
6 – Little Falls Trunk <strong>Sewer</strong><br />
7 – Lower Oxon Run<br />
8 – Northwest Boundary <strong>Sewer</strong><br />
9 – Potomac Interceptor Relief<br />
10 – Rock Creek Main Interceptor<br />
11 – Southwest Interceptor<br />
12 - Bolling Outfall <strong>Sewer</strong>s<br />
13 - Foundary Branch Interceptor<br />
14 – Upper Oxon Run Interceptor<br />
15 – Upper Potomac Interceptor<br />
16 – Upper Potomac Interceptor Relief <strong>Sewer</strong><br />
17 – Watts Branch<br />
18 – West Outfall <strong>Sewer</strong><br />
19 – Broad Branch Trunk<br />
20 – Broad Branch Trunk Relief<br />
21 – East Rock Creek Diversion<br />
22 – Rock Creek Main Interceptor Relief<br />
23 – West Rock Creek Diversion<br />
24 – Slash Run Trunk <strong>Sewer</strong><br />
25 – Easby Point Trunk <strong>Sewer</strong><br />
26 - Potomac Force Mains<br />
27 – Low Area Trunk <strong>Sewer</strong><br />
28 – North Interconnecting Branch<br />
30 – South Interconnecting Branch<br />
31 – East Outfall <strong>Sewer</strong><br />
32 – Anacostia Siphons<br />
33 – Tiber Creek<br />
34 – Lower East Side Interceptor<br />
35 – Northeast Boundary <strong>Sewer</strong><br />
36 – East Side Force Main<br />
37 – Upper East Side Interceptor<br />
38 – Piney Branch Trunk <strong>Sewer</strong> <strong>System</strong><br />
39 – Luzon Trunk <strong>Sewer</strong><br />
26<br />
5<br />
1<br />
12<br />
11<br />
30<br />
18<br />
31<br />
14<br />
7<br />
28<br />
32<br />
18<br />
34<br />
3<br />
14<br />
0 1.5 3 Miles<br />
EPMC-3A<br />
DELON HAMPTON & ASSOCIATES<br />
Major <strong>Sewer</strong>s
Major <strong>Sewer</strong>s<br />
0.0 - 2.0<br />
0 0.4 0.8 1.6 Miles<br />
2.0 - 6.0<br />
> 6.0<br />
EPMC-3A<br />
DELON HAMPTON & ASSOCIATES<br />
Major <strong>Sewer</strong>s SSR Map
<strong>DC</strong>WASA<br />
<strong>Sewer</strong> <strong>System</strong> Facilties <strong>Plan</strong><br />
<strong>Executive</strong> <strong>Summary</strong><br />
The sewer condition assessment was performed using a standardized rating system for both the video<br />
sewer inspection data and observations of existing field conditions. The data was converted into an<br />
electronic database that was then integrated with the GIS of the sewer system. The information<br />
provided using these techniques helped to prioritize areas of the sewer infrastructure that needed<br />
repair or rehabilitation.<br />
The following summary items were noted during the sewer condition assessment survey:<br />
• The GIS database integration with the sewer inspection data provided a platform to help<br />
organize the large amount of sewer inspection data and was used to organize and access the<br />
inspection results<br />
• A methodology for rating the sewer condition was established so comparisons can be made<br />
between sewers and to compare assessment results over time<br />
• Material build up in siphons and gently sloped sewers caused poor system performance and<br />
resulted in significant expense to clean<br />
• WASA sewer system has approximately 4 % of the system inventory under existing buildings<br />
• <strong>Sewer</strong>s near streams need protection from stream bank erosion. Access to these areas was<br />
limited due to restrictions imposed by the park authorities.<br />
• The Outfall <strong>Sewer</strong>s show significant concrete corrosion requiring near term repair for<br />
approximately 20,000 feet of pipeline.<br />
• Several major sewers also showed signs of concrete corrosion and cracking. These sewers<br />
were generally in the central core of the sewer system. The pipe defects noted during the<br />
inspections were identified throughout each priority of the critical sewers and were not limited<br />
by sewer location, age or material alone.<br />
• There were a limited number of emergency repairs required as a result of the condition<br />
assessment inspection. Generally, the pipes maintained their original shapes and were not<br />
deformed due to the structural defects.<br />
• <strong>Sewer</strong> blockages due to tree roots were limited to separate sewer areas<br />
• The Anacostia No. 2 force main is made from Pre-stressed Concrete Cylinder Pipe (PCCP).<br />
This pipe material has a history of poor performance in the industry. The original Anacostia<br />
force main and gravity sewer that served as a redundant system for the Anacostia Pumping<br />
Station was isolated in the 1990’s due to structural corrosion problems.<br />
• Areas of high infiltration rates were identified in the Rock Creek, Northeast Boundary, and<br />
Oxon Run Drainage areas. High I/I can weaken a pipeline structural support and cause<br />
structural damage.<br />
4.1 <strong>Sewer</strong> Condition Analysis<br />
Analyses of the inspection results were performed to determine if there were relationships between<br />
sewer condition and size, age, use, material and location. If such correlations exist, they could be<br />
used to guide future inspections and rehabilitations. Defects were grouped under either structural or<br />
maintenance (O&M) categories. Analysis of these categories was performed using pipe age, material,<br />
size, use and location.<br />
Structural Pipe Defects<br />
ES-12
<strong>DC</strong>WASA<br />
<strong>Sewer</strong> <strong>System</strong> Facilties <strong>Plan</strong><br />
<strong>Executive</strong> <strong>Summary</strong><br />
• <strong>Sewer</strong>s deteriorate with age and the deterioration rate depends on quality of sewer materials,<br />
construction techniques, and the environment in which the sewer was located. As a result, two<br />
sewers built at the same time may have significantly different useful lives, or certain portions<br />
of a sewer may deteriorate more rapidly than others. This was apparent in our investigations.<br />
<strong>Sewer</strong> pipes of similar age and materials in good condition were regularly found adjacent to a<br />
structurally deteriorated pipe section.<br />
• Reinforced concrete pipe (RCP), brick sewers, and concrete pipe (CP) show higher number of<br />
normalized structural defect counts than other sewer materials.<br />
• It was determined that small to medium pipe sizes experienced more structural defects than<br />
relatively larger sewers.<br />
• The majority of inspected sewers were either combined sewers or sanitary sewers. Structural<br />
defects were observed mainly in combined sewers. These observations could be a reflection of<br />
the location of combined sewers. Since combined sewers were located in the older parts of the<br />
city, they were likely subjected to loads and disturbances from various infrastructure<br />
development activities over the years. It should be noted that combined areas were the first to<br />
be built and hence age and changes to the sewer system has had an impact on the existing<br />
condition of sewers.<br />
• Storm sewers accounted for only 10% of the total inspected sewers. The structural inspection<br />
defects for storm water use were less representative than the other sewer uses.<br />
• Inspected sewers crossing various critical locations were also studied to see if there is any<br />
defect peculiar to that location. The critical locations are sewers crossing streams, rail roads,<br />
parks, under buildings, under bridges and tunnels, freeways and high profile areas.<br />
Operation and Maintenance Defects<br />
The defects in this category contribute to high O&M activity to keep the collection system<br />
operational. These defects include sediment and grease build up, encrustation, infiltration, roots and<br />
defective service connections. Maintenance defects have been analyzed for pipe age, material, size<br />
and use.<br />
• The number of maintenance defects increased with age of sewers<br />
• O&M defects were observed mainly in small to medium size sewers.<br />
• O&M defect counts were most common in sewers with materials brick sewers, concrete pipe<br />
(CP) and vitrified clay pipe (VCP).<br />
• O&M defects were more common in sanitary sewers. This is most likely because sanitary<br />
sewers lack the advantage of seasonal flushing enjoyed by combined and storm water sewers.<br />
• Leakage, roots and various forms of deposits including obstruction were maintenance defects.<br />
Leakage and deposits/obstructions are observed in all locations but roots were more frequent in<br />
sewers crossing streams and running under or near buildings.<br />
<strong>Summary</strong><br />
The sewer assessment study and sewer defect analyses were made based on the inspection surveys<br />
and can be summarized as follows:<br />
ES-13
<strong>DC</strong>WASA<br />
<strong>Sewer</strong> <strong>System</strong> Facilties <strong>Plan</strong><br />
<strong>Executive</strong> <strong>Summary</strong><br />
• There are about 1,900 miles of sewer system in the City.<br />
• 35% of these sewers are combined and serve older parts of the City.<br />
• 90% of sewer materials in the sewer database are vitrified clay pipes, concrete pipes, brick<br />
pipes & reinforced concrete pipes.<br />
• 60% of existing sewers are estimated to be more than 75 years old.<br />
• About 70% of existing sewers are under 24 in and man-entry sewers (size ≥72 in) amount to<br />
less than 10% of the existing sewer system.<br />
• 88% of inspected sewers had some defects. 60% of these sewers could be addressed using<br />
localized repair and the remaining require mainly lining.<br />
• There is an increase in number of defects with sewer pipe age, but old pipes aren’t necessarily<br />
in poor condition.<br />
• Major sewer materials are vitrified clay pipes (30% of all inspected pipes), reinforced concrete<br />
pipes (27%), brick sewers (25%) and concrete pipes (7%). Of these, reinforced concrete pipes,<br />
concrete pipes and bricks showed most of the observed defects.<br />
• Small to medium size pipes (< 72 inch) showed the majority of structural and O&M defects.<br />
• The majority of defects observed in the three uses of sewers are either in combined sewers or in<br />
sanitary sewers. These observations could be a reflection of the location and age of combined<br />
sewers (combined sewers are located in the older parts of the city) and the size and waste water<br />
quality in sanitary sewers (sanitary sewers are smaller in size and carry separate sanitary<br />
sewage with high sulfide content).<br />
• There are about 50,000 manholes in the sewer database.<br />
• About 3% of these manholes have been inspected.<br />
• 94% of the inspected manholes have one or more defects.<br />
• Defective manhole structures, which include defects on channel, bench, cone/riser and walls<br />
account for about 40% of all manhole defects observed in our investigations.<br />
Our inspection data indicates an increase in the number of defects as pipes get more than 75 years<br />
old. That doesn’t mean that pipes have reached the end of their useful life or that they all need to be<br />
rehabilitated at that age. Some sewers in Europe have been in operation for over 200 years.<br />
However, it is a good indicator of when we need to start looking at pipes to evaluate their condition.<br />
Based on their condition, it could then be determined what is needed to extend their useful life at the<br />
least cost.<br />
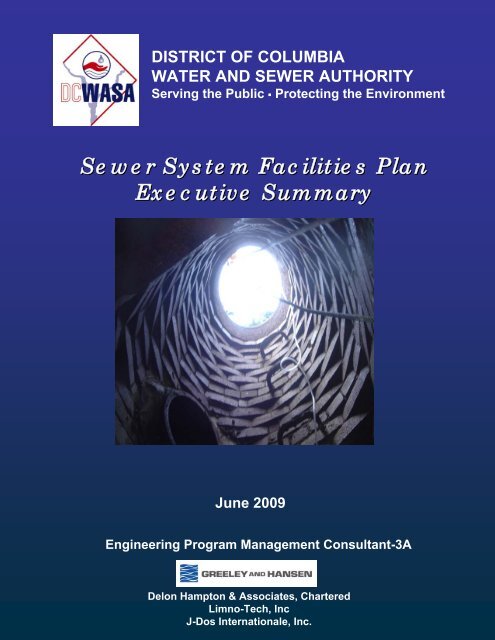
The approximate cumulative distribution of the sewer system in Washington, <strong>DC</strong> with age is given in<br />
Figure ES-7.<br />
ES-14
<strong>DC</strong>WASA<br />
<strong>Sewer</strong> <strong>System</strong> Facilties <strong>Plan</strong><br />
<strong>Executive</strong> <strong>Summary</strong><br />
Figure ES-7 Cumulative <strong>System</strong> Lengths by Age<br />
100%<br />
90%<br />
Percent of <strong>Sewer</strong> Length Installed as of Given Date<br />
80%<br />
70%<br />
60%<br />
50%<br />
40%<br />
30%<br />
20%<br />
<strong>Sewer</strong>s installed more than<br />
75 years ago<br />
10%<br />
0%<br />
1873 1878 1883 1888 1893 1898 1903 1908 1913 1918 1923 1928 1933 1938 1943 1948 1953 1958 1963 1968<br />
Installed Date<br />
4.2 <strong>Sewer</strong> Hydraulic Capacity Assessment<br />
4.2.1 Model Development<br />
The sewer system hydraulic model was expanded and improved upon from the model developed for<br />
the Long Term Control <strong>Plan</strong> (LTCP). The following data was used to estimate the various<br />
components of the District’s flow:<br />
• <strong>Sewer</strong> flow data – 75 meters and four rain gages were installed between August 2003 and<br />
November 2004 to obtain data at various points in the sewer system. Data from an additional<br />
15 flow monitors was available from other programs and data from pumping stations and Blue<br />
Plains was also used to obtain information on sewer flows.<br />
• <strong>Water</strong> meter data – water meter consumption data from the Authority was overlaid on each of<br />
the District’s sewer sheds in order to determine the potable water used by sewer shed.<br />
• Groundwater pumpage data - portions of the District, particularly in the Federal Triangle area,<br />
have buildings with sump pumps that discharge groundwater to the sewer system. There is<br />
very little reliable data on the location, quantity and frequency of discharge from these pumps.<br />
Estimates of groundwater pumpage were made by compiling available data on properties with<br />
sump pumps and by estimating groundwater elevations and the number of buildings with<br />
basements below the groundwater table. Due to the lack of reliable and consistent data,<br />
groundwater pumpage estimates are the least reliable data source used in the assessment.<br />
ES-15
<strong>DC</strong>WASA<br />
<strong>Sewer</strong> <strong>System</strong> Facilties <strong>Plan</strong><br />
<strong>Executive</strong> <strong>Summary</strong><br />
• Inflow and captured combined sewage - A detailed hydrologic and hydraulic model of the<br />
combined sewer system, including a runoff model, was prepared as part of the preparation of<br />
the LTCP. Results from that work were used in this evaluation to quantify runoff in the<br />
combined sewer area and the amount of runoff captured in the combined sewer system under<br />
alternative CSO control scenarios.<br />
• Demographic projections – the Metropolitan Washington Council of Governments (MWCOG)<br />
demographic projections were referenced in this assessment. The projections are based on<br />
D.C. Office of <strong>Plan</strong>ning data, which estimated a large increase in population and employment<br />
by the 2030 planning period. In addition, the US Census population projects were referenced<br />
for comparison as shown in Figure ES-8. The actual population growth will likely be<br />
somewhere in between.<br />
Figure ES -8 <strong>DC</strong> Population Projects to 2030<br />
District Population Data<br />
900,000<br />
800,000<br />
Census Actual Population<br />
COG 7.0 Projection<br />
732<br />
700,000<br />
District Population<br />
600,000<br />
500,000<br />
400,000<br />
300,000<br />
200,000<br />
Census Projection<br />
577<br />
433<br />
100,000<br />
-<br />
1900 1910 1920 1930 1940 1950 1960 1970 1980 1990 2000 2010 2020 2030<br />
Year<br />
We considered the potential growth patterns and the impacts on the existing infrastructure so that the<br />
sewer infrastructure could be planned to accommodate future sewer needs. Currently, the District of<br />
Columbia is undergoing major redevelopment projects throughout the city. These new<br />
redevelopments, however, are not expected to exceed the sewer system dry weather hydraulic<br />
capacity because the system was oversized to handle storm flows and because the city’s previously<br />
served an active population base of 800,000 residents in the 1950’s. The most optimistic population<br />
projects show the service population to be under 800,000 throughout the 2030 planning period.<br />
ES-16
<strong>DC</strong>WASA<br />
<strong>Sewer</strong> <strong>System</strong> Facilties <strong>Plan</strong><br />
<strong>Executive</strong> <strong>Summary</strong><br />
<strong>Water</strong> meter data was used to estimate sewage flow from homes and businesses in each sewer shed.<br />
During dry weather, the difference between the sewer flow meter data and water meter data was<br />
considered to represent the sum of groundwater pumpage and infiltration. Groundwater pumpage<br />
was estimated from records of sump pumps and estimates of the number of buildings with sump<br />
pumps. Infiltration was then estimated by subtracting the calculated groundwater pumpage from the<br />
sum of infiltration and groundwater pumpage. Inflow and captured combined sewage were estimated<br />
using the sewer system model developed for the Long Term Control <strong>Plan</strong>.<br />
Table ES-2 shows wastewater quantities projected for the District. The table also shows the actual<br />
quantities measured during the assessment period from May 2003 to May 2004. These values where<br />
used in conjunction with model for the collection system and historical data to estimate wastewater<br />
quantities for year 2005 for dry, wet and average years. In addition, a projection was made for 2030<br />
using demographic projections provided by the District Office of <strong>Plan</strong>ning and MWCOG.<br />
WASA is in the process of implementing the LTCP. The table identifies the amount of captured<br />
CSO that will be treated by Blue Plains at the following stages of implementation of the plan:<br />
• <strong>Sewer</strong> Collection <strong>System</strong> without the Inflatable Dams and Pumping Stations not Rehabilitated -<br />
This was the configuration of the system prior to implementation of the Phase I CSO controls<br />
in the early 1980’s. Since many of the inflatable dams failed after installation due to a<br />
manufacturing defect, this scenario is also an approximation of the system up to 2004, when<br />
the inflatable dams were replaced.<br />
• Inflatable Dams and Pumping Stations Rehabilitated – This is the configuration of the system<br />
expected by the end of 2009. Inflatable dams were replaced in 2004. The rehabilitation of the<br />
pumping stations is expected to be complete by 2009.<br />
• Complete LTCP in Place –This is the configuration of the system after the entire LTCP is in<br />
place, including rehabilitation of the pumping stations and inflatable dams, construction of 193<br />
million gallons of tunnel storage, targeted sewer separation, low impact development at WASA<br />
facilities and consolidation of selected outfalls. This is scheduled for completion in 2025.<br />
ES-17
<strong>DC</strong>WASA<br />
<strong>Sewer</strong> <strong>System</strong> Facilties <strong>Plan</strong><br />
<strong>Executive</strong> <strong>Summary</strong><br />
Table ES-2 Projected District Wastewater Quantities (All flows in mgd)<br />
Assessment<br />
Year 2005 Year 2030 1<br />
Period<br />
Category<br />
Dry<br />
Wet Dry<br />
Wet<br />
(5/03 to<br />
Avg Year<br />
Avg Year<br />
Year<br />
Year Year<br />
Year<br />
5/04)<br />
Rainfall (inches/year) 53.69" 31.74"<br />
(1988)<br />
40.84"<br />
(avg '88-90)<br />
50.32"<br />
(1989)<br />
31.74"<br />
(1988)<br />
40.84"<br />
(avg '88-90)<br />
50.32"<br />
(1989)<br />
Wastewater<br />
Domestic 63.1 63.1 63.1 63.1 75.0 75.0 75.0<br />
Employment 27.3 27.3 27.3 27.3 30.2 30.2 30.2<br />
Visitors 5.2 5.2 5.2 5.2 5.4 5.4 5.4<br />
Wastewater Subtotal 95.6 95.6 95.6 95.6 111 111 111<br />
Infiltration & Groundwater<br />
Pumpage<br />
Infiltration 58 37 41 51 37 41 51<br />
Groundwater Pumpage 16 10 11 14 10 11 14<br />
Infiltration/GW Subtotal 74 47 52 64 47 52 64<br />
Inflow 2.6 1.5 2 2.5 1.5 2 2.5<br />
All Flows Except Captured<br />
Combined Sewage<br />
172 144 150 162 159 165 177<br />
Captured Combined Sewage<br />
No Inflatable Dams, No P.S. 13 10 12 13 10 12 13<br />
Rehab.<br />
Total w/this CSO Scenario 185 155 162 176 170 177 191<br />
With Inflatable Dams and<br />
N/A 13 16 18 13 16 18<br />
P.S. Rehabilitated<br />
(scheduled for 2009)<br />
Total w/this CSO Scenario 158 166 181 173 181 196<br />
Complete LTCP in Place<br />
(scheduled for 2025)<br />
N/A 16 21 25 16 21 25<br />
Total w/this CSO Scenario 161 171 187 176 186 202<br />
A comparison of the District’s IMA allocation to projected flows in an average year of rainfall is<br />
shown in Table ES-3. If captured combined sewage flows are excluded, the District is very close to<br />
its 148 mgd allocation in 2005. However, the District is projected to exceed its allocation by 17 mgd<br />
in 2030 if population growth occurs as projected by the Office of <strong>Plan</strong>ning and MWCOG. If<br />
captured combined sewage flows are included in the calculation, the District is projected to exceed<br />
its allocation by 14 mgd in 2005 and 38 mgd in 2030. Note that the projections for 2030 assume that<br />
1 Assumes <strong>DC</strong> (COG Round 7.0) Population Projects.<br />
ES-18
<strong>DC</strong>WASA<br />
<strong>Sewer</strong> <strong>System</strong> Facilties <strong>Plan</strong><br />
<strong>Executive</strong> <strong>Summary</strong><br />
the aggressive growth in population and employment anticipated by the Office of <strong>Plan</strong>ning and<br />
MWCOG occur.<br />
Table ES-3<br />
Flow Reductions to Meet Current IMA<br />
(All flows in mgd)<br />
Average Year Rainfall of<br />
40.84" (avg '88-90)<br />
Parameter Year 2005 Year 2030<br />
Excluding Captured Combined Sewage<br />
IMA Allocation 148 148<br />
Projected Flow Excluding Captured Combined Sewage 150 165<br />
Flow Reduction Needed 2 17<br />
Including Captured Combined Sewage<br />
IMA Allocation 148 148<br />
Projected Flow Including Captured Combined Sewage 162 186<br />
Flow Reduction Needed 14 38<br />
The IMA is currently under review for updating and possible redistribution of flow allocations. The<br />
outcome of these negotiations is not known. For purposes of this study, we based our recommended<br />
plan on flow allocations of 148 mgd currently assigned to the District of Columbia excluding any<br />
captured combined flow.<br />
4.2.2 Hydraulic Capacity<br />
The current sewer design standard requires a sewer to convey a 15 year storm flow. The major sewer<br />
systems performances were assessed for15 and 100 years storm events. Software developed by the<br />
Danish Hydraulic Institute, MIKE VIEW was utilized to view the sewer networks performance when<br />
conveying flows during selected storm events. The level of the Hydraulic Grade Line (HGL) was<br />
noted. From this analysis a rating scale was established to prioritize the systems based on the level of<br />
the HGL to the ground level. Each system was assigned a rating of 1, 3, or 5. The rating scale<br />
defined below is followed by Table ES-4 which illustrates the ratings for each major sewer system:<br />
1 – HGL is within the pipe or stays 7 feet from the ground surface<br />
3 – HGL comes within 7 feet of the ground surface<br />
5 – HGL is above the ground surface<br />
ES-19
<strong>DC</strong>WASA<br />
<strong>Sewer</strong> <strong>System</strong> Facilties <strong>Plan</strong><br />
<strong>Executive</strong> <strong>Summary</strong><br />
Table ES-4<br />
Hydraulic Ratings for Major <strong>Sewer</strong>s located in Metropolitan Washington, <strong>DC</strong><br />
Hydraulic Rating<br />
<strong>Sewer</strong> <strong>System</strong><br />
15 year storm 100 year storm<br />
Anacostia Main Interceptor 5 5<br />
B Street/New Jersey 3 5<br />
Easby Point 5 5<br />
East Oxen Run 1 1<br />
Lower East Side Interceptor 3 3<br />
Luzon Valley 1 1<br />
Northeast Boundary 5 5<br />
Northwest Boundary 1 3<br />
Piney Branch 3 5<br />
Rock Creek Main Interceptor 3 5<br />
Slash Run 1 1<br />
Tiber Creek 1 3<br />
Upper East Side Interceptor 1 3<br />
Upper Potomac Interceptor 5 5<br />
Upper Potomac Interceptor Relief <strong>Sewer</strong> 3 1 5<br />
Watts Branch 5 5<br />
West Oxon Run 1 1<br />
1 A portion of the Upper Potomac Interceptor Relief <strong>Sewer</strong> was design to operate under pressure where<br />
the HGL is shown above the man-hole rim elevation. See Appendix B UPIR <strong>Sewer</strong> 15 year storm.<br />
The hydraulic improvement projects developed to address the surcharged condition where the HGL<br />
was near grade were along the Anacostia Main Interceptor, Upper Potomac Interceptor Relief <strong>Sewer</strong>,<br />
and Easby Point <strong>Sewer</strong>. These projects are described in the Recommended <strong>Plan</strong>. The existing CIP<br />
assigned projects to rehabilitate portions of the UPI and PI Relief <strong>Sewer</strong>. The LTCP includes<br />
elements to address the most serious capacity issues along the Northeast Boundary <strong>Sewer</strong>.<br />
5. PROJECT INDENTIFICATION<br />
Defective pipe segments were assessed for rehabilitation using various rehabilitation technologies.<br />
In support of this process, a data quality control program was used to review and correct the accuracy<br />
of sewer and manhole inspection data collected as part of the planning process. The data was then<br />
uploaded into the sewer system database so queries could be made to identify the most seriously<br />
defective sewer pipes.<br />
The selection of appropriate rehabilitation technologies was performed using the following steps:<br />
ES-20
<strong>DC</strong>WASA<br />
<strong>Sewer</strong> <strong>System</strong> Facilties <strong>Plan</strong><br />
<strong>Executive</strong> <strong>Summary</strong><br />
1. Identify all pipe segments with Structural Segment Ratings (SSR) of 2 and above from the<br />
computer database<br />
2. Analyze identified sewer segments in Step 1 to determine defect type, frequency, continuity<br />
and severity.<br />
3. Group defective sewer segments under appropriate rehabilitation methods and categories<br />
4. Estimate capitol costs for each proposed project<br />
The proposed projects were divided into six project categories, as shown in Table ES-5, to assist<br />
with project identification and organization.<br />
Table ES-5 Project Classification<br />
Category Description Number of<br />
Projects<br />
I Major <strong>Sewer</strong>s Projects on outfalls, interceptors, force mains and trunk sewers.<br />
This category has been divided into two parts:<br />
• Category 1A – major sewers which were inspected and<br />
proposed to be rehabilitated<br />
• Category 1B - major sewers which have not been inspected<br />
during the study period. But, because of their importance,<br />
should be inspected.<br />
1A - 29 projects<br />
IB - 16 projects<br />
II Local <strong>Sewer</strong>s Rehabilitation of local sewers with identified defects 5<br />
III<br />
IV<br />
V<br />
VI<br />
Projects to<br />
Facilitate O & M<br />
Permit & Consent<br />
Decree<br />
Hydraulic<br />
Improvements<br />
Creek Bed <strong>Sewer</strong><br />
Rehabilitation<br />
Projects intended to improve the ability to operate and maintain<br />
13<br />
the system such as improving access, adding manholes, installing<br />
stop logs, etc.<br />
Projects required by the NPDES Permit or Consent Decrees, such<br />
3<br />
as cleaning and inspection of Anacostia Siphons and Eastside<br />
Interceptor<br />
Projects designed to improve hydraulic performance of the system 3<br />
Projects intended to rehabilitate sewers in creeks and stream<br />
crossing to address problems such as erosion, joint failure,<br />
physical damage, and infiltration / inflow<br />
26<br />
Costs were estimated based on historical construction costs for similar projects in the District of<br />
Columbia and other cities, published data and vendor quotes. Since these estimates are made without<br />
detailed design, they are useful for planning purposes only. The estimated total project costs include:<br />
• Construction cost = Raw construction cost plus 35% contingency<br />
• Capital Cost = construction cost x 1.4 for program management, design, construction<br />
management and others.<br />
6. RECOMMENDATIONS<br />
6.1 Capital Improvement <strong>Plan</strong><br />
ES-21
<strong>DC</strong>WASA<br />
<strong>Sewer</strong> <strong>System</strong> Facilties <strong>Plan</strong><br />
<strong>Executive</strong> <strong>Summary</strong><br />
The total estimated cost of all capital improvement plan (CIP) projects identified for the planning<br />
period ending in year 2030 is approximately $537 million (2008 dollars). Table ES-6 provides a<br />
summary of all projects and the 10-year recommended plan.<br />
Table ES-6 <strong>Summary</strong> of Proposed CIP Projects and Ten Year Funding Needs<br />
All Projects<br />
Proposed 10-yr CIP<br />
Category<br />
Capital Cost<br />
Capital Cost<br />
Capital Cost<br />
No.<br />
No.<br />
($M, Escalated @<br />
($2008M)<br />
(2008$M)<br />
5% per year)<br />
Major <strong>Sewer</strong> Rehab 29 444.1 14 (+/-) 173.2 249.8<br />
Major <strong>Sewer</strong> Critical<br />
16 6.5 16 6.5 7.8<br />
Inspection<br />
Local <strong>Sewer</strong> Rehab 5 23.7 5 23.7 33.8<br />
Operation & Maintenance 13 8.0 13 8.0 10.7<br />
Projects<br />
Permit and Consent Decree 3 4.9 3 2.0 2.5<br />
Projects (includes recurring<br />
costs during the planning<br />
period)<br />
Hydraulic Improvements 3 1.0 3 1.0 1.1<br />
Creek Bed <strong>Sewer</strong> Rehab 26 48.3 26 45.6 67.7<br />
Total 95 536.5 80 260.0 373.4<br />
We recommend implementing 80 of the 95 projects during the first 10 years. Approximately $260<br />
million (2008 dollars) would be needed during the period. The projects were prioritized using a<br />
selection process based upon the ranking criteria discussed below:<br />
• Projects grouped under Permits & Consent Decree (Category IV) were not ranked because they<br />
were required by Consent Decree.<br />
• Projects grouped under O & M Improvement (Category III) and Hydraulic Improvement<br />
(Category V) have not been ranked, since they constitute less than 2.5 % of the total estimated<br />
capital cost of the recommended projects and the projects address immediate operational needs.<br />
• Projects grouped under the remaining three categories were ranked within their own category<br />
- Major and Local <strong>Sewer</strong>s were prioritized based on weighted values for Structural<br />
Defects, Impacts on <strong>Sewer</strong> Operation and Maintenance, <strong>Sewer</strong> <strong>System</strong> Redundancy, and<br />
Hydraulic Impacts<br />
- <strong>Sewer</strong>s Rehabilitation near Creek Beds; Two criteria were evaluated. Weighted values<br />
for replacement versus rehabilitation projects. Higher value was given to replacement<br />
projects due to the severity of the pipe condition. The other criteria considered were the<br />
scope of the projects. Larger scope projects were given a higher priority due to the<br />
expected benefit from the project.<br />
ES-22
<strong>DC</strong>WASA<br />
<strong>Sewer</strong> <strong>System</strong> Facilties <strong>Plan</strong><br />
<strong>Executive</strong> <strong>Summary</strong><br />
It is recommended that the project priorities ranking for project categories be reviewed annually to<br />
incorporated current system knowledge. Table ES-7 lists the projects using the ranking system<br />
described above.<br />
Project ID<br />
Table ES-7 List of Projects<br />
Project Title<br />
ES-23<br />
Total Project<br />
Cost, 2008 $M<br />
Category IA Major <strong>Sewer</strong> Rehab<br />
SS-1-20 Rehabilitation of Lower East Side Interceptor 12.6<br />
SS-1-26 Rehabilitation of Piney Branch Trunk <strong>Sewer</strong> from Madison St, NW to<br />
21.3<br />
Structure no 70<br />
SS-1-21 Rehabilitation of Northeast Boundary Trunk <strong>Sewer</strong> 43.1<br />
SS-1-11 Rehabilitation of the Upper Part of Rock Creek Main Interceptor 12.4<br />
SS-1-18 Lining of Part of Tiber Creek Trunk <strong>Sewer</strong> 37.3<br />
SS-1-02 Construction of backup Force Main for existing AFM 102.9<br />
SS-1-03 Assessment and Rehabilitation of existing AFM 64.1<br />
SS-1-19 Local repairs on Tiber Creek Trunk <strong>Sewer</strong> 6.5<br />
SS-1-08 Rehabilitation of Little Falls Trunk <strong>Sewer</strong> 5.5<br />
SS-1-17 Cleaning and Inspection of Potomac Force Main 1.3<br />
SS-1-04 Rehabilitation of Anacostia Main Interceptor between Benning Rd and East<br />
4.2<br />
Capitol St, NE<br />
SS-1-13 Rehabilitation of Watts Branch between Gault Rd and Minnesota Ave, NE 0.9<br />
SS-1-01 Rehabilitation of East Outfall Relief <strong>Sewer</strong> 45.3<br />
SS-1-15 Rehabilitation of West Outfall <strong>Sewer</strong> 22.1<br />
SS-1-22 Rehabilitation of Upper East Side Interceptor at Rhode Island Road 4.6<br />
SS-1-23 Rehabilitation of Upper East Side Interceptor at Arboretum 6.2<br />
SS-1-24 Rehabilitation of Lower Part of Upper East Side Interceptor 5.7<br />
SS-1-16 Rehabilitation of Slash Run Overflow <strong>Sewer</strong> 2.8<br />
SS-1-28 Rehabilitation of Sheridan Rd Strom <strong>Sewer</strong> 3.4<br />
SS-1-25 Rehabilitation of Upper Middle Part of Upper East Side Interceptor 5.3<br />
SS-1-29 Rehabilitation of Storm <strong>Sewer</strong> on New York Avenue at Hickey Run 1.7<br />
SS-1-05 Rehabilitation of Anacostia Main Interceptor between Grant St and Benning<br />
0.6<br />
Rd, NE<br />
SS-1-06 Rehabilitation of Anacostia Main Interceptor between East Capitol St and<br />
1.8<br />
Fairlawn Ave, NE<br />
SS-1-14 Localized repair on Watts Branch from manhole M-49636 to manhole M-<br />
0.6<br />
40076<br />
SS-1-07 Rehabilitation of West Outfall Relief <strong>Sewer</strong> 27.6<br />
SS-1-10 Rehabilitation of Northwest Boundary Trunk <strong>Sewer</strong> (NWBT) 1.7<br />
SS-1-27 Rehabilitation of Luzon Trunk <strong>Sewer</strong> 0.6
<strong>DC</strong>WASA<br />
<strong>Sewer</strong> <strong>System</strong> Facilties <strong>Plan</strong><br />
<strong>Executive</strong> <strong>Summary</strong><br />
Project ID<br />
Project Title<br />
Total Project<br />
Cost, 2008 $M<br />
SS-1-12 Rehabilitation of Southwest Interceptor 0.3<br />
SS-1-09 Rehabilitation of Lower Oxon Run Interceptor (LOX) 1.7<br />
Subtotal 444.1<br />
Category IB Major <strong>Sewer</strong>-Critical Inspection<br />
SS-1-41 Cleaning and Inspection of Northeast Boundary Trunk <strong>Sewer</strong> Between<br />
McMillan Reservoir and intersection of Maryland Ave & Florida Ave, NE<br />
1.1<br />
SS-1-34 Cleaning and CCTV Inspection of Upper Potomac Interceptor Relief <strong>Sewer</strong> 1.0<br />
SS-1-37 Cleaning and Inspection of East Rock Creek Diversion <strong>Sewer</strong> 1.4<br />
SS-1-30 Cleaning and inspection of AMI from Anacostia Dr, SE, (M-44023) to<br />
0.3<br />
Popular Point Pumping Station<br />
SS-1-43 Cleaning and Inspection of Piney Branch Trunk <strong>Sewer</strong> from Structure N-<br />
0.6<br />
36725 to Structure no 70<br />
SS-1-33 Cleaning and CCTV Inspection of Upper Potomac Interceptor 0.5<br />
SS-1-45<br />
Cleaning and Inspection of Part of Piney Branch Trunk <strong>Sewer</strong>s located<br />
between 5th St, NW and 16th St, NW<br />
SS-1-42 Cleaning and Inspection of East Side Force Main 0.1<br />
SS-1-44 Cleaning and Inspection of Piney Branch Trunk <strong>Sewer</strong> located Southeast of<br />
0.2<br />
Structure no 70<br />
SS-1-39 Cleaning and Inspection of West Rock Creek Diversion <strong>Sewer</strong> 0.1<br />
SS-1-31 Cleaning and CCTV Inspection of Potomac Interceptor Relief <strong>Sewer</strong> 0.3<br />
SS-1-40<br />
Cleaning and Inspection of Slash Run Trunk <strong>Sewer</strong> Between 14th St, NW and<br />
Scott Circle, NW<br />
SS-1-32 Cleaning and CCTV Inspection of Foundry Branch Interceptor 0.2<br />
SS-1-35 Cleaning and Inspection of Broad Branch Trunk <strong>Sewer</strong> 0.2<br />
SS-1-36 Cleaning and Inspection of Broad Branch Trunk Relief <strong>Sewer</strong> 0.1<br />
SS-1-38 Cleaning and Inspection of Rock Creek Main Interceptor Relief <strong>Sewer</strong> 0.1<br />
Subtotal 6.5<br />
Category II Local <strong>Sewer</strong> Rehabilitation<br />
SS-2-01 Cleaning and Inspection of Local Representative <strong>Sewer</strong>s 0.2<br />
SS-2-02 Lining of Local Representative <strong>Sewer</strong>s 13.5<br />
SS-2-04 Rehabilitation of Local <strong>Sewer</strong>s in the Vicinity of Georgetown 6.7<br />
SS-2-03 Point Repair of Local Representative <strong>Sewer</strong>s 1.5<br />
SS-2-05 Rehabilitation of Structures 51, 57, 68 & 78 1.8<br />
Subtotal 23.7<br />
Category III O & M Projects<br />
SS-3-01 Rehabilitation of Structure 35B (Reopen water gate diversion) 0.2<br />
SS-3-02 Supply and install <strong>Sewer</strong> Flow Meters 2.1<br />
0.2<br />
0.1<br />
ES-24
<strong>DC</strong>WASA<br />
<strong>Sewer</strong> <strong>System</strong> Facilties <strong>Plan</strong><br />
<strong>Executive</strong> <strong>Summary</strong><br />
Project ID<br />
Project Title<br />
Total Project<br />
Cost, 2008 $M<br />
SS-3-03 Access Improvement to Str 24 and 34 and manhole Construction 0.8<br />
SS-3-04 Access improvement to NPDES CSO 061 0.6<br />
SS-3-05 Rehabilitation of gates at structures 5A, 5B, 5C and at Poplar Point pumping<br />
1.8<br />
station<br />
SS-3-06 Installation of additional MH to East Outfall <strong>Sewer</strong> 0.3<br />
SS-3-07 Installation of Sluice Gates at main Siphon Chamber (Structure 5A) and<br />
0.2<br />
rehabilitation of historic building at Anacostia river<br />
SS-3-08 Rehabilitation of structures 24 a,b,c and d and construction of access road 0.7<br />
SS-3-09 Prepare operation and maintenance manual for all siphons in Washington, <strong>DC</strong> 0.1<br />
SS-3-10 Modification of Structure 38 0.2<br />
SS-3-11 Rehabilitation of Structure 81 0.2<br />
SS-3-12 Modify Str 56 0.2<br />
SS-3-13 Locate all buried MH in all Major Interceptors 0.6<br />
Category IV Permits & CD Projects<br />
Subtotal 8.0<br />
SS-4-01 East Side Interceptor Inspection (every 5 years) 0.9<br />
SS-4-02 Supply and Install rain gauges 0.050<br />
SS-4-03 Anacostia Siphons (every 10 years) 0.1<br />
Category V Hydraulic Improvement Projects<br />
Subtotal 1.1<br />
Subtotal for 2030 4.9<br />
SS-5-01 AMI & Watts Branch Manhole Reinforcement 0.5<br />
SS-5-02 Easby Point Manhole Reinforcements 0.2<br />
SS-5-03 UPIRS Manhole Reinforcements 0.3<br />
Subtotal 1.0<br />
Category VI Creek Bed <strong>Sewer</strong> Rehabilitation<br />
SS-6-23<br />
<strong>Sewer</strong> Lining & Manhole Rehabilitation around Glover Archibald Park<br />
between Massachusetts Avenue & Davis Place<br />
5.0<br />
ES-25
<strong>DC</strong>WASA<br />
<strong>Sewer</strong> <strong>System</strong> Facilties <strong>Plan</strong><br />
<strong>Executive</strong> <strong>Summary</strong><br />
Project ID<br />
SS-6-14<br />
SS-6-22<br />
SS-6-17<br />
SS-6-20<br />
SS-6-12<br />
SS-6-09<br />
SS-6-21<br />
SS-6-24<br />
SS-6-25<br />
SS-6-08<br />
SS-6-01<br />
SS-6-19<br />
SS-6-26<br />
SS-6-06<br />
SS-6-07<br />
SS-6-04<br />
SS-6-16<br />
SS-6-05<br />
SS-6-10<br />
SS-6-18<br />
Project Title<br />
<strong>Sewer</strong> Lining & Replacement and Manhole Rehabilitation around Rock<br />
Creek, Audoban Terrace & 29th St<br />
<strong>Sewer</strong> & Manhole Replacement & Rehabilitation around Foundry Branch,<br />
39th Street between Upton & Newark<br />
<strong>Sewer</strong> Lining & Manhole Rehabilitation around Klingle Valley, Connecticutt<br />
Ave & Klingle Rd<br />
<strong>Sewer</strong> & Manhole Replacement around Normanstone Park, Rock Creek Drive<br />
& Normanstone Drive<br />
<strong>Sewer</strong> Lining & Manhole Rehabilitation around Broad Branch, Broad Branch<br />
Rd & Linnean Ave<br />
<strong>Sewer</strong> Replacement & Rehabilitation and Structure Rehabilitation around<br />
Pinehurst Branch, Aberfoyle Place & 32nd St<br />
<strong>Sewer</strong> Lining & Manhole Replacement and Rehabilitation around Dumbarton<br />
Oaks, between S St & 32nd St<br />
<strong>Sewer</strong> & Manhole Rehabilitation and Replacement around Palisades Park,<br />
Nebraska Avenue & MacArthur Blvd<br />
<strong>Sewer</strong> Lining & Manhole Rehabilitation around For Stanton Park, Irving St &<br />
Suitland Parkway<br />
<strong>Sewer</strong> & Manhole Rehabilitation around Rock Creek, Sherill Drive & Beach<br />
Drive<br />
<strong>Sewer</strong> & Manhole Replacement around Fenwick Branch, E Beach Dr & Red<br />
Bud Lane<br />
<strong>Sewer</strong> Lining & Manhole Rehabilitation around Rock Creek, Calvert St &<br />
Beach Drive<br />
<strong>Sewer</strong> Lining & Manhole Rehabilitation around Oxon Run, S Capital St & 1st<br />
Street<br />
<strong>Sewer</strong> Lining & Manhole Rehabilitation around Rock Creek, Beach Drive<br />
north of Sherrill Drive<br />
<strong>Sewer</strong> Lining & Manhole Rehabilitation around Pinehurst Branch, at Oregon<br />
Knolls Drive<br />
<strong>Sewer</strong> Lining & Manhole Rehabilitation around Rock Creek, Beach Drive @<br />
MD Border (Western Ave extended)<br />
<strong>Sewer</strong> Lining & Manhole Rehabilitation around Rock Creek, Tilden St &<br />
Shoemaker St<br />
<strong>Sewer</strong> Lining & Manhole Rehabilitation around Rock Creek, Wise Rd &<br />
Beach Drive<br />
<strong>Sewer</strong> Lining & Manhole Rehabilitation around Rock Creek, Beach Drive<br />
north of Military Rd<br />
<strong>Sewer</strong> Lining & Manhole Rehabilitation around National Zoo, Beach Drive &<br />
Harvard St<br />
Total Project<br />
Cost, 2008 $M<br />
3.9<br />
3.8<br />
3.3<br />
2.8<br />
1.6<br />
1.6<br />
1.5<br />
1.2<br />
0.9<br />
0.5<br />
0.4<br />
4.3<br />
3.6<br />
1.8<br />
1.7<br />
1.6<br />
1.6<br />
1.5<br />
1.4<br />
1.0<br />
ES-26
<strong>DC</strong>WASA<br />
<strong>Sewer</strong> <strong>System</strong> Facilties <strong>Plan</strong><br />
<strong>Executive</strong> <strong>Summary</strong><br />
Project ID<br />
SS-6-03<br />
SS-6-02<br />
SS-6-11<br />
SS-6-15<br />
SS-6-13<br />
Project Title<br />
<strong>Sewer</strong> Lining & Manhole Rehabilitation around Rock Creek, Kalmia Rd & W<br />
Beach Drive<br />
<strong>Sewer</strong> Lining & Manhole Rehabilitation around Rock Creek, N Portal Drive<br />
& Spruce Drive<br />
<strong>Sewer</strong> Lining & Manhole Rehabilitation around Rock Creek, Joyce Rd & 16th<br />
St<br />
<strong>Sewer</strong> Lining & Manhole Rehabilitation around Rock Creek, Blagden Rd &<br />
Beach Drive<br />
Manhole Rehabilitation around Broad Branch, between 27th St & Brandywine<br />
St<br />
Total Project<br />
Cost, 2008 $M<br />
1.0<br />
0.4<br />
0.4<br />
0.3<br />
1.2<br />
Subtotal 48.3<br />
Total 536.5<br />
6.2 Service Life Improvements<br />
Prior to the formation of the <strong>DC</strong>WASA in 1996, capital expenditures for sewer needs were kept low<br />
due to frozen sewer rates that lasted for 10 years. In addition, other agency programs needed funding<br />
at a higher priority than the sewer infrastructure program. The Authority should now invest in a<br />
program to repair and maintain the sewer collection systems in order to assure reliable sewer service<br />
into the future.<br />
Repairing and maintaining a collection system is critical to its reliability and performance. These<br />
activities include inspecting, cleaning, repairing and lining sewer pipes and maintaining an integrated<br />
computer database system for safe records keeping. Within the Department of <strong>Sewer</strong> Services (DSS)<br />
four branches are responsible for maintaining the collection system, the Pumping Branch, the<br />
Inspection and Maintenance (I&M) Branch, Construction and Repair Branch and Potomac<br />
Interceptor Branch. These Branches have been actively engaged in maintaining the sewer service<br />
availability for the users of the system.<br />
It was determined that two intervention mechanisms were needed in order to preserve the sewer<br />
system and extend the period of service. These were fixing problems identified prior to loss of<br />
service or loss of shape of the sewer pipe and adopting a regular sewer inspection and rehabilitation<br />
program designed to provide advanced planning for scheduling the work.<br />
Inspection programs should maintain a regular schedule in order to identify and solve problems<br />
before users are impacted. An inspection program can typically include closed circuit television,<br />
sonar imaging, smoke testing, dye testing, manhole inspection, and flow monitoring. When<br />
performing inspections, it is crucial to maintain consistency and effectiveness by employing a<br />
standard inspection method. Many cities such as Chicago, Milwaukee, Indianapolis and San Diego<br />
employ some variation of a standard set sewer defect codes updated by NASSCO for remote and<br />
manual CCTV and sonar inspections. The standard operating procedures should also include<br />
information on the frequency of inspection. This frequency varies by utility depending on the<br />
ES-27
<strong>DC</strong>WASA<br />
<strong>Sewer</strong> <strong>System</strong> Facilties <strong>Plan</strong><br />
<strong>Executive</strong> <strong>Summary</strong><br />
conditions present within the collection system.<br />
Presented in Table ES-8 are the recommended inspection frequencies compliant with the NPDES<br />
permit and extended to other system components based on engineering judgment. Once the<br />
procedures are established and followed and data is collected, WASA managers can make informed<br />
decisions as to where and when resources should be applied. This can include necessary cleaning,<br />
root control, repairs, and an ongoing re-lining of the existing sewers.<br />
Table ES-8: Inspection Frequency Annual Cost<br />
<strong>Sewer</strong> Type<br />
Inspect. Length of Size Avg <strong>Sewer</strong> Inspect. Length<br />
Freq. sewer Range Size per Year<br />
Total Cost<br />
Years LF in in LF 2008 $K<br />
Required by NPDES permit<br />
Major <strong>Sewer</strong>s<br />
Major Combined<br />
25 445,620 18-288 84 18,000 373.8<br />
<strong>Sewer</strong>s<br />
Outfall <strong>Sewer</strong>s 25 69,140 60-165 120 3,000 62.3<br />
Force Main 10 75,120 48-108 96 8,000 166.1<br />
Subtotal 589,880 29,000 602.2<br />
Local <strong>Sewer</strong>s<br />
Siphon 10 9,800 12-108 60 1,000 20.8<br />
<strong>Sewer</strong>s Under<br />
15 140,700 8-288 24 9,000 72.4<br />
Buildings<br />
All Other <strong>Sewer</strong>s<br />
Sanitary <strong>Sewer</strong>s 25 3,564,170 8-96 18 143,000 1,149.9<br />
Other combined &<br />
storm sewers 25 5,489,240 8-288 18 220,000 1,769.1<br />
Subtotal 9,203,910 373,000 3,012.2<br />
Total 9,793,790 402,000 3,614.4<br />
Currently, the DSS cleans segments to restore customer service and on as needed basis which has<br />
resulted in a backlog of sewer segments requiring cleaning. To clean the sewer system the DSS<br />
currently has one (1) four-person bucket machine crew and two (2), two-person jet-vactor crews<br />
performing sewer cleaning. Crews operate during weekdays and are mobilized as needed for<br />
emergencies after hours and on weekends/holidays. In order to decrease the cleaning backlog<br />
dedicating one or more crews to this effort is critical. Undertaking an aggressive heavy cleaning<br />
program followed by a routine cleaning program with dedicated crews is recommended to expel<br />
existing accumulation and prevent significant accumulation within the system.<br />
The recommended annual program for cleaning the sewer system was based on the percentage of<br />
pipelines needing cleaning found during the sewer assessment program and is estimated in Table<br />
ES-9.<br />
Table ES-9 Cleaning Frequency Annual Cost<br />
ES-28
<strong>DC</strong>WASA<br />
<strong>Sewer</strong> <strong>System</strong> Facilties <strong>Plan</strong><br />
<strong>Executive</strong> <strong>Summary</strong><br />
<strong>Sewer</strong> Component<br />
Inspection<br />
Frequency<br />
Length of<br />
sewer<br />
Size<br />
Range<br />
Average<br />
<strong>Sewer</strong><br />
Size<br />
Cleaning<br />
Length per<br />
Year<br />
Total Cost<br />
Years LF in in LF 2008, $K<br />
Major <strong>Sewer</strong>s<br />
Major Combined<br />
25 445,620 18-288 84 7,200 225.4<br />
<strong>Sewer</strong>s<br />
Outfall <strong>Sewer</strong>s 25 69,140 60-165 120 1,200 61.0<br />
Force Main 10 75,120 48-108 96 3,200 120.1<br />
Subtotal 589,880 11,600 406.5<br />
Local <strong>Sewer</strong>s<br />
Siphons 10 9,800 12-108 60 1,000 22.4<br />
<strong>Sewer</strong>s Under<br />
15 140,700 8-288 24 3,600 56.3<br />
Buildings<br />
Sanitary <strong>Sewer</strong>s 25 3,564,170 6-33 15 57,200 796.8<br />
Other combined &<br />
25<br />
6-33 15 110,000 1,532.2<br />
storm sewers<br />
5,489,240<br />
Subtotal 9,203,910 171,800 2,407.7<br />
Total 9,793,790 183,400 2,814.2<br />
The <strong>Sewer</strong> Assessment Program (SAP) was used to determine the condition of selected storm,<br />
sanitary and combined sewer segments. A continuous asset assessment program is recommended<br />
above to help avoid service disruptions and also to provide an engineering basis for needed<br />
improvements. An inspection goal of 76 miles per year of various sewer types has been set based on<br />
the frequency above. An assessment of the condition and of the necessary work should be identified<br />
to determine which pipes require cleaning, repair, lining, or replacement.<br />
A regular rehabilitation program is recommended to address problems associated with local sewers<br />
(size
<strong>DC</strong>WASA<br />
<strong>Sewer</strong> <strong>System</strong> Facilties <strong>Plan</strong><br />
<strong>Executive</strong> <strong>Summary</strong><br />
Inspections results of major sewers, force mains and outfalls are expected to result in additional<br />
rehabilitation projects. For this reason, an allowance in the amount of $10M a year has been<br />
allocated. Table ES-10 summarizes the proposed service life improvement program.<br />
Table ES-10 Service Life Improvement Program<br />
Program Approx Quantity Frequency Annual Cost (2008, $M)<br />
Major <strong>Sewer</strong>s<br />
Inspection 29,000 LF/year Approx 20 yr cycle 0.6<br />
Cleaning 11,600 LF/year Approx 50 yr cycle 0.4<br />
Allowance for rehabilitation 10.0<br />
Subtotal 11.0<br />
Local <strong>Sewer</strong>s<br />
Inspection of sewer pipes 373,000 LF/year Approx 25 yr cycle 3.0 1<br />
Cleaning of sewers 171,800 LF/year Approx 55 yr cycle 2.4<br />
Rehabilitation of local sewers 79,500 LF/year Approx 85 yr cycle 17.65<br />
MH rehabilitation 2,400 (#/year) Approx 25 yr cycle 3.2<br />
Subtotal 26.1<br />
Total Cost 37.1<br />
1 $2.0M in current approved 10 year CIP.<br />
ES-30
DISTRICT OF COLUMBIA<br />
WATER AND SEWER AUTHORITY<br />
Serving the Public • Protecting the Environment<br />
www.dcwasa.com