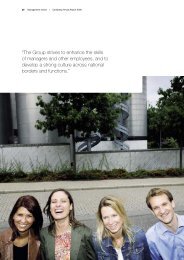
Q2 Shareholder M agazine August 2012 - Carlsberg Group
Q2 Shareholder M agazine August 2012 - Carlsberg Group
Q2 Shareholder M agazine August 2012 - Carlsberg Group

You also want an ePaper? Increase the reach of your titles
YUMPU automatically turns print PDFs into web optimized ePapers that Google loves.
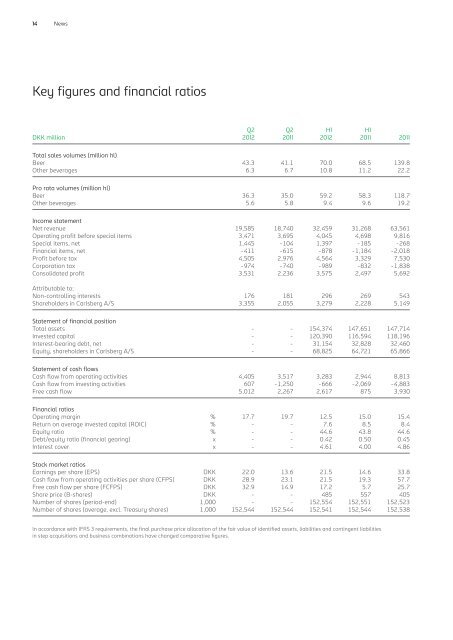
14 News<br />
Key figures and financial ratios<br />
<strong>Q2</strong> <strong>Q2</strong> H1 H1<br />
DKK million <strong>2012</strong> 2011 <strong>2012</strong> 2011 2011<br />
Total sales volumes (million hl)<br />
Beer 43.3 41.1 70.0 68.5 139.8<br />
Other beverages 6.3 6.7 10.8 11.2 22.2<br />
Pro rata volumes (million hl)<br />
Beer 36.3 35.0 59.2 58.3 118.7<br />
Other beverages 5.6 5.8 9.4 9.6 19.2<br />
Income statement<br />
Net revenue 19,585 18,740 32,459 31,268 63,561<br />
Operating profit before special items 3,471 3,695 4,045 4,698 9,816<br />
Special items, net 1,445 -104 1,397 -185 -268<br />
Financial items, net -411 -615 -878 -1,184 -2,018<br />
Profit before tax 4,505 2,976 4,564 3,329 7,530<br />
Corporation tax -974 -740 -989 -832 -1,838<br />
Consolidated profit 3,531 2,236 3,575 2,497 5,692<br />
Attributable to:<br />
Non-controlling interests 176 181 296 269 543<br />
<strong>Shareholder</strong>s in <strong>Carlsberg</strong> A/S 3,355 2,055 3,279 2,228 5,149<br />
Statement of financial position<br />
Total assets - - 154,374 147,651 147,714<br />
Invested capital - - 120,390 116,594 118,196<br />
Interest-bearing debt, net - - 31,154 32,828 32,460<br />
Equity, shareholders in <strong>Carlsberg</strong> A/S - - 68,825 64,721 65,866<br />
Statement of cash flows<br />
Cash flow from operating activities 4,405 3,517 3,283 2,944 8,813<br />
Cash flow from investing activities 607 -1,250 -666 -2,069 -4,883<br />
Free cash flow 5,012 2,267 2,617 875 3,930<br />
Financial ratios<br />
Operating margin % 17.7 19.7 12.5 15.0 15.4<br />
Return on average invested capital (ROIC) % - - 7.6 8.5 8.4<br />
Equity ratio % - - 44.6 43.8 44.6<br />
Debt/equity ratio (financial gearing) x - - 0.42 0.50 0.45<br />
Interest cover x - - 4.61 4.00 4.86<br />
Stock market ratios<br />
Earnings per share (EPS) DKK 22.0 13.6 21.5 14.6 33.8<br />
Cash flow from operating activities per share (CFPS) DKK 28.9 23.1 21.5 19.3 57.7<br />
Free cash flow per share (FCFPS) DKK 32.9 14.9 17.2 5.7 25.7<br />
Share price (B-shares) DKK - - 485 557 405<br />
Number of shares (period-end) 1,000 - - 152,554 152,551 152,523<br />
Number of shares (average, excl. Treasury shares) 1,000 152,544 152,544 152,541 152,544 152,538<br />
In accordance with IFRS 3 requirements, the final purchase price allocation of the fair value of identified assets, liabilities and contingent liabilities<br />
in step acquisitions and business combinations have changed comparative figures.

![[Name and Address] - Carlsberg Group](https://img.yumpu.com/49766377/1/184x260/name-and-address-carlsberg-group.jpg?quality=85)
![[Name and Address] - Carlsberg Group](https://img.yumpu.com/49015962/1/184x260/name-and-address-carlsberg-group.jpg?quality=85)