Slow Electron Velocity-Map Imaging of Negative Ions: Applications ...
Slow Electron Velocity-Map Imaging of Negative Ions: Applications ...
Slow Electron Velocity-Map Imaging of Negative Ions: Applications ...

Create successful ePaper yourself
Turn your PDF publications into a flip-book with our unique Google optimized e-Paper software.
Centennial Feature Article J. Phys. Chem. A, Vol. 112, No. 51, 2008 13297<br />
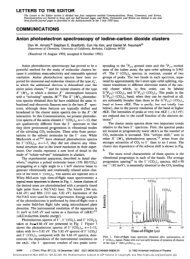
Figure 11. SEVI spectra <strong>of</strong> ClH 2 - (left) and ClD 2 - (right). Top panels are transitions to Cl( 2 P 3/2 ) ···H 2 and Cl( 2 P 3/2 ) ···D 2 , bottom panels are<br />
transitions to Cl( 2 P 1/2 ) ···H 2 and Cl( 2 P 1/2 ) ···D 2 . Spectral assignments are indicated. Results from adiabatic (dashed blue) and nonadiabatic (solid<br />
red) simulations are also shown.<br />
Figure 12. SEVI spectra <strong>of</strong> Cl-(CH 4 ). Top panels, left and right, show transitions to Cl( 2 P 3/2 ) ···CH 4 and Cl( 2 P 1/2 ) ···CH 4 , respectively, while<br />
bottom panel shows Cl( 2 P 3/2 ) ···CD 4 band.<br />
is retained, <strong>of</strong> the splitting between the bend-stretch levels<br />
associated with the 2 Σ 1/2 and 2 Π 1/2 states. For example, in<br />
the ClH 2 spectra, the splitting between the (j ) 1, ν s ) 0)<br />
levels associated with these two states is reduced from 902<br />
to 888 cm - 1 , in excellent agreement with the value <strong>of</strong> 887<br />
cm - 1 found experimentally. Similarly, in ClD 2 , the spacing<br />
between the (j ) 0, V s ) 0) levels is reduced from 908 to<br />
900 cm - 1 which exactly matches the experimental spectra.<br />
These reductions can be explained in terms <strong>of</strong> small changes<br />
in the shapes <strong>of</strong> the adiabatic-bender potentials induced by<br />
the spin-orbit, Coriolis and electrostatic couplings, and the<br />
resulting changes in the energies <strong>of</strong> the bend-stretch van<br />
der Waals levels in the two electronic states.<br />
The comparison between experimental and calculated<br />
spectra in Figure 11 leads to two important conclusions<br />
regarding the Cl + H 2 reaction. First, the level <strong>of</strong> agreement