Slow Electron Velocity-Map Imaging of Negative Ions: Applications ...
Slow Electron Velocity-Map Imaging of Negative Ions: Applications ...
Slow Electron Velocity-Map Imaging of Negative Ions: Applications ...

Create successful ePaper yourself
Turn your PDF publications into a flip-book with our unique Google optimized e-Paper software.
Feature Article<br />
Subscriber access provided by - Access paid by the | UC Berkeley Library<br />
<strong>Slow</strong> <strong>Electron</strong> <strong>Velocity</strong>-<strong>Map</strong> <strong>Imaging</strong> <strong>of</strong> <strong>Negative</strong><br />
†<br />
<strong>Ions</strong>: <strong>Applications</strong> to Spectroscopy and Dynamics<br />
Daniel M. Neumark<br />
J. Phys. Chem. A, 2008, 112 (51), 13287-13301 • DOI: 10.1021/jp807182q • Publication Date (Web): 26 November 2008<br />
Downloaded from http://pubs.acs.org on January 16, 2009<br />
More About This Article<br />
Additional resources and features associated with this article are available within the HTML version:<br />
• Supporting Information<br />
• Access to high resolution figures<br />
• Links to articles and content related to this article<br />
• Copyright permission to reproduce figures and/or text from this article<br />
The Journal <strong>of</strong> Physical Chemistry A is published by the American Chemical<br />
Society. 1155 Sixteenth Street N.W., Washington, DC 20036
CENTENNIAL FEATURE ARTICLE<br />
J. Phys. Chem. A 2008, 112, 13287–13301 13287<br />
<strong>Slow</strong> <strong>Electron</strong> <strong>Velocity</strong>-<strong>Map</strong> <strong>Imaging</strong> <strong>of</strong> <strong>Negative</strong> <strong>Ions</strong>: <strong>Applications</strong> to Spectroscopy and<br />
Dynamics †<br />
Daniel M. Neumark*<br />
Department <strong>of</strong> Chemistry, UniVersity <strong>of</strong> California, Berkeley, California 94720, and Chemical Sciences<br />
DiVision, Lawrence Berkeley National Laboratory, Berkeley, California 94720<br />
ReceiVed: August 12, 2008; ReVised Manuscript ReceiVed: October 7, 2008<br />
Anion photoelectron spectroscopy (PES) has become one <strong>of</strong> the most versatile techniques in chemical physics.<br />
This article briefly reviews the history <strong>of</strong> anion PES and some <strong>of</strong> its applications. It describes efforts to<br />
improve the resolution <strong>of</strong> this technique, including anion zero electron kinetic energy (ZEKE) and the recently<br />
developed method <strong>of</strong> slow electron velocity-map imaging (SEVI). <strong>Applications</strong> <strong>of</strong> SEVI to studies <strong>of</strong> vibronic<br />
coupling in open-shell systems and the spectroscopy <strong>of</strong> prereactive van der Waals complexes are then discussed.<br />
I. Introduction<br />
Since its first implementation in 1967, 1 anion photoelectron<br />
spectroscopy (PES) has evolved into a highly versatile technique<br />
capable <strong>of</strong> addressing fundamental problems in spectroscopy<br />
and chemical dynamics. In PES, outlined schematically in Figure<br />
1, mass selected negative ions are photodetached with a fixedfrequency<br />
light source, typically a pulsed or intense cw laser,<br />
and the resulting kinetic energy and angular distribution <strong>of</strong> the<br />
ejected photoelectrons are measured:<br />
ABC - hν<br />
98 ABC + e<br />
-<br />
The neutral species ABC can be any species with a positive<br />
electron affinity, including some closed shell molecules and most<br />
free radicals. The PE spectrum then yields the electron affinity<br />
<strong>of</strong> ABC, the energetics <strong>of</strong> those excited electronic states that<br />
are accessible at the photodetachment energy, and, in favorable<br />
cases, vibrational frequencies for the active vibrational modes<br />
in each observed electronic state. The intensity progressions in<br />
these modes probe changes in geometry between the anion and<br />
neutral electronic states.<br />
Since the anions are mass-selected prior to photodetachment,<br />
anion PES has proved extremely useful in elucidating energetic<br />
and spectroscopic trends in studies <strong>of</strong> size-selected clusters,<br />
where, for example, it can be used to probe the electronic states<br />
<strong>of</strong> a neutral metal cluster as a function <strong>of</strong> the number <strong>of</strong><br />
constituent atoms, mapping out the evolution <strong>of</strong> electronic<br />
structure from the atomic to bulk limits. 2-8 Alternatively, one<br />
can study the energetic and spectroscopic effects <strong>of</strong> stepwise<br />
solvation<strong>of</strong>anionsrangingfromatomichalidestobiomolecules, 9-12<br />
† 2008 marked the Centennial <strong>of</strong> the American Chemical Society’s<br />
Division <strong>of</strong> Physical Chemistry. To celebrate and to highlight the field <strong>of</strong><br />
physical chemistry from both historical and future perspectives, The Journal<br />
<strong>of</strong> Physical Chemistry is publishing a special series <strong>of</strong> Centennial Feature<br />
Articles. These articles are invited contributions from current and former<br />
<strong>of</strong>ficers and members <strong>of</strong> the Physical Chemistry Division Executive<br />
Committee and from J. Phys. Chem. Senior Editors.<br />
* To whom correspondence should be addressed. E-mail: dneumark@<br />
berkeley.edu.<br />
(1)<br />
and the solvation <strong>of</strong> electrons by water, 13-15 ammonia, 16,17 and<br />
other solvent molecules. 18,19 The species ABC does not have to<br />
be a stable species at all and, in fact, can be a transition state<br />
for a bimolecular or unimolecular chemical reaction. In such a<br />
case PES provides a means <strong>of</strong> carrying out “transition state<br />
spectroscopy”, yielding vibrational levels <strong>of</strong> this elusive species,<br />
which is <strong>of</strong> central importance to much <strong>of</strong> chemistry. 20,21 Finally,<br />
the anion can have multiple negative charges, enabling gas phase<br />
studies <strong>of</strong> the multiply charged anions that play a key role in<br />
aqueous solution chemistry. 22<br />
A key factor in the versatility <strong>of</strong> anion PES is its relative<br />
simplicity; the information described above can generally be<br />
obtained at a single or at most a small number <strong>of</strong> detachment<br />
wavelengths. Hence, the photoelectron spectrum <strong>of</strong> any negative<br />
ion can, in principle, be measured with a reasonably simple laser<br />
system. However, this simplicity comes at a cost in energy<br />
resolution, which is determined not by the light source but the<br />
method used to analyze the electron kinetic energy distribution.<br />
This resolution is typically limited to 5-10 meV and can be<br />
much poorer. At this level <strong>of</strong> resolution, one can resolve<br />
vibrational and electronic fine structure in small molecules with<br />
a relatively sparse manifold <strong>of</strong> vibrational levels, but in species<br />
such as metal or semiconductor clusters, where there are<br />
typically numerous low-frequency vibrational modes, vibrational<br />
structure can be resolved only in favorable cases. When only<br />
electronic structure is resolved in cluster photoelectron spectra,<br />
one can infer structural information through comparison with<br />
electronic structure calculations, but there is considerably more<br />
ambiguity in the interpretation <strong>of</strong> the spectrum.<br />
These considerations have driven efforts to develop photodetachment<br />
experiments that <strong>of</strong>fer better resolution than PES<br />
while retaining as much <strong>of</strong> its flexibility and versatility as<br />
possible. One such method is anion zero electron kinetic energy<br />
(ZEKE) spectroscopy, 23 based on the analogous method developed<br />
for neutral species in the mid 1980s. 24,25 In anion ZEKE<br />
spectroscopy, as indicated in Figure 1, anions are detached with<br />
a tunable laser, and only those electrons produced with nearly<br />
zero kinetic energy are detected. Anion ZEKE indeed <strong>of</strong>fers<br />
energy resolution as high as 0.1-0.2 meV, considerably better<br />
10.1021/jp807182q CCC: $40.75 © 2008 American Chemical Society<br />
Published on Web 11/26/2008
13288 J. Phys. Chem. A, Vol. 112, No. 51, 2008 Neumark<br />
Daniel M. Neumark is currently Pr<strong>of</strong>essor <strong>of</strong> Chemistry at the University<br />
<strong>of</strong> California, Berkeley and has been Director <strong>of</strong> the Chemical Sciences<br />
Division at Lawrence Berkeley National Laboratory since 2000. He earned<br />
a B.A. and an M.A. from Harvard University in 1977 and a Ph.D. in Physical<br />
Chemistry from the University <strong>of</strong> California, Berkeley in 1984. His research<br />
focuses on chemical dynamics, spectroscopy, and cluster science, with<br />
particular emphasis on using negative ion photodetachment to probe<br />
transition states, radicals, and other transient species. More recent interests<br />
include developing femtosecond and attosecond light sources in the vacuum<br />
ultraviolet and s<strong>of</strong>t X-ray regimes to probe novel aspects <strong>of</strong> chemical<br />
reaction and cluster dynamics.<br />
than PES, and has been used to study small molecular species,<br />
clusters, and one transition state. 26 However, as discussed in<br />
the following section, it is experimentally quite challenging.<br />
Moreover, owing to the fundamental physics <strong>of</strong> negative ion<br />
photodetachment, 27 it is applicable only to a relatively small<br />
subset <strong>of</strong> negative ions.<br />
Recently, we have developed a somewhat different approach<br />
to this problem based on a photoelectron imaging technique,<br />
slow electron velocity-map imaging (SEVI), 28 which <strong>of</strong>fers<br />
photoelectron energy resolution comparable to that <strong>of</strong> anion<br />
ZEKE while retaining much <strong>of</strong> the versatility <strong>of</strong> PES. In SEVI,<br />
as indicated in Figure 1, one collects photoelectrons over a<br />
relatively narrow energy range at a discrete number <strong>of</strong> detachment<br />
wavelengths. In this sense, it is a hybrid between PES,<br />
where all electrons produced at a single wavelength are detected,<br />
and ZEKE, in which only near-zero energy electrons are detected<br />
as a function <strong>of</strong> a continuously tunable photodetachment<br />
wavelength. In SEVI, one essentially obtains a series <strong>of</strong> high<br />
resolution photoelectron spectra, each over a restricted energy<br />
range (typically 50-100 meV), that can be pieced together to<br />
generate a complete spectrum. In the relatively short time that<br />
has elapsed since SEVI was first introduced, it has been applied<br />
to a series <strong>of</strong> free radicals, clusters, prereactive van der Waals<br />
complexes, and reaction transition states.<br />
In the following sections, the experimental principles and<br />
methodologies underlying anion PES, ZEKE, and SEVI are<br />
reviewed in more detail, with particular focus on the implementation<br />
and capabilities <strong>of</strong> SEVI. Several published and<br />
preliminary SEVI spectra are presented to illustrate its versatility<br />
and potential.<br />
II. Review <strong>of</strong> Experimental Methods<br />
A. Brief Review <strong>of</strong> Anion Photoelectron Spectroscopy.<br />
Anion photoelectron spectroscopy has its roots in the photoelectron<br />
spectroscopy <strong>of</strong> neutral species, 29,30 which was originally<br />
done using the vacuum ultraviolet light from discharge<br />
lamps or synchrotrons. Nearly all the electron energy analysis<br />
schemes used in anion experiments are adapted from methods<br />
developed for neutrals. In experiments on negative ions, target<br />
Figure 1. Comparison <strong>of</strong> anion photoelectron spectroscopy (left), zero<br />
electron kinetic energy (ZEKE) spectroscopy (center), and slow electron<br />
velocity-map imaging (SEVI, right).<br />
number densities are typically less than 10 6 /cm 3 , many orders<br />
<strong>of</strong> magnitude lower than in experiments on neutral gas phase<br />
species. On the other hand, most anions can be photodetached<br />
at photon energies <strong>of</strong> 5 eV or less, allowing one to use intense<br />
visible or ultraviolet lasers that compensate for the lower target<br />
densities.<br />
Anion photoelectron spectroscopy experiments were originally<br />
performed using a intracavity, cw Ar ion lasers to<br />
photodetach the ions and a hemispherical energy analyzer to<br />
determine the electron kinetic energy distribution. 1,31-33 This<br />
technology was perfected over many years in the laboratories<br />
<strong>of</strong> Lineberger, 34,35 Hotop, 36 and others, 37-39 yielding an electron<br />
kinetic energy (eKE) resolution as high as 5 meV. This<br />
experimental configuration is very versatile and can be combined<br />
with ion sources such as hot discharges, sputter sources, and<br />
flowing afterglows, enabling studies <strong>of</strong> a wide variety <strong>of</strong><br />
negative ions. Indeed, far more small molecule electron affinities<br />
have been determined using this methodology than any other. 40<br />
Its primary limitation is the maximum photon energy that can<br />
be reached with an intracavity Ar + laser, which is determined<br />
by the available transitions in the lasing medium; as <strong>of</strong> yet, 3.5<br />
eV is the maximum photon energy at which PE spectra have<br />
been obtained with this configuration. 41<br />
In these experiments, the photoelectron angular distribution<br />
(PAD) can also be determined at each eKE by measuring the<br />
photoelectron intensity as a function <strong>of</strong> the angle θ between<br />
the electric field vector <strong>of</strong> the laser and the detection axis <strong>of</strong><br />
the hemispherical analyzer. For single-photon detachment, 42 the<br />
PAD is given by<br />
I(θ) ) σ<br />
4π (1 + βP 2 (cos θ)) (2)<br />
where σ is the photodetachment cross section and β, the<br />
anisotropy parameter, varies from -1 to 2. The PAD and<br />
anisotropy parameter reflect the coherent superposition <strong>of</strong> partial<br />
waves <strong>of</strong> orbital angular momentum l produced by photodetachment.<br />
The anisotropy parameter is sensitive to the symmetry<br />
<strong>of</strong> the atomic or molecular orbital from which detachment occurs<br />
and to the final state produced by photodetachment. 43 While it<br />
is difficult to predict the value <strong>of</strong> β from first principles, its<br />
measurement can disentangle overlapping electronic bands and<br />
discern the presence <strong>of</strong> vibronic coupling between neutral<br />
electronic states.
Centennial Feature Article J. Phys. Chem. A, Vol. 112, No. 51, 2008 13289<br />
In the 1980s, the development <strong>of</strong> pulsed ion sources and the<br />
desire to extend anion photoelectron spectroscopy further into<br />
the ultraviolet motivated a new generation <strong>of</strong> spectrometers<br />
based on pulsed laser photodetachment. 44 In these instruments,<br />
the first example <strong>of</strong> which was demonstrated by Johnson and<br />
co-workers, 45 anions are mass-selected by time-<strong>of</strong>-flight (TOF),<br />
ions <strong>of</strong> the desired mass are detached using a pulsed laser, and<br />
the resulting photoelectrons are energy-analyzed in a second<br />
TOF system. The anion sources typically involve pulsed<br />
molecular beam valves coupled to an electron gun, 46 an electric<br />
discharge, 47 or a laser-vaporization setup, 3,48 depending on<br />
whether gas phase or solid precursors are being used. The<br />
photodetachment wavelength can be a harmonic <strong>of</strong> a Nd:YAG<br />
laser, with harmonics up to the fifth harmonic (213 nm, 5.82<br />
eV) 49 easily accessible via nonlinear frequency-doubling and<br />
mixing schemes, or an excimer laser wavelength which can be<br />
as low as 157 nm (7.8 eV). 50 Very recently, anion photoelectron<br />
spectra have been reported using the ninth harmonic <strong>of</strong> a Nd:<br />
YAG laser at 118 nm (10.8 eV). 51<br />
Both field-free and magnetic-bottle TOF analyzers have been<br />
extensively used to analyze the electron kinetic energy distribution.<br />
In field-free TOF, 45,49 photodetachment occurs in a<br />
magnetically shielded region and a small fraction <strong>of</strong> the<br />
photoelectrons are detected by a microchannel plate (MCP)<br />
detector lying 50-100 cm from the interaction region. In a<br />
magnetic bottle, an inhomogeneous magnetic field directs the<br />
photoelectrons ejected over a wide angular range to a MCP<br />
detector. 52,53 The field-free arrangement <strong>of</strong>fers lower collection<br />
efficiency but higher resolution, as good as 5-10 meV. The<br />
resolution <strong>of</strong> the magnetic bottle suffers from severe Doppler<br />
broadening effects for ion beams in the keV range (a typical<br />
value in a TOF mass spectrometer), 54 but several laboratories<br />
have achieved resolution in the 10-40 meV range by slowing<br />
the ion beam or electrons in the laser interaction region. 55-58<br />
Another, more recent approach to anion photoelectron<br />
spectroscopy, pioneered by Bordas, 59,60 Sanov, 61,62 and their coworkers,<br />
makes use <strong>of</strong> photoelectron velocity-map imaging to<br />
detect and analyze the photoelectrons. These experiments build<br />
upon the phot<strong>of</strong>ragment and photoelectron imaging studies first<br />
carried out by Chandler 63,64 and Helm, 65 respectively, and the<br />
discovery <strong>of</strong> velocity-map imaging (VMI) by Parker and coworkers,<br />
66 which greatly improved the energy resolution <strong>of</strong> both<br />
photoion and photoelectron imaging, resulting in the widespread<br />
use <strong>of</strong> both techniques in frequency and time-domain experiments.<br />
67-72<br />
In anion photoelectron imaging, the ions are photodetached<br />
in a DC field <strong>of</strong> several hundred V/cm and the electrons are<br />
accelerated toward a MCP detector coupled to a phosphor<br />
screen. The resulting image <strong>of</strong> the photoelectrons is recorded<br />
by a CCD camera. The image is the projection <strong>of</strong> the<br />
photoelectron three-dimensional velocity distribution onto a twodimensional<br />
plane; the original 3-D distribution can be recovered<br />
using well-established methods, thus yielding the photoelectron<br />
kinetic energy and angular distribution. Photoelectron imaging<br />
<strong>of</strong>fers high collection efficiency with a typical energy resolution<br />
<strong>of</strong> 2-5%, although Cavanagh et al. 73 have improved on this<br />
considerably. In the usual mode <strong>of</strong> operation, where the DC<br />
fields are high enough to collect all the photoelectrons, 2-5%<br />
energy resolution is not very high, i.e., 20-50 meV for an<br />
electron kinetic energy <strong>of</strong> 1 eV. However, as detailed later in<br />
this section, the absolute energy resolution can be very high if<br />
one focuses only on the slow electrons; this is the basis <strong>of</strong> SEVI.<br />
B. Anion ZEKE Spectroscopy. Experiments on neutral<br />
molecules by Schlag and Muller-Dethlefs 24,25 in the 1980s<br />
showed that one could improve on the resolution <strong>of</strong> photoelectron<br />
spectroscopy dramatically using a new technique, zero<br />
electron kinetic energy (ZEKE) spectroscopy. This work<br />
motivated the development <strong>of</strong> the analogous anion experiment<br />
in our laboratory 23,26 and elsewhere. 74-76 In anion ZEKE<br />
spectroscopy, mass-selected anions are photodetached with a<br />
tunable pulsed laser, and only those electrons with nearly zero<br />
kinetic energy are collected as the laser is scanned. The near<br />
ZEKE and higher energy electrons are allowed to separate<br />
spatially for ∼200 ns after the laser pulse fires, after which a<br />
weak pulsed electric field is applied to extract and detect the<br />
slow electrons; selective detection <strong>of</strong> the ZEKE electrons is<br />
achieved by a combination <strong>of</strong> spatial and temporal filtering.<br />
ZEKE signal is seen when the laser passes through a<br />
photodetachment threshold between an anion and neutral level.<br />
Because only a very small range <strong>of</strong> kinetic energies (shaded<br />
areas in Figure 1) is collected at each laser wavelength, many<br />
small energy steps are required to record a full spectrum. The<br />
energy resolution can be as high as 1 cm -1 , but ZEKE spectra<br />
<strong>of</strong> most molecular anions have features at least 8-10 cm -1 wide<br />
owing to unresolved rotational structure. 77<br />
The physics <strong>of</strong> anion ZEKE are quite different than in neutral<br />
ZEKE experiments, which are now understood to involve pulsed<br />
field ionization <strong>of</strong> very high Rydberg states. 78,79 The near-zero<br />
energy electrons produced in the anion experiments are extremely<br />
sensitive to stray electric and magnetic fields, making<br />
these experiments quite difficult. In addition to the experimental<br />
difficulties, anion ZEKE spectroscopy is further complicated<br />
by the Wigner threshold law 80 which predicts the photodetachment<br />
cross-section σ to be<br />
σ∝(hν - E th ) l+1⁄2 (3)<br />
where hν - E th is the energy difference between the photodetachment<br />
laser and detachment threshold, and l is the angular<br />
momentum <strong>of</strong> the photoelectron. Clearly, σ is always zero at<br />
threshold and increases rapidly with photon energy only if l is<br />
zero (s-wave scatterers). For all systems with l > 0, σ remains<br />
close to zero for an energy range <strong>of</strong> several meV above<br />
threshold, thereby preventing the recording <strong>of</strong> a ZEKE spectrum.<br />
The advantages and limitations <strong>of</strong> anion ZEKE spectroscopy<br />
are exemplified in Figure 2, which shows the anion photoelectron<br />
and ZEKE spectra <strong>of</strong> Si - 4 . 81,82 <strong>Electron</strong>ic structure calculations<br />
predict both the anion and neutral are planar rhombus<br />
structures with D 2d symmetry. 83 The photoelectron spectrum at<br />
355 nm shows two electronic bands, assigned to transitions to<br />
the X˜ 1 A g ground state (band X) and à 3 B 3u excited state (band<br />
A) <strong>of</strong> Si 4 . Each band shows partially resolved vibrational<br />
structure with peak spacing <strong>of</strong> 360 (X) and 300 cm -1 (A),<br />
assigned in both cases to a progression in the ν 2 totally<br />
symmetric bending mode <strong>of</strong> Si 4 . The anion ZEKE spectrum <strong>of</strong><br />
band A shows considerably better resolution. The main progression<br />
in the ν 2 mode is fully resolved, and it is apparent that the<br />
spectrum exhibits substantial finer structure in addition to the<br />
main progression. These additional features surrounding each<br />
<strong>of</strong> the main peaks have been assigned to sequence and<br />
combination bands involving the low-frequency ν 3 , ν 5 , and ν 6<br />
modes.<br />
What about the ZEKE spectrum <strong>of</strong> band X? This band does<br />
not appear at all in the ZEKE spectrum, a result that reflects the<br />
limitations imposed by the Wigner threshold law. Si - 4 has a 2 B 2g<br />
ground-state with molecular orbital configuration...(a g ) 2 (b 1u ) 2 (b 2g ).<br />
The X˜ 1 A g and à 3 B 3u neutral states are accessed by photodetachment<br />
from the b 2g and b 1u orbitals, respectively. The selection rules for<br />
photodetachment dictate that detachment from an orbital with
13290 J. Phys. Chem. A, Vol. 112, No. 51, 2008 Neumark<br />
Figure 2. Comparison <strong>of</strong> photoelectron spectrum <strong>of</strong> Si 4 - at 355 nm (top left, ref 81), ZEKE spectrum <strong>of</strong> band A (bottom left, ref 82), and SEVI<br />
spectrum <strong>of</strong> band X (right).<br />
gerade symmetry can only lead to odd partial waves for the<br />
detached electron. 84 Hence, photodetachment to the Si 4 groundstate<br />
will produce a p-wave electron, and, according to eq 3, this<br />
cross section will be very small near the detachment threshold. In<br />
contrast, photodetachment to the à 3 B 3u state involves removal <strong>of</strong><br />
an ungerade electron and can proceed via s-wave production,<br />
resulting in a measurable ZEKE spectrum.<br />
This issue regarding s-wave detachment is more troublesome<br />
than might appear at first glance. While the symmetry <strong>of</strong> the<br />
molecular orbital from which detachment occurs dictates<br />
whether s-wave production is allowed, 84 it is difficult to tell a<br />
priori how large the partial cross section for s-wave detachment<br />
is for a given species. We thus found that anion ZEKE worked<br />
very well for some classes <strong>of</strong> anions, including small carbon, 85,86<br />
silicon, 82,87-89 and germanium 90,91 clusters and rare gas/halide<br />
complexes, 77,92,93 but many systems that could in principle detach<br />
via s-waves showed no appreciable ZEKE signal. Hence, the<br />
development <strong>of</strong> a high resolution photodetachment technique<br />
that is not so constrained by eq 3 is highly desirable. One such<br />
method, developed by Cheshnovsky, 94 achieves sub-meV resolution<br />
by detaching anions further above threshold than in ZEKE<br />
(i.e., a few meV), and only detecting electrons in a narrow<br />
kinetic energy window as the photodetachment laser is tuned.<br />
The idea <strong>of</strong> achieving high resolution while detaching above<br />
threshold also plays a central role in SEVI, as discussed in the<br />
following section.<br />
C. Anion SEVI. SEVI is, in principle, a simple variant <strong>of</strong><br />
photoelectron imaging. In SEVI, mass-selected anions are<br />
photodetached at a set wavelength. The resulting photoelectrons<br />
are collected via velocity-map imaging (VMI) using relatively<br />
low extraction voltages, with the goal <strong>of</strong> selectively detecting<br />
slow electrons with high efficiency and enlarging their image<br />
on the detector. A series <strong>of</strong> images is obtained at different<br />
wavelengths, each yielding a high resolution photoelectron<br />
spectrum over a limited range <strong>of</strong> electron kinetic energy. The<br />
basic ideas is that if the canonical 2% energy resolution <strong>of</strong> VMI<br />
can be achieved for electrons with 10 meV <strong>of</strong> kinetic energy,<br />
the absolute energy resolution is 0.2 meV (1.6 cm -1 ). SEVI<br />
draws upon the photoionization and photodetachment microscopy<br />
experiments reported previously by Vrakking, 95 Blondel, 96,97<br />
and co-workers; those experiments were more concerned with<br />
measuring interference effects associated with extremely slow<br />
electrons, rather than as a means <strong>of</strong> carrying out high resolution<br />
photoelectron spectroscopy over an extended energy range.<br />
Figure 3 shows the current version <strong>of</strong> our SEVI instrument. 28,98<br />
Anions are generated by expanding an appropriate gas mixture<br />
into the source vacuum chamber through an Even-Lavie pulsed<br />
valve equipped with a circular ionizer. Anions formed in the<br />
gas expansion are extracted into a Wiley-McLaren time-<strong>of</strong>flight<br />
mass spectrometer and directed to the detachment region<br />
by a series <strong>of</strong> electrostatic lens and pinholes. A 1 µs pulse on<br />
the last ion deflector allowed only the desired mass into the<br />
interaction region. Anions are photodetached between the<br />
repeller and the extraction plates <strong>of</strong> a three-plate VMI electron<br />
optical stack by the focused output <strong>of</strong> a Nd:YAG pumped<br />
tunable dye-laser. Repeller voltages typically range from 150<br />
- 350 V. The photoelectron cloud formed is coaxially extracted<br />
down a 50 cm flight tube and mapped onto a detector comprising<br />
a chevron-mounted pair <strong>of</strong> time-gated, imaging quality microchannel<br />
plates coupled to a phosphor screen, as is typically used<br />
in phot<strong>of</strong>ragment imaging experiments. Events on the screen<br />
are collected by a 1024 × 1024 Charge-Coupled Device (CCD)<br />
camera and sent to a computer. <strong>Electron</strong> velocity-mapped images<br />
resulting from 25 000-100 000 laser pulses are summed,<br />
quadrant symmetrized and inverse-Abel transformed. 99 Photoelectron<br />
spectra are obtained via angular integration <strong>of</strong> the<br />
transformed images.<br />
In order to obtain circular images at these low extraction<br />
voltages, care must be taken to eliminate stray electric and<br />
magnetic fields in the photodetachment region and free-flight<br />
region. Both are enclosed within two concentric cylinders <strong>of</strong><br />
magnetic shielding, the innermost surface <strong>of</strong> which is coated
Centennial Feature Article J. Phys. Chem. A, Vol. 112, No. 51, 2008 13291<br />
Figure 3. Schematic <strong>of</strong> SEVI apparatus.<br />
Figure 4. Transformed image <strong>of</strong> Cl - (inset) showing photodetachment<br />
to Cl( 2 P 3/2 ) (outer ring) and Cl*( 2 P 1/2 ) (inner ring). Angular integration<br />
yields photoelectron signal vs pixel position, as shown. Kinetic energies<br />
and linewidths for the two peaks are indicated (ref 98).<br />
with colloidal graphite. The coaxial VMI arrangement is also<br />
important, as it eliminates any effects <strong>of</strong> the energy spread in<br />
the anion beam on the electron energy resolution.<br />
Figure 4 shows the transformed SEVI image and angular<br />
integration <strong>of</strong> the photoelectron signal <strong>of</strong> the atomic chloride<br />
ion at a photodetachment wavelength <strong>of</strong> 332.9 nm and a repeller<br />
voltage <strong>of</strong> 350 V. 98 The outer and inner rings correspond to<br />
photodetachment to the Cl( 2 P 3/2 ) ground-state and Cl*( 2 P 1/2 )<br />
spin-orbit excited state, respectively. Both rings are about two<br />
pixels wide, but the corresponding energy widths ∆E, given by<br />
∆E<br />
eKE ) 2∆r r<br />
are 2.8 and 19 cm -1 for the inner and outer rings, respectively,<br />
as shown in Figure 4. At repeller voltage <strong>of</strong> 150 V, the rings<br />
are larger and even higher resolution can be obtained; peaks as<br />
narrow as 1.5 cm -1 have been measured for the transition to<br />
the Cl* state, for example. One can also obtain PAD’s from<br />
the images. The inner ring is nearly isotropic (β )-0.1), as<br />
expected for s-wave detachment near threshold. The outer ring<br />
is more anisotropic with β )-0.3, indicating that there is an<br />
additional contribution from d-wave detachment further above<br />
the threshold.<br />
The energy resolution <strong>of</strong> SEVI is comparable to that <strong>of</strong> anion<br />
ZEKE, but SEVI <strong>of</strong>fers considerable advantages. While a ZEKE<br />
spectrum requires stepping the photodetachment laser at small<br />
energy intervals, typically 0.3-1cm -1 , a complete SEVI spectrum<br />
(4)<br />
can be obtained using much larger intervals, typically 100-1000<br />
cm -1 , and in favorable cases a single wavelength suffices.<br />
Moreover, in a given SEVI spectrum, the excess energy above<br />
threshold, hV-E th , is typically much larger than in ZEKE where<br />
one is by necessity within 2-3 cm -1 above the photodetachment<br />
transition <strong>of</strong> interest. Hence, the photodetachment cross section is<br />
much higher in SEVI. These two effects combine to yield data<br />
collection rates approximately 2 orders <strong>of</strong> magnitude higher in<br />
SEVI. This difference also means that it is possible to observe<br />
p-wave detachment in SEVI; at photon energies 100-200 cm -1<br />
above threshold, the cross section for p-wave detachment is no<br />
longer negligible. Thus, for example, the SEVI spectrum <strong>of</strong> band<br />
X can be measured, as shown in Figure 2, where we now observe<br />
an as yet unassigned progression with a peak spacing <strong>of</strong> 80 cm -1<br />
that was not resolved in previous work. 81,100<br />
SEVI does have at least one disadvantage compared to<br />
energy-dispersive photoelectron analysis schemes in that a weak<br />
feature at low eKE can be obscured by a strong feature at high<br />
eKE, because the images from both features cover the same<br />
detector pixels. With sufficiently high signal-to-noise, one should<br />
be able to discern the weaker feature, but the dynamic range <strong>of</strong><br />
the spectrometer is still limited. This constraint would disappear<br />
if the methodology <strong>of</strong> phot<strong>of</strong>ragment “slice” imaging 101,102 could<br />
be adapted to photoelectron imaging, but so far this has not<br />
proved feasible.<br />
III. <strong>Applications</strong> <strong>of</strong> SEVI<br />
The high spectral resolution afforded by SEVI provides the<br />
means to observe underlying structure that was not resolved in<br />
more conventional photoelectron spectroscopy experiments. This<br />
capability is critical in looking at species with numerous lowfrequency<br />
vibrational modes, such as metal and semiconductor<br />
clusters, as exemplified in the case <strong>of</strong> Si 4 shown above.<br />
Moreover, at higher resolution, one can unravel vibronic<br />
coupling and other non-Born-Oppenheimer (BO) effects that<br />
<strong>of</strong>ten play an important role in the open-shell free radicals and<br />
clusters generated by photodetachment. The elucidation <strong>of</strong> these<br />
effects is a frontier area in photoelectron spectroscopy <strong>of</strong> both<br />
anions and neutrals. 103,104<br />
Allowed transitions involving progressions in totally symmetric<br />
vibrational modes can generally be simulated within the<br />
Franck-Condon (FC) approximation, in which the transition<br />
strength between the anion and neutral vibrational levels<br />
|Ψ - (υ 1 ′′...υ n ′′)〉 and |Ψ 0 (υ 1 ′...υ n ′)〉, respectively, is given by<br />
I ∝ |〈Ψ - (υ 1 ′′....υ n ′′)|Ψ 0 (υ 1 ′...υ n ′) 〉 | 2 (5)<br />
The multidimensional FC factor in eq 5 can be evaluated<br />
either by invoking the parallel mode approximation, in which
13292 J. Phys. Chem. A, Vol. 112, No. 51, 2008 Neumark<br />
Figure 5. SEVI spectrum <strong>of</strong> CCS - , showing transitions to the four lowest lying electronic states <strong>of</strong> CCS (ref 115). The lower curves in each panel<br />
were taken at a lower photodetachment energy, resulting in higher resolution over a narrower energy window.<br />
case it breaks up into n one-dimensional FC factors, or allowing<br />
for Duschinsky mixing between modes <strong>of</strong> the same symmetry. 41,105<br />
Any ∆υ transition in a totally symmetric mode is allowed, and<br />
∆υ )(2, (4, ... transitions in nontotally symmetric modes<br />
are also allowed but tend to be very weak compared to<br />
∆υ ) 0.<br />
However, odd ∆υ transitions in nontotally symmetric modes<br />
can occur only through vibronic coupling effects, i.e. the<br />
breakdown <strong>of</strong> the Born-Oppenheimer approximation induced<br />
by the nuclear kinetic energy operator. 106 These effects include<br />
Renner-Teller (RT), Jahn-Teller (JT), and Herzberg-Teller<br />
(HT) coupling, all <strong>of</strong> which can introduce nominally forbidden<br />
transitions in photoelectron spectra. For example, in photodetachment<br />
transitions to degenerate electronic states, JT coupling<br />
can lead to progressions in degenerate vibrational modes <strong>of</strong> the<br />
neutral, as seen in the photoelectron spectrum <strong>of</strong> the C 5 H 5<br />
-<br />
anion, where weak JT coupling in the X˜ 2 E 1 ′′ ground-state <strong>of</strong><br />
C 5 H 5 results in a short progression in two <strong>of</strong> the e 2 ′ degenerate<br />
stretching and bending modes. 107,108<br />
HT coupling mixes vibronic levels <strong>of</strong> the same overall<br />
symmetry nominally associated with two (or more) different<br />
electronic states and explains, for explain, the presence <strong>of</strong> ∆υ 4<br />
) 1 transitions in the ground-state band <strong>of</strong> the photoelectron<br />
spectrum <strong>of</strong> NO 3 - . 109 The NO 3 radical has a X˜ 2 A 2 ′ ground state,<br />
and the ν 4 mode is an in-plane bend with e′ symmetry. The υ 4<br />
) 1 level thus has E′ vibronic symmetry, and can mix with<br />
totally symmetric vibrational levels <strong>of</strong> the B˜ 2 E′ electronic state<br />
<strong>of</strong> NO 3 that lies 1.88 eV above the ground state. This qualitative<br />
picture is supported by theoretical treatments <strong>of</strong> NO 3 . 110-113 If<br />
allowed transitions to the two neutral electronic states have<br />
different PAD’s, then transitions that acquire intensity through<br />
HT coupling can exhibit the PAD associated with the distant,<br />
vibronically coupled electronic state. Hence, the observation <strong>of</strong><br />
a peak in the middle <strong>of</strong> a band with a different PAD from the<br />
rest <strong>of</strong> the band is a distinct signature <strong>of</strong> vibronic coupling, as<br />
seen in the photoelectron spectra <strong>of</strong> C 2 H - and BNB - . 35,114<br />
A. Probing Vibronic Coupling in Free Radicals with<br />
SEVI. As an example <strong>of</strong> a fairly simple system, we have<br />
recently applied SEVI to CCO - and CCS - , species for which<br />
both the anion and neutral are linear. 115 The resulting spectra<br />
for each anion show transitions from the anion 2 Π state to the<br />
neutral X˜ 3 Σ - ground-state and low-lying ã 1 ∆,b˜ 1 Σ + , and à 3 Π<br />
states, in agreement with lower resolution PE spectra <strong>of</strong><br />
CCO - . 116,117<br />
The four bands for CCS - photodetachment are shown in<br />
Figure 5. The spectra are plotted with respect to electron binding<br />
energy (eBE), the difference between the photon energy and<br />
the electron kinetic energy (eKE):<br />
eBE ) hν - eKE (6)<br />
The high energy termination point <strong>of</strong> each spectrum corresponds<br />
to the photon energy with which each image was acquired. The<br />
SEVI spectra are dominated by allowed transitions in the CCO<br />
and CCS stretching modes, and show fine-structure from<br />
spin-orbit splitting in the anion and, for CCS, the neutral à 3 Π<br />
state. There is no evidence for vibronic coupling in CCO, but<br />
in CCS, there is some bending activity in the X˜ 3 Σ - band, and<br />
nominally forbidden bend transitions (peaks B and E) have<br />
PAD’s characteristic <strong>of</strong> the à 3 Π band, indicative <strong>of</strong> Herzberg-<br />
Teller coupling between these states.<br />
The carbon monohydride radicals, C 2n H, exemplify the<br />
capabilities <strong>of</strong> SEVI to probe more complex vibronic coupling<br />
effects. These radicals are <strong>of</strong> interest in combustion 118 and have<br />
been identified in the interstellar medium, 119,120 along with some<br />
<strong>of</strong> the corresponding anions. 121,122 Microwave spectra 123,124 have<br />
shown that they are linear, at least up to n ) 7. These radicals<br />
are <strong>of</strong> interest from the perspective <strong>of</strong> vibronic coupling because<br />
they have close-lying 2 Σ + and 2 Π electronic states, whose<br />
spacing and energy-ordering depends on the length <strong>of</strong> the carbon<br />
chain. The most thoroughly studied member <strong>of</strong> this series is<br />
C 2 H, for which the ground-state is X˜ 2 Σ + and the à 2 Π excitedstate<br />
lies about 3700 cm -1 higher, 125 but the 2 Π state becomes<br />
progressively more stabilized for the longer chains. Both states<br />
are accessible by photodetachment from the C 2n H - anion, which<br />
has a linear X˜ 1 Σ + ground state, by detachment from either a σ<br />
or π molecular orbital, so photoelectron spectroscopy provides<br />
a direct means <strong>of</strong> determining the location and splitting <strong>of</strong> the<br />
two neutral states. Indeed, photoelectron spectra 126 <strong>of</strong> the series
Centennial Feature Article J. Phys. Chem. A, Vol. 112, No. 51, 2008 13293<br />
Figure 6. Left panels: PE spectrum <strong>of</strong> C 2 H - at 266 nm in top panel, and SEVI spectra <strong>of</strong> regions I-IV in lower four panels. Right panels: same,<br />
but for C 2 D - (ref 98).<br />
C 2 H - to C 8 H - showed that the 2 Σ + and 2 Π states are nearly<br />
degenerate in C 4 H, with the 2 Σ + state lying slightly lower, but<br />
that the 2 Π state is the ground-state for C 6 H and C 8 H. These<br />
assignments were made in part based on the observed photoelectron<br />
angular distributions, which quite different depending<br />
on the orbital from which detachment occurs; the measured<br />
PAD’s indicate mainly p-wave detachment to the 2 Σ + state and<br />
s-wave detachment to the 2 Π state.<br />
We first consider the C 2 H radical, which exhibits complex<br />
vibronic coupling in its ground-state owing to a conical<br />
intersection between the ground X˜ 2 Σ + (A′) state and the lowlying<br />
2 Π(A′) and 2 Π(A′′) states. 127,128 Along the linear axis, there<br />
is Renner-Teller coupling between the electronic and vibrational<br />
angular momenta <strong>of</strong> the 2 A′ and 2 A′′ components <strong>of</strong> the 2 Π state,<br />
while the bend vibration induces pseudo Jahn-Teller (aka<br />
Herzberg-Teller) coupling between the 2 Σ + state and the 2 A′<br />
component <strong>of</strong> the 2 Π state. The resulting breakdown <strong>of</strong> the<br />
Born-Oppenheimer approximation complicates vibrational assignments<br />
<strong>of</strong> the C 2 H radical, and poses a challenge to both<br />
theory and experiment.<br />
Much <strong>of</strong> our understanding <strong>of</strong> these effects in C 2 H has come<br />
from rotationally resolved IR spectroscopy, 125,129 but PE spectroscopy<br />
<strong>of</strong> C 2 H - has provided additional and complementary<br />
information. Ervin et al. 35 measured the first photoelectron<br />
spectra <strong>of</strong> C 2 H - and C 2 D - at a photon energy <strong>of</strong> 3.52 eV. They<br />
observed a spectrum dominated by the X˜ 2 Σ + -X˜ 1 Σ + 0-0 origin<br />
band, indicating a small geometry change between the anion<br />
and the radical ground state. The PE spectrum exhibited<br />
numerous transitions involving the bending (υ 2 ) and the C-C<br />
stretching (υ 3 ) modes. The observation <strong>of</strong> odd ∆υ 2 transitions<br />
with a different PAD than the allowed transitions in this band<br />
implied HT coupling with the à 2 Π state.<br />
In the higher energy PE spectra (4.66 eV) <strong>of</strong> C 2 H - and C 2 D -<br />
reported by Taylor et al., 126 strong transitions were observed in<br />
the region <strong>of</strong> the à 2 Π state origin, where overlapped transitions<br />
to the X˜ 2 Σ + and à 2 Π states were expected. Assignments were<br />
made based on previous experiments and the photoelectron<br />
angular distributions, based on the reasoning that transitions to<br />
neutral levels with dominant à 2 Π state character would show<br />
different angular distributions than those primarily associated<br />
with the X˜ 2 Σ + state. Nonetheless, some <strong>of</strong> the assignments were<br />
problematic. Hence, SEVI spectra at higher resolution were<br />
needed to determine the extent to which overlapping transitions<br />
contributed to the PE spectrum, and to obtain improved<br />
assignments.<br />
Figure 6 shows the PE spectra <strong>of</strong> C 2 H - and C 2 D - measured<br />
by Taylor et al. in the top panels, while the lower panels show<br />
SEVI spectra <strong>of</strong> selected regions <strong>of</strong> the PE spectra. 98 The SEVI<br />
spectra indeed show that nearly all features in the PE spectra<br />
comprise multiple transitions, and that most <strong>of</strong> these transitions<br />
can be assigned by comparison to prior experiment or theory 128<br />
(solid and dashed lines, respectively). Region III is the most<br />
interesting, since it is where the origin <strong>of</strong> the à 2 Π state is<br />
expected. The two peaks in this region <strong>of</strong> the C 2 H - PE spectra<br />
split into six features in the SEVI spectrum. These features are<br />
assigned to transitions from the anion ground-state to neutral<br />
states that are admixtures <strong>of</strong> the ground vibrational level <strong>of</strong> the<br />
à 2 Π state, the Ã(000) level, with various vibrational levels <strong>of</strong><br />
the X˜ 2 Σ + with odd numbers <strong>of</strong> quanta in the υ 2 bending mode.<br />
The states comprising each admixture have overall Π vibronic<br />
symmetry. In the absence <strong>of</strong> vibronic coupling, there would be<br />
a single feature corresponding to a transition to the Ã(000) state,<br />
but vibronic coupling spreads the oscillator strength for the<br />
transition over several nearby levels with the same vibronic<br />
symmetry. For C 2 D - , the SEVI spectrum <strong>of</strong> region III is<br />
considerably simpler, reflecting reduced vibronic coupling in<br />
the C 2 D radical; 125,130 feature K has considerably more Ã(000)<br />
character than any <strong>of</strong> the nearby peaks and consequently<br />
dominates the SEVI spectrum.<br />
SEVI spectra <strong>of</strong> C 4 H- are presented in Figure 7. 131 In this<br />
figure, one observes that as the laser frequency is lowered, fewer<br />
features are observed but the resolution improves, as expected<br />
based on eq 4. Five well-separated bands are present, corresponding<br />
to the partially resolved features in the previously<br />
recorded PE spectra. 126 The higher resolution spectra in reveal<br />
that several <strong>of</strong> the bands are doublets with splittings ranging<br />
from 15-35 cm -1 , and there are several additional minor peaks<br />
as well.<br />
PAD’s for closely spaced features are markedly different, as<br />
can be seen directly from the photoelectron image in Figure 7,<br />
the SEVI image corresponding to the bottom photoelectron<br />
spectrum. The two rings corresponding to features B and C are
13294 J. Phys. Chem. A, Vol. 112, No. 51, 2008 Neumark<br />
Figure 7. Left: SEVI spectra <strong>of</strong> C 4 H - at various photon energies. Right: SEVI image <strong>of</strong> C 4 H- corresponding to bottom spectrum (ref 131).<br />
clearly distinguished, and while C is isotropic, B is strongly<br />
peaked along the direction <strong>of</strong> laser polarization. Peaks A, B,<br />
and D exhibit PAD’s characteristic <strong>of</strong> p-wave scattering, while<br />
the remaining main features in the spectrum, peaks C, E, F, G,<br />
and H, exhibit s-wave PAD’s. The nature <strong>of</strong> the photoelectron<br />
partial waves is also consistent with the dependence <strong>of</strong> peak<br />
intensities upon photon energy. According to eq 3, transitions<br />
dominated by p-wave detachment will drop more quickly than<br />
those dominated by s-wave detachment as the photon energy is<br />
lowered, and that is exactly what is seen in Figure 7.<br />
It thus appears that the SEVI spectrum comprises two<br />
overlapping transitions to two different electronic states <strong>of</strong> C 4 H,<br />
a result consistent with past theoretical 132,133 and experimental 126<br />
work indicating that the 2 Σ + and 2 Π are very close to one<br />
another. Based on the PAD’s, peaks A and C are assigned to<br />
the vibrational origins <strong>of</strong> the X˜ 2 Σ + and à 2 Π states, respectively,<br />
yielding a splitting <strong>of</strong> only 26 meV (213 cm -1 ) between the<br />
states. This splitting is close to the most recent calculated value,<br />
35 meV, 134 and represents an improvement over the previously<br />
reported value <strong>of</strong> 468 cm -1 inferred from our lower resolution<br />
PE spectrum 126 where it was more difficult to identify the band<br />
origins.<br />
Similarly, peaks B and D are assigned to transitions within<br />
the X˜ 2 Σ + manifold, while the remaining peaks are assigned to<br />
transitions within the à 2 Π manifold. Peak spacings in the<br />
vibrational progressions are around 200 cm -1 , which is too low<br />
to be anything other than a bending mode <strong>of</strong> C 4 H, and all<br />
observed features can be assigned to transitions in the degenerate<br />
ν 6 and ν 7 bending modes are based primarily on comparison to<br />
electronic structure calculations. However, the presence, let<br />
alone the dominance, <strong>of</strong> activity in the bending modes is unusual<br />
considering that the anion and both neutral states are linear.<br />
We therefore must consider effects from HT coupling, which<br />
mixes close-lying levels <strong>of</strong> the same vibronic symmetry that<br />
are nominally associated with different electronic states. Thus,<br />
odd levels <strong>of</strong> bend modes <strong>of</strong> the X˜ 2 Σ + state, with overall Π<br />
vibronic symmetry, mix with even levels <strong>of</strong> bend modes <strong>of</strong> the<br />
à 2 Π state with the same vibronic symmetry, and transitions<br />
from the anion ground-state to these levels become allowed.<br />
Similarly, odd bending levels <strong>of</strong> the˜Ã 2 Π state with Σ +<br />
symmetry mix with Σ + levels <strong>of</strong> the X˜ 2 Σ + state and become<br />
accessible to detachment from the anion ground state. The SEVI<br />
spectra, which show strong odd ∆ν transitions in the bending<br />
modes <strong>of</strong> both the X˜ 2 Σ + and à 2 Π states, can be explained within<br />
the context <strong>of</strong> this type <strong>of</strong> coupling, and given that the electronic<br />
state splitting is comparable to the frequency <strong>of</strong> the relevant<br />
vibrational modes, strong HT coupling is certainly expected in<br />
C 4 H.<br />
Other examples in which SEVI has been used to probe<br />
vibronic coupling include studies <strong>of</strong> the propynyl anion,<br />
H 3 CCC - , 135 and the methoxide 136 and ethoxide anions. The<br />
SEVI spectrum <strong>of</strong> H 3 CCC - provides a reasonably high resolution<br />
probe <strong>of</strong> vibronic structure in the propynyl radical, H 3 CCC.<br />
The propynyl radical is a higher energy isomer <strong>of</strong> the propargyl<br />
radical, H 2 CCCH; recent calculations place it about 40 kcal/<br />
mol above propargyl. 137,138 Thus, while many experimental<br />
studies <strong>of</strong> propargyl have been reported, 139 propynyl has been<br />
quite difficult to isolate and study spectroscopically; its only<br />
prior experimental characterization came from the anion PE<br />
spectrum measured by Robinson et al. 140 Propynyl has C 3V<br />
symmetry and electronic structure calculations have indicated<br />
it has a X˜ 2 A 1 ground-state and a low-lying à 2 E excited state. 141<br />
Thus, transitions from the anion to X˜ state vibrational levels<br />
with e symmetry can only occur via vibronic coupling with the<br />
à 2 E state.<br />
The SEVI spectrum <strong>of</strong> H 3 CCC - is shown in the lower two<br />
panels <strong>of</strong> Figure 8, 135 along with the previously measured<br />
photoelectron spectrum 140 in the top panel. Peak A, the dominant<br />
spectral feature, is the band origin <strong>of</strong> the transition to the X˜ 2 A 1<br />
state. High resolution scans <strong>of</strong> this feature (inset, bottom panel)<br />
show a partially resolved triplet <strong>of</strong> peaks spaced by 5-6 cm -1<br />
that are assigned to rotational contours associated with parallel<br />
(∆K ) 0) and perpendicular (∆K )(1) transitions. The much<br />
smaller features to the left <strong>of</strong> peak A are assigned to sequence<br />
bands in the low frequency degenerate C-C-C bend mode (the<br />
ν 8 mode), while nearly all the remain features to the right <strong>of</strong><br />
peak A can be assigned to transitions to totally symmetric<br />
vibrational levels <strong>of</strong> the X˜ 2 A 1 state, with the exception <strong>of</strong> the<br />
weak peak I, which is attributed to the vibrational origin <strong>of</strong> the<br />
à 2 E state. No vibronic coupling needs to be invoked to explain<br />
the spectrum. The absence <strong>of</strong> observable coupling is somewhat<br />
surprising, given the proximity <strong>of</strong> the two electronic states, but<br />
may reflect the low photodetachment cross section to the à 2 E<br />
state, in which case “intensity-borrowing” will not provide much<br />
enhancement <strong>of</strong> nominally forbidden transitions within the X˜ 2 A 1<br />
sate manifold.
Centennial Feature Article J. Phys. Chem. A, Vol. 112, No. 51, 2008 13295<br />
Figure 8. Comparison <strong>of</strong> photoelectron spectrum (top) <strong>of</strong> propynyl<br />
anion (H 3 CCC - ) from ref 140 and SEVI spectra (ref 135;) in bottom<br />
two panels. Panel III was taken at a photodetachment energy closer to<br />
the band origin (peak A) to obtain higher resolution. The inset in panel<br />
III was taken just above the band origin and shows partially resolved<br />
rotational contours.<br />
The methoxy (CH 3 O) and ethoxy (C 2 H 5 O) radicals are<br />
particularly interesting species from the perspective <strong>of</strong> probing<br />
vibronic coupling via various photodetachment spectroscopies.<br />
The CH 3 O radical has C 3v symmetry. Its X˜ 2 E ground state, with<br />
a half-filled p-orbital on the O atom, has been a model system<br />
for exploring the effects <strong>of</strong> Jahn-Teller coupling through a<br />
combination <strong>of</strong> laser-induced fluorescence, 142-145 dispersed<br />
fluorescence, 146-148 stimulated emission pumping, 149,150 photoelectron<br />
spectroscopy, 151-153 photodissociation, 154,155 and several<br />
theoretical studies. 156-159 The effects <strong>of</strong> Jahn-Teller coupling<br />
in CH 3 O are particularly pronounced in the photoelectron<br />
spectrum 152,153 CH 3 O - . These spectra, all <strong>of</strong> which involve<br />
photodetachment to the X˜ 2 E state <strong>of</strong> CH 3 O, show various<br />
degrees <strong>of</strong> vibrational and spin-orbit fine structure, depending<br />
on their resolution, but they are unusual in that they are<br />
dominated by progressions in the ν 5 and ν 6 e′ degenerate<br />
vibrational modes, a clear manifestation <strong>of</strong> Jahn-Teller coupling<br />
in the methoxy ground state. The SEVI spectrum 160 <strong>of</strong> CH 3 O -<br />
resolves these progressions more clearly, as well as spin-orbit<br />
fine structure and additional weak vibrational features. Most <strong>of</strong><br />
the features in the PE and SEVI spectra can be assigned, even<br />
if simulation <strong>of</strong> the spectral intensities is still problematic.<br />
The ethoxy radical presents a more challenging scenario.<br />
C 2 H 5 O also has an unpaired electron on the O atom, but owing<br />
to its lower (C s ) symmetry, the degeneracy seen in CH 3 Ois<br />
removed, leading to a ground X˜ 2 A′′ state and low-lying à 2 A′<br />
state. 161,162 The anion PE spectrum measured by Ramond et<br />
al., 153 shown in the left panel <strong>of</strong> Figure 9, shows that the X˜ 2 A′′<br />
and à 2 A′ states are separated by only 355 cm -1 ; the band origins<br />
for the two states, peaks a and b, respectively, were identified<br />
through their very different PAD’s. The remainder <strong>of</strong> the<br />
spectrum is quite congested, however, as it comprises overlapped<br />
transitions to the two electronic states. The PAD’s were used<br />
to attribute these features to one state or the other, but only a<br />
single vibrational progression in the ground-state with a<br />
frequency <strong>of</strong> 1295 cm -1 could be assigned (lower left panel,<br />
Figure 9). The ethoxy radical and anion photoelectron spectrum<br />
have been considered in theoretical treatments by Yarkony and<br />
co-workers, 163,164 in which they constructed coupled diabatic<br />
states for the two ethoxy states and simulated the photoelectron<br />
spectrum. This problem is complicated by a low-lying conical<br />
intersection and strong vibronic coupling between the two states;<br />
as a result, the energy levels have significant electronic character<br />
from both electronic states and their positions are strongly<br />
perturbed from a simple harmonic analysis.<br />
Given the considerable effort already expended in analyzing<br />
a congested spectrum with partially resolved features, it seemed<br />
appropriate to measure a SEVI spectrum <strong>of</strong> C 2 H 5 O - in order to<br />
see what new features might be resolved at higher resolution.<br />
Preliminary results are shown in the right panel <strong>of</strong> Figure 9,<br />
where we show several scans at increasingly lower photon<br />
energies, thereby obtaining progressively narrower energy<br />
windows and shifting the region <strong>of</strong> highest energy resolution<br />
toward the band origins. Even the lowest resolution scan is a<br />
considerable improvement over the PE spectrum, and the<br />
remaining spectra show several new features, including a peak<br />
between the band origins and a splitting <strong>of</strong> peak a, the X˜ 2 A′′<br />
origin, into a doublet spaced by 63 cm -1 . These higher resolution<br />
spectra will provide a more rigorous test <strong>of</strong> the theoretical<br />
models developed to interpret the data.<br />
B. Probing Prereactive van der Waals Complexes with<br />
SEVI. Anion photodetachment has been used in our laboratory<br />
and elsewhere to probe transition states for bimolecular and<br />
unimolecular reactions. 21,165-168 In these experiments, if a<br />
negative ion has good geometric overlap with a reactive<br />
transition state, then photodetachment <strong>of</strong> the anion will access<br />
the neutral transition state. Although the transition state is<br />
typically short-lived with respect to dissociation to reactants or<br />
products, 20 the photoelectron spectrum <strong>of</strong> the anion in question<br />
can yield resolved vibrational structure associated with vibrational<br />
motion at the transition state that is perpendicular to the<br />
reaction coordinate. As an example, photodetachment <strong>of</strong> the<br />
FH - 2 anion accesses the transition state <strong>of</strong> the benchmark F +<br />
H 2 reaction, 169 yielding resolved progressions in the F-H-H<br />
bend and H-H stretch, and thus providing a detailed probe <strong>of</strong><br />
the potential energy surface in the vicinity <strong>of</strong> the transition<br />
state. 170<br />
A useful variation <strong>of</strong> this experiment is when the anion<br />
equilibrium geometry does not match the transition state but<br />
instead overlaps the shallow van der Waals minimum in either<br />
the reactant or product valley <strong>of</strong> the reaction in question. For<br />
example, the ClH - 2 anion has good geometric overlap with the<br />
Cl ···H 2 van der Waals complex in the reactant valley for the<br />
reaction Cl + H 2 f HCl + H. 171,172 Hence, photodetachment<br />
<strong>of</strong> ClH - 2 can, in principle, yield the energy levels <strong>of</strong> the weakly<br />
bound Cl · H 2 complex, providing new insights into a reaction<br />
that has played an important role the development <strong>of</strong> chemical<br />
kinetics and dynamics. 173,174 Photodetachment experiments <strong>of</strong><br />
this type complement infrared studies <strong>of</strong> “pre-reactive” van der<br />
Waals complexes carried out by Lester and co-workers. 175,176<br />
-<br />
There are two reasons why the photodetachment <strong>of</strong> ClH 2<br />
is <strong>of</strong> particular interest. First, a study <strong>of</strong> the Cl + HD reaction<br />
by Skouteris et al. 177 provided experimental evidence that<br />
the weak van der Waals (vdW) forces in the reactant valley<br />
have a significant effect on the branching ratio <strong>of</strong> the HCl:<br />
DCl product as a function <strong>of</strong> collision energy. These results<br />
suggest that spectroscopic study <strong>of</strong> the prereactive Cl ···H 2<br />
complex would provide new insights into how weak vdW<br />
interactions affect chemical reactivity. Moreover, such an<br />
experiment addresses an ongoing controversy in chemical<br />
dynamics concerning the relative reactivities <strong>of</strong> Cl( 2 P 3/2 ) and
13296 J. Phys. Chem. A, Vol. 112, No. 51, 2008 Neumark<br />
Figure 9. Left: Photoelectron spectra <strong>of</strong> ethoxide anion from ref 153. Top panel shows results at two different laser polarization angles. Peaks a<br />
and b are origins <strong>of</strong> X˜ 2 A′′ and à 2 A′ states, respectively. Bottom panel shows “magic angle” spectrum and simulations <strong>of</strong> transitions to X˜ and Ã<br />
states. Right: SEVI spectra <strong>of</strong> ethoxide at several photon energies, showing new peaks as the resolution around the two origin peaks is increased.<br />
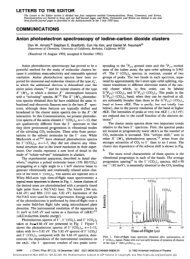
Figure 10. Schematic <strong>of</strong> adiabatic potential energy curves for Cl - +<br />
H 2 and Cl + H 2 , indicating evolution <strong>of</strong> Cl ···H 2 hindered rotor levels<br />
to H 2 free rotations and the Cl ···H 2 van der Waals stretch levels<br />
supported by each curve. Note that Cl* + H 2 correlates to electronically<br />
excited HCl + H products.<br />
Cl*( 2 P 1/2 ) with H 2 . As shown in Figure 10, the interaction <strong>of</strong><br />
Cl and Cl* with H 2 ( 1 Σ + g ) gives rise to three adiabatic<br />
electronic PES’s, labeled 2 Σ 1/2 , 2 Π 3/2 , and 2 Π 1/2 , in linear<br />
geometries. In the adiabatic limit, only Cl( 2 P 3/2 ) atoms that<br />
approach H 2 on the 2 Σ 1/2 PES react to form ground-state<br />
products. Experience shows that the Born-Oppenheimer<br />
(BO) approximation will govern chemical reactions, so that<br />
the electronically adiabatic pathway should always dominate.<br />
However, experiments by Liu and co-workers 178 indicated<br />
that the Cl* state was more reactive than Cl over a wide<br />
range <strong>of</strong> collision energies, a result that disagrees with the<br />
BO approximation and with state-<strong>of</strong>-the-art scattering calculations<br />
by Alexander et al. 179 in which nonadiabatic<br />
couplings between the reactant spin-orbit states were<br />
included. The experimental results thus imply unusually large<br />
nonadiabatic effects which, if present, will be strongest in<br />
the region <strong>of</strong> the neutral surface probed by photodetachment<br />
<strong>of</strong> ClH 2 -, where the interaction between the 2 Σ and 2 Π states<br />
is comparable to the spin-orbit splitting. 180 The photodetachment<br />
experiment can therefore probe these effects<br />
spectroscopically.<br />
Photoelectron spectra <strong>of</strong> ClH - 2 and ClD - 2 obtained using a<br />
conventional negative ion time-<strong>of</strong>-flight photoelectron spectrometer<br />
have been reported previously. 181 They exhibited<br />
features associated with the spin-orbit splitting in the Cl ···H 2<br />
complex, but no additional structure was resolved because <strong>of</strong><br />
the limited resolution, around 8-10 meV. Subsequent theoretical<br />
work by Alexander and Manolopoulos 180 demonstrated that the<br />
ClH - 2 anion wave function has a good FC overlap with the<br />
vibrational and hindered rotor states <strong>of</strong> the neutral Cl ···H 2 van<br />
der Waals complex. In addition, they predicted that with an<br />
energy resolution <strong>of</strong> 1 meV, several features associated with<br />
bound and resonance states <strong>of</strong> this prereactive complex could<br />
be resolved. Hence, the higher resolution <strong>of</strong>fered by SEVI was<br />
brought to bear on this system. 182<br />
Figure 11 shows SEVI spectra in the regions <strong>of</strong> the two<br />
spin-orbit states <strong>of</strong> the Cl ···H 2 and Cl ···D 2 complexes. There<br />
is considerable structure seen in all four panels that can readily<br />
be assigned by comparison with simulations using high quality<br />
anion and neutral potential energy surfaces. In the Cl( 2 P 3/2 ) ···H 2<br />
spectrum, the observed peaks are associated with the hindered<br />
H 2 (j ) 0 and 1) rotor states <strong>of</strong> the weakly bound Cl ···H 2<br />
complex on the ground 2 Σ 1/2 electronic PES. One quantum <strong>of</strong><br />
excitation in the Cl ···H 2 van der Waals stretching vibration<br />
(ν s ) is also observed at 30 cm - 1 above the (j ) 1, ν s )0) level.<br />
The Cl( 2 P 3/2 ) ···D 2 shows two identifiable progressions: the<br />
observed transitions are assigned to hindered D 2 rotor modes (j<br />
) 0, 1, 2) on the 2 Σ 1/2 ground electronic state, with a Cl ···D 2<br />
stretching vibration resolved for the j ) 1 and 2 levels.<br />
The experimental results in Figure 11 are compared to two<br />
sets <strong>of</strong> simulations: one in which the Born-Oppenheimer<br />
approximation is assumed and one in which the nonadiabatic<br />
interactions between the Cl/Cl* + H 2 surfaces are included. 183<br />
Although the electronically adiabatic simulations are in<br />
reasonable agreement with most features in the measured<br />
spectra, there are some clear differences (on the order <strong>of</strong> 10<br />
cm - 1 ) between several <strong>of</strong> predicted peak positions and those<br />
observed experimentally. The nonadiabatic simulations are<br />
only slightly different but result in better agreement with<br />
experiment. The most noticeable difference between the two<br />
simulations is the reduction, when the nonadiabatic coupling
Centennial Feature Article J. Phys. Chem. A, Vol. 112, No. 51, 2008 13297<br />
Figure 11. SEVI spectra <strong>of</strong> ClH 2 - (left) and ClD 2 - (right). Top panels are transitions to Cl( 2 P 3/2 ) ···H 2 and Cl( 2 P 3/2 ) ···D 2 , bottom panels are<br />
transitions to Cl( 2 P 1/2 ) ···H 2 and Cl( 2 P 1/2 ) ···D 2 . Spectral assignments are indicated. Results from adiabatic (dashed blue) and nonadiabatic (solid<br />
red) simulations are also shown.<br />
Figure 12. SEVI spectra <strong>of</strong> Cl-(CH 4 ). Top panels, left and right, show transitions to Cl( 2 P 3/2 ) ···CH 4 and Cl( 2 P 1/2 ) ···CH 4 , respectively, while<br />
bottom panel shows Cl( 2 P 3/2 ) ···CD 4 band.<br />
is retained, <strong>of</strong> the splitting between the bend-stretch levels<br />
associated with the 2 Σ 1/2 and 2 Π 1/2 states. For example, in<br />
the ClH 2 spectra, the splitting between the (j ) 1, ν s ) 0)<br />
levels associated with these two states is reduced from 902<br />
to 888 cm - 1 , in excellent agreement with the value <strong>of</strong> 887<br />
cm - 1 found experimentally. Similarly, in ClD 2 , the spacing<br />
between the (j ) 0, V s ) 0) levels is reduced from 908 to<br />
900 cm - 1 which exactly matches the experimental spectra.<br />
These reductions can be explained in terms <strong>of</strong> small changes<br />
in the shapes <strong>of</strong> the adiabatic-bender potentials induced by<br />
the spin-orbit, Coriolis and electrostatic couplings, and the<br />
resulting changes in the energies <strong>of</strong> the bend-stretch van<br />
der Waals levels in the two electronic states.<br />
The comparison between experimental and calculated<br />
spectra in Figure 11 leads to two important conclusions<br />
regarding the Cl + H 2 reaction. First, the level <strong>of</strong> agreement
13298 J. Phys. Chem. A, Vol. 112, No. 51, 2008 Neumark<br />
<strong>of</strong> both sets <strong>of</strong> simulations with the experimental spectra<br />
validates the accuracy <strong>of</strong> the reactant potential energy<br />
surfaces in the region <strong>of</strong> the van der Waals well in the<br />
reactant valley. This validation is important because the weak<br />
interactions that give rise to this well play a decisive role in<br />
determining the product branching ratio <strong>of</strong> the Cl + HD<br />
reaction. Second, these results demonstrate for the first time<br />
that the effect <strong>of</strong> non-Born-Oppenheimer couplings in the<br />
prereactive region have been correctly evaluated in the<br />
theoretical simulation, to nearly spectroscopic (1 cm -1 )<br />
accuracy. Calculations at this same level <strong>of</strong> theory predict<br />
nonadiabatic effects in the reaction to be small; the SEVI<br />
experiments support this conclusion and suggest a reexamination<br />
<strong>of</strong> the experimental results claiming high<br />
reactivity <strong>of</strong> Cl*.<br />
We have recently performed an analogous experiment on a<br />
related polyatomic system, using SEVI <strong>of</strong> Cl - (CH 4 ) to probe<br />
the Cl ···CH 4 prereactive vdW complex for the Cl + CH 4<br />
reaction. The Cl + CH 4 reaction has evolved into a benchmark<br />
polyatomic chemical reaction over the last several years that is<br />
accessible to detailed experimental and theoretical analysis. 70<br />
The Cl + CH 4 reaction is important in atmospheric ozone<br />
chemistry as it controls the Cl/HCl balance in the stratosphere. 184<br />
This reaction has been studied in several laboratories as a model<br />
for mode-specific chemistry, 185-189 in which the effect <strong>of</strong> exciting<br />
specific vibrational modes <strong>of</strong> the CH 4 reactant on the reaction<br />
cross section has been investigated and compared to the effect<br />
<strong>of</strong> reactant translational energy.<br />
The anion structure for Cl-(CH 4 ) has been investigated by<br />
Bieske and co-workers 190,191 through a combination <strong>of</strong> infrared<br />
spectroscopy and electronic structure calculations. It is found<br />
to have a C 3ν structure with a linear X-H-C bond in which<br />
the Cl - is bound to the vertex <strong>of</strong> the CH 4 tetrahedron. The<br />
calculated Cl-C bond length in the anion is 3.704 Å. Based on<br />
these results, photodetachment <strong>of</strong> Cl - (CH 4 ) should access the<br />
prereactive vdW region for the Cl + CH 4 reaction.<br />
We have recently obtained SEVI spectra <strong>of</strong> Cl - (CH 4 ) and<br />
Cl - (CD 4 ), shown in Figure 12, that show extensive, lowfrequency<br />
structure. Using the measured association enthalpy<br />
<strong>of</strong> 3.8 kcal/mol for Cl - (CH 4 ), 192 and the electron affinity <strong>of</strong> Cl,<br />
we can show that all the vibrational structure in the Cl-(CH 4 )<br />
SEVI spectrum lies below the Cl + CH 4 asymptote, i.e. it<br />
corresponds to bound Cl ···CH 4 states. By analogy to ClH - 2 , 182<br />
we would expect the Cl - (CH 4 ) spectrum to comprise progressions<br />
in at least two vibrational modes <strong>of</strong> the neutral Cl ···CH 4<br />
complex: hindered rotor motion <strong>of</strong> the CH 4 and the Cl ···CH 4<br />
van der Waals stretch. The low-frequency structure is not readily<br />
assignable, but the peak spacings are clearly smaller in the<br />
Cl( 2 P 3/2 ) ···CD 4 band (bottom panel) than in the Cl( 2 P 3/2 ) ···CH 4<br />
band. This large isotope effect suggests that there is considerable<br />
activity in the hindered rotation <strong>of</strong> the methane moiety in the<br />
spectra.<br />
The low frequency structure in the SEVI spectra reflects<br />
the rather complex topology <strong>of</strong> the reactant Cl + CH 4 reactant<br />
valley. In contrast to Cl + H 2 , there are three viable minimum<br />
energy geometries for van der Waals mimina in the Cl +<br />
CH 4 entrance valley with the Cl bound to the vertex, the<br />
edge, or the face <strong>of</strong> the tetrahedron defined by the CH 4<br />
molecule. The first and third bonding motifs have C 3V<br />
symmetry while the second has C 2V symmetry. Calculations<br />
<strong>of</strong> this region <strong>of</strong> the Cl + CH 4 surface appear to be quite<br />
sensitive to the method used: one calculation finds the edge<br />
and face structures to be minima, with binding energies <strong>of</strong><br />
276 and 348 cm -1 , respectively, with a saddle point at the<br />
vertex, 193 while another finds more weakly bound minima<br />
(∼100 cm -1 ) at the vertex and face geometries. 194 The SEVI<br />
spectra represent the projection <strong>of</strong> the anion wave function<br />
onto the large-amplitude vibrations supported on the neutral<br />
surface and can, in principle, distinguish among the possible<br />
topologies suggested by the electronic structure calculations.<br />
This process will require high level, multidimensional<br />
simulations on model potential energy surfaces for the anion<br />
and neutral. Efforts are currently underway to collaborate<br />
with theory groups in order to carry out these calculations.<br />
IV. Summary and Outlook<br />
The combination <strong>of</strong> high resolution and versatility <strong>of</strong>fered<br />
by SEVI suggests that it will become a powerful new tool in<br />
probing reactive free radicals, open-shell complexes, clusters,<br />
and transition states by negative ion photodetachment. The<br />
results presented in this paper represent the “tip <strong>of</strong> the iceberg”;<br />
studies <strong>of</strong> many more systems are currently underway in our<br />
laboratory.<br />
However, the enhanced capabilities <strong>of</strong> SEVI compared to<br />
more established photoelectron spectroscopic methods bring<br />
about a new set <strong>of</strong> challenges. The low-frequency structure<br />
resolved in the SEVI spectra represents large-amplitude, anharmonic<br />
nuclear motion that is considerably more difficult to<br />
analyze than the high-frequency, nearly harmonic vibrational<br />
structure that typically dominates photoelectron spectra, even<br />
if only single Born-Oppenheimer potential energy surfaces are<br />
involved. The presence <strong>of</strong> vibronic coupling introduces further<br />
complications. The recently measured SEVI spectrum <strong>of</strong> C 3 H -<br />
is an example <strong>of</strong> the complexity that can arise. 195 We observed<br />
an irregular set <strong>of</strong> transitions from the ã 3 A′′ bent state <strong>of</strong> the<br />
anion to the quasi-linear X˜ 2 Π state <strong>of</strong> C 3 H (both species have<br />
slightly lower-lying cyclic isomers). The bent anion state has a<br />
relatively low barrier to linearity, around 500 cm -1 , 196 and the<br />
neutral à 2 Π state exhibits strong Renner-Teller coupling. 197<br />
Simulation <strong>of</strong> this spectrum thus requires accounting for the<br />
combination <strong>of</strong> large-amplitude bending motion in the anion<br />
with vibronic coupling in the neutral and presents a real<br />
challenge Efficient methods for calculating both energy levels<br />
and wave functions for both the anion and neutral are needed,<br />
and the development <strong>of</strong> these will be greatly facilitated by close<br />
collaboration with theory.<br />
On the experimental side, the resolution <strong>of</strong> SEVI is sufficiently<br />
high that it is <strong>of</strong>ten in practice limited by the<br />
temperature <strong>of</strong> the anion beam. The free jet source used in the<br />
current configuration <strong>of</strong> our instrument can <strong>of</strong>ten achieve ion<br />
temperatures below 100 K, but more efficient and systematic<br />
cooling schemes would be desirable. There have been significant<br />
advances in recent years in trapping and cooling ions to<br />
considerably lower temperatures using radio frequency techniques.<br />
198-200 The incorporation <strong>of</strong> this capability into a SEVI<br />
experiment would produce significant benefits.<br />
Acknowledgment. This research is supported by the Air<br />
Force Office <strong>of</strong> Scientific Research under Grant No. F496290-<br />
03-10085. D.M.M. thanks Andreas Osterwalder, Matthew Nee,<br />
Jia Zhou, Etienne Garand, and Tara Yacovitch for their<br />
contributions to this project.<br />
References and Notes<br />
(1) Brehm, B.; Gusinow, M. A.; Hall, J. L. Phys. ReV. Lett. 1967,<br />
19, 737.<br />
(2) Leopold, D. G.; Ho, J.; Lineberger, W. C. J. Chem. Phys. 1987,<br />
86, 1715.
Centennial Feature Article J. Phys. Chem. A, Vol. 112, No. 51, 2008 13299<br />
(3) Cheshnovsky, O.; Yang, S. H.; Pettiette, C. L.; Craycraft, M. J.;<br />
Liu, Y.; Smalley, R. E. Chem. Phys. Lett. 1987, 138, 119.<br />
(4) Gantefor, G.; Gausa, M.; Meiwesbroer, K. H.; Lutz, H. O. Faraday<br />
Disc. 1988, 197.<br />
(5) Handschuh, H.; Cha, C. Y.; Bechthold, P. S.; Gantefor, G.;<br />
Eberhardt, W. J. Chem. Phys. 1995, 102, 6406.<br />
(6) Wu, H. B.; Desai, S. R.; Wang, L. S. Phys. ReV. Lett. 1996, 77,<br />
2436.<br />
(7) Busani, R.; Folkers, M.; Cheshnovsky, O. Phys. ReV. Lett. 1998,<br />
81, 3836.<br />
(8) Kostko, O.; Huber, B.; Moseler, M.; von Issendorff, B. Phys. ReV.<br />
Lett. 2007, 98.<br />
(9) Markovich, G.; Pollack, S.; Giniger, R.; Cheshnovsky, O. J. Chem.<br />
Phys. 1994, 101, 9344.<br />
(10) Castleman, A. W., Jr.; Bowen, K. H., Jr J. Phys. Chem. 1996,<br />
100, 12911.<br />
(11) Hendricks, J. H.; Lyapustina, S. A.; Declercq, H. L.; Snodgrass,<br />
J. T.; Bowen, K. H. J. Chem. Phys. 1996, 104, 7788.<br />
(12) Schiedt, J.; Weinkauf, R.; Neumark, D. M.; Schlag, E. W. Chem.<br />
Phys. 1998, 239, 511.<br />
(13) Coe, J. V.; Lee, G. H.; Eaton, J. G.; Arnold, S. T.; Sarkas, H. W.;<br />
Bowen, K. H.; Ludewigt, C.; Haberland, H.; Worsnop, D. R. J. Chem. Phys.<br />
1990, 92, 3980.<br />
(14) Kim, J.; Becker, I.; Cheshnovsky, O.; Johnson, M. A. Chem. Phys.<br />
Lett. 1998, 297, 90.<br />
(15) Verlet, J. R. R.; Bragg, A. E.; Kammrath, A.; Cheshnovsky, O.;<br />
Neumark, D. M. Science 2005, 307, 93.<br />
(16) Lee, G. H.; Arnold, S. T.; Eaton, J. G.; Sarkas, H. W.; Bowen,<br />
K. H.; Ludewigt, C.; Haberland, H. Z. Phys. D 1991, 20, 9.<br />
(17) Lee, I. R.; Lee, W.; Zewail, A. H. ChemPhysChem 2008, 9, 83.<br />
(18) Mitsui, M.; Nakajima, A.; Kaya, K. J. Chem. Phys. 2002, 117,<br />
9740.<br />
(19) Mitsui, M.; Ando, N.; Kokubo, S.; Nakajima, A.; Kaya, K. Phys.<br />
ReV. Lett. 2003, 91, 153002.<br />
(20) Polanyi, J. C.; Zewail, A. H. Acc. Chem. Res. 1995, 28, 119.<br />
(21) Neumark, D. M. Phys. Chem. Chem. Phys. 2005, 7, 433.<br />
(22) Wang, L. S.; Ding, C. F.; Wang, X. B.; Barlow, S. E. ReV. Sci.<br />
Instrum. 1999, 70, 1957.<br />
(23) Kitsopoulos, T. N.; Waller, I. M.; Loeser, J. G.; Neumark, D. M.<br />
Chem. Phys. Lett. 1989, 159, 300.<br />
(24) Muller-Dethlefs, K.; Sander, M.; Schlag, E. W. Chem. Phys. Lett.<br />
1984, 112, 291.<br />
(25) Muller-Dethlefs, K.; Schlag, E. W. Annu. ReV. Phys. Chem. 1991,<br />
42, 109.<br />
(26) Waller, I. M.; Kitsopoulos, T. N.; Neumark, D. M. J. Phys. Chem.<br />
1990, 94, 2240.<br />
(27) Wetzel, D. M.; Brauman, J. I. Chem. ReV. 1987, 87, 607.<br />
(28) Osterwalder, A.; Nee, M. J.; Zhou, J.; Neumark, D. M. J. Chem.<br />
Phys. 2004, 121, 6317.<br />
(29) Turner, D. W. Molecular Photoelectron Spectroscopy; Wiley:<br />
London, 1970.<br />
(30) Berkowitz, J. Photoabsorption, Photoionization, and Photoelectron<br />
Spectroscopy; Academic Press: New York, 1979.<br />
(31) Siegel, M. W.; Bennett, R. A.; Celotta, R. J.; Hall, J. L.; Levine,<br />
J. Phys. ReV. A1972, 6, 607.<br />
(32) Kasdan, A.; Herbst, E.; Lineberger, W. C. J. Chem. Phys. 1975,<br />
62, 541.<br />
(33) Kasdan, A.; Lineberger, W. C. Phys. ReV. A1974, 10, 1658.<br />
(34) Feigerle, C. S.; Corderman, R. R.; Bobashev, S. V.; Lineberger,<br />
W. C. J. Chem. Phys. 1981, 74, 1580.<br />
(35) Ervin, K. M.; Lineberger, W. C. J. Phys. Chem. 1991, 95, 1167.<br />
(36) Breyer, F.; Frey, P.; Hotop, H. Z. Phys. A 1981, 300, 7.<br />
(37) Oakes, J. M.; Ellison, G. B. J. Am. Chem. Soc. 1983, 105, 2969.<br />
(38) Snodgrass, J. T.; Coe, J. V.; Freidh<strong>of</strong>f, C. B.; McHugh, K. M.;<br />
Bowen, K. H. Faraday Discuss. 1988, 241.<br />
(39) Bengali, A. A.; Casey, S. M.; Cheng, C. L.; Dick, J. P.; Fenn,<br />
P. T.; Villalta, P. W.; Leopold, D. G. J. Am. Chem. Soc. 1992, 114, 5257.<br />
(40) Rienstra-Kirac<strong>of</strong>e, J. C.; Tschumper, G. S.; Schaefer, H. F.; Nandi,<br />
S.; Ellison, G. B. Chem. ReV. 2002, 102, 231.<br />
(41) Ervin, K. M.; Ho, J.; Lineberger, W. C. J. Phys. Chem. 1988, 92,<br />
5405.<br />
(42) Cooper, J.; Zare, R. N. J. Chem. Phys. 1968, 48, 942.<br />
(43) Reid, K. L. Annu. ReV. Phys. Chem. 2003, 54, 397.<br />
(44) Johnson, M. A.; Lineberger, W. C. Pulsed methods for cluster<br />
ion spectroscopy. In Techniques <strong>of</strong> Chemistry; Farrar, J. M., Saunders,<br />
W. H., Jr., Eds.; Wiley Journal: New York, 1988; Vol. 20, pp 591-635.<br />
(45) Posey, L. A.; Deluca, M. J.; Johnson, M. A. Chem. Phys. Lett.<br />
1986, 131, 170.<br />
(46) Alexander, M. L.; Levinger, N. E.; Johnson, M. A.; Ray, D.;<br />
Lineberger, W. C. J. Chem. Phys. 1988, 88, 6200.<br />
(47) Osborn, D. L.; Leahy, D. J.; Cyr, D. R.; Neumark, D. M. J. Chem.<br />
Phys. 1996, 104, 5026.<br />
(48) Arnold, D. W.; Bradforth, S. E.; Kitsopoulos, T. N.; Neumark,<br />
D. M. J. Chem. Phys. 1991, 95, 8753.<br />
(49) Metz, R. B.; Weaver, A.; Bradforth, S. E.; Kitsopoulos, T. N.;<br />
Neumark, D. M. J. Phys. Chem. 1990, 94, 1377.<br />
(50) Cheshnovsky, O.; Taylor, K. J.; Conceicao, J.; Smalley, R. E. Phys.<br />
ReV. Lett. 1990, 64, 1785.<br />
(51) Yang, J.; Wang, X. B.; Xing, X. P.; Wang, L. S. J. Chem. Phys.<br />
2008, 128.<br />
(52) Kruit, P.; Read, F. H. J. Phys. E 1983, 16, 313.<br />
(53) Cheshnovsky, O.; Yang, S. H.; Pettiette, C. L.; Craycraft, M. J.;<br />
Smalley, R. E. ReV. Sci. Instrum. 1987, 58, 2131.<br />
(54) Hotop, H.; Lineberger, W. C. J. Phys. Chem. Ref. Data 1985, 14,<br />
731.<br />
(55) Handschuh, H.; Gantefor, G.; Eberhardt, W. ReV. Sci. Instrum.<br />
1995, 66, 3838.<br />
(56) Giniger, R.; Hippler, T.; Ronen, S.; Cheshnovsky, O. ReV. Sci.<br />
Instrum. 2001, 72, 2543.<br />
(57) Wang, L.-S.; Cheng, H.-S.; Fan, J. J. Chem. Phys. 1995, 102,<br />
9480.<br />
(58) Gerhards, M.; Thomas, O. C.; Nilles, J. M.; Zheng, W. J.; Bowen,<br />
K. H. J. Chem. Phys. 2002, 116, 10247.<br />
(59) Baguenard, B.; Pinare, J. C.; Bordas, C.; Broyer, M. Phys. ReV.<br />
A 2001, 6302, 3204.<br />
(60) Baguenard, B.; Pinare, J. C.; Lepine, F.; Bordas, C.; Broyer, M.<br />
Chem. Phys. Lett. 2002, 352, 147.<br />
(61) Surber, E.; Sanov, A. J. Chem. Phys. 2002, 116, 5921.<br />
(62) Surber, E.; Sanov, A. Phys. ReV. Lett. 2003, 90, 3001.<br />
(63) Chandler, D. W.; Houston, P. L. J. Chem. Phys. 1987, 87, 1445.<br />
(64) Heck, A. J. R.; Chandler, D. W. Annu. ReV. Phys. Chem. 1995,<br />
46, 335.<br />
(65) Helm, H.; Bjerre, N.; Dyer, M. J.; Huestis, D. L.; Saeed, M. Phys.<br />
ReV. Lett. 1993, 70, 3221.<br />
(66) Eppink, A. T. J. B.; Parker, D. H. ReV. Sci. Instrum. 1997, 68,<br />
3477.<br />
(67) Suzuki, T.; Whitaker, B. J. Int. ReV. Phys. Chem. 2001, 20, 313.<br />
(68) Stolow, A.; Bragg, A. E.; Neumark, D. M. Chem. ReV. 2004, 104,<br />
1719.<br />
(69) Ashfold, M. N. R.; Nahler, N. H.; Orr-Ewing, A. J.; Vieuxmaire,<br />
O. P. J.; Toomes, R. L.; Kitsopoulos, T. N.; Garcia, I. A.; Chestakov, D. A.;<br />
Wu, S. M.; Parker, D. H. Phys. Chem. Chem. Phys. 2006, 8, 26.<br />
(70) Liu, K. P. Phys. Chem. Chem. Phys. 2007, 9, 17.<br />
(71) Sanov, A.; Mabbs, R. Int. ReV. Phys. Chem. 2008, 27, 53.<br />
(72) Suits, A. G. Acc. Chem. Res. 2008, 41, 873.<br />
(73) Cavanagh, S. J.; Gibson, S. T.; Gale, M. N.; Dedman, C. J.;<br />
Roberts, E. H.; Lewis, B. R. Phys. ReV. A2007, 76.<br />
(74) Gantefor, G. F.; Cox, D. M.; Kaldor, A. J. Chem. Phys. 1990, 93,<br />
8395.<br />
(75) Bassmann, C.; Boesl, U.; Yang, D.; Drechsler, G.; Schlag, E. W.<br />
Int. J. Mass Spec. Ion Proc 1996, 159, 153.<br />
(76) Distelrath, V.; Boesl, U. Faraday Disc. 2000, 115, 161.<br />
(77) Lenzer, T.; Yourshaw, I.; Furlanetto, M. R.; Reiser, G.; Neumark,<br />
D. M. J. Chem. Phys. 1999, 110, 9578.<br />
(78) Reiser, G.; Muller-Dethlefs, K. J. Phys. Chem. 1992, 96, 9.<br />
(79) Chupka, W. A. J. Chem. Phys. 1993, 98, 4520.<br />
(80) Wigner, E. P. Phys. ReV. 1948, 71, 1002.<br />
(81) Kitsopoulos, T. N.; Chick, C. J.; Weaver, A.; Neumark, D. M.<br />
J. Chem. Phys. 1990, 93, 6108.<br />
(82) Arnold, C. C.; Neumark, D. M. J. Chem. Phys. 1993, 99, 3353.<br />
(83) Rohlfing, C. M.; Raghavachari, K. J. Chem. Phys. 1992, 96, 2114.<br />
(84) Reed, K. J.; Zimmerman, A. H.; Anderson, H. C.; Brauman, J. I.<br />
J. Chem. Phys. 1976, 64, 1368.<br />
(85) Kitsopoulos, T. N.; Chick, C. J.; Zhao, Y.; Neumark, D. M.<br />
J. Chem. Phys. 1991, 95, 5479.<br />
(86) Arnold, C. C.; Zhao, Y. X.; Kitsopoulos, T. N.; Neumark, D. M.<br />
J. Chem. Phys. 1992, 97, 6121.<br />
(87) Kitsopoulos, T. N.; Chick, C. J.; Zhao, Y.; Neumark, D. M.<br />
J. Chem. Phys. 1991, 95, 1441.<br />
(88) Arnold, C. C.; Kitsopoulos, T. N.; Neumark, D. M. J. Chem. Phys.<br />
1993, 99, 766.<br />
(89) Arnold, C. C.; Neumark, D. M. J. Chem. Phys. 1994, 100, 1797.<br />
(90) Arnold, C. C.; Xu, C. S.; Burton, G. R.; Neumark, D. M. J. Chem.<br />
Phys. 1995, 102, 6982.<br />
(91) Burton, G. R.; Xu, C. S.; Arnold, C. C.; Neumark, D. M. J. Chem.<br />
Phys. 1996, 104, 2757.<br />
(92) Zhao, Y. X.; Yourshaw, I.; Reiser, G.; Arnold, C. C.; Neumark,<br />
D. M. J. Chem. Phys. 1994, 101, 6538.<br />
(93) Yourshaw, I.; Lenzer, T.; Reiser, G.; Neumark, D. M. J. Chem.<br />
Phys. 1998, 109, 5247.<br />
(94) Wolf, I.; Ronen, S.; Giniger, R.; Cheshnovsky, O. J. Chem. Phys.<br />
2005, 122.<br />
(95) Offerhaus, H. L.; Nicole, C.; Lepine, F.; Bordas, C.; Rosca-Pruna,<br />
F.; Vrakking, M. J. J. ReV. Sci. Instrum. 2001, 72, 3245.
13300 J. Phys. Chem. A, Vol. 112, No. 51, 2008 Neumark<br />
(96) Blondel, C.; Delsart, C.; Dulieu, F. Phys. ReV. Lett. 1996, 77,<br />
3755.<br />
(97) Delsart, C.; Goldfarb, F.; Blondel, C. Phys. ReV. Lett. 2002, 89.<br />
(98) Zhou, J.; Garand, E.; Neumark, D. M. J. Chem. Phys. 2007, 127,<br />
114313.<br />
(99) Hansen, E. W.; Law, P. L. J. Opt. Sci. Am. A 1985, 2, 510.<br />
(100) Xu, C.; Taylor, T. R.; Burton, G. R.; Neumark, D. M. J. Chem.<br />
Phys. 1998, 108, 1395.<br />
(101) Gebhardt, C. R.; Rakitzis, T. P.; Samartzis, P. C.; Ladopoulos,<br />
V.; Kitsopoulos, T. N. ReV. Sci. Instrum. 2001, 72, 3848.<br />
(102) Townsend, D.; Minitti, M. P.; Suits, A. G. ReV. Sci. Instrum. 2003,<br />
74, 2530.<br />
(103) Ichino, T.; Gianola, A. J.; Lineberger, W. C.; Stanton, J. F.<br />
J. Chem. Phys. 2006, 125.<br />
(104) Mahapatra, S.; Cederbaum, L. S.; Koppel, H. J. Chem. Phys. 1999,<br />
111, 10452.<br />
(105) Chen, P. Photoelectron Spectroscopy <strong>of</strong> Reactive Intermediates.<br />
In Unimolecular and Bimolecular Ion-Molecule Reaction Dynamics; Ng,<br />
C. Y., Baer, T., Powis, I., Eds.; Wiley: New York, 1994; pp 371-426.<br />
(106) Koppel, H.; Domcke, W.; Cederbaum, L. S. AdV. Chem. Phys.<br />
1984, 57, 59.<br />
(107) Engelking, P. C.; Lineberger, W. C. J. Chem. Phys. 1977, 67,<br />
1412.<br />
(108) Ichino, T.; Wren, S. W.; Vogelhuber, K. M.; Gianola, A. J.;<br />
Lineberger, W. C.; Stanton, J. F. J. Chem. Phys. 2008, 129.<br />
(109) Weaver, A.; Arnold, D. W.; Bradforth, S. E.; Neumark, D. M.<br />
J. Chem. Phys. 1991, 94, 1740.<br />
(110) Mayer, M.; Cederbaum, L. S.; Koppel, H. J. Chem. Phys. 1994,<br />
100, 899.<br />
(111) Stanton, J. F. J. Chem. Phys. 2007, 126.<br />
(112) Faraji, S.; Koppel, H.; Eisfeld, W.; Mahapatra, S. Chem. Phys.<br />
2008, 347, 110.<br />
(113) Mahapatra, S.; Eisfeld, W.; Koppel, H. Chem. Phys. Lett. 2007,<br />
441, 7.<br />
(114) Asmis, K. R.; Taylor, T. R.; Neumark, D. M. J. Chem. Phys. 1999,<br />
111, 8838.<br />
(115) Garand, E.; Yacovitch, T. I.; Neumark, D. M. J. Chem. Phys. 2008,<br />
129.<br />
(116) Zengin, V.; Persson, B. J.; Strong, K. M.; Continetti, R. E. J. Chem.<br />
Phys. 1996, 105, 9740.<br />
(117) Choi, H.; Mordaunt, D. H.; Bise, R. T.; Taylor, T. R.; Neumark,<br />
D. M. J. Chem. Phys. 1998, 108, 4070.<br />
(118) Kiefer, J. H.; Sidhu, S. S.; Kern, R. D.; Xie, K.; Chen, H.; Harding,<br />
L. B. Combust. Sci. Technol. 1992, 82, 101.<br />
(119) Guelin, M.; Green, S.; Thaddeus, P. Astrophys. J. 1978, 224, L27.<br />
(120) Cernicharo, J.; Guelin, M. Astron. Astrophys. 1996, 309, L27.<br />
(121) McCarthy, M. C.; Gottlieb, C. A.; Gupta, H.; Thaddeus, P.<br />
Astrophys. J. 2006, 652, L141.<br />
(122) Cernicharo, J.; Guelin, M.; Agundez, M.; Kawaguchi, K.; Mc-<br />
Carthy, M. C.; Thaddeus, P. Astron. Astrophys. 2007, 467, L37.<br />
(123) McCarthy, M. C.; Travers, M. J.; Kovacs, A.; Gottlieb, C. A.;<br />
Thaddeus, P. Astrophys. J. Suppl. Ser. 1997, 113, 105.<br />
(124) Gottlieb, C. A.; McCarthy, M. C.; Travers, M. J.; Grabow, J. U.;<br />
Thaddeus, P. J. Chem. Phys. 1998, 109, 5433.<br />
(125) Stephens, J. W.; Yan, W. B.; Richnow, M. L.; Solka, H.; Curl,<br />
R. F. J. Mol. Struct. 1988, 190, 41.<br />
(126) Taylor, T. R.; Xu, C. S.; Neumark, D. M. J. Chem. Phys. 1998,<br />
108, 10018.<br />
(127) Peric, M.; Peyerimh<strong>of</strong>f, S. D.; Buenker, R. J. Z. Phys. D 1992,<br />
24, 177.<br />
(128) Tarroni, R.; Carter, S. Mol. Phys. 2004, 102, 2167.<br />
(129) Curl, R. F.; Carrick, P. G.; Merer, A. J. J. Chem. Phys. 1985, 82,<br />
3479.<br />
(130) Christophorou, L. G.; McCorkle, D. L.; Carter, J. G. J. Chem.<br />
Phys. 1971, 54, 253.<br />
(131) Zhou, J.; Garand, E.; Neumark, D. M. J. Chem. Phys. 2007, 127,<br />
154320.<br />
(132) McCarthy, M. C.; Gottlieb, C. A.; Thaddeus, P.; Horn, M.;<br />
Botschwina, P. J. Chem. Phys. 1995, 103, 7820.<br />
(133) Graf, S.; Geiss, J.; Leutwyler, S. J. Chem. Phys. 2001, 114, 4542.<br />
(134) Graf, P.; Nitzan, A.; Diercksen, G. H. F. J. Phys. Chem. 1996,<br />
100, 18916.<br />
(135) Zhou, J.; Garand, E.; Eisfeld, W.; Neumark, D. M. J. Chem. Phys.<br />
2007, 127.<br />
(136) Nee, M. J.; Osterwalder, A.; Zhou, J.; Neumark, D. M. J. Chem.<br />
Phys. 2006, 125, 014306.<br />
(137) Nguyen, T. L.; Mebel, A. M.; Kaiser, R. I. J. Phys. Chem. A 2001,<br />
105, 3284.<br />
(138) Wheeler, S. E.; Robertson, K. A.; Allen, W. D.; Schaefer, H. F.;<br />
Bomble, Y. J.; Stanton, J. F. J. Phys. Chem. A 2007, 111, 3819.<br />
(139) Goncher, S. J.; Moore, D. T.; Sveum, N. E.; Neumark, D. M.<br />
J. Chem. Phys. 2008, 128, 114303.<br />
(140) Robinson, M. S.; Polak, M. L.; Bierbaum, V. M.; Depuy, C. H.;<br />
Lineberger, W. C. J. Am. Chem. Soc. 1995, 117, 6766.<br />
(141) Eisfeld, W. Phys. Chem. Chem. Phys. 2005, 7, 3924.<br />
(142) Inoue, G.; Akimoto, H.; Okuda, M. J. Chem. Phys. 1980, 72, 1769.<br />
(143) Powers, D. E.; Hopkins, J. B.; Smalley, R. E. J. Phys. Chem. 1981,<br />
85, 2711.<br />
(144) Foster, S. C.; Misra, P.; Lin, T. Y. D.; Damo, C. P.; Carter, C. C.;<br />
Miller, T. A. J. Phys. Chem. 1988, 92, 5914.<br />
(145) Powers, D. E.; Pushkarsky, M. B.; Miller, T. A. J. Chem. Phys.<br />
1997, 106, 6863.<br />
(146) Lee, Y. Y.; Wann, G. H.; Lee, Y. P. J. Chem. Phys. 1993, 99,<br />
9465.<br />
(147) Misra, P.; Zhu, X. M.; Hsueh, C. Y.; Halpern, J. B. Chem. Phys.<br />
1993, 178, 377.<br />
(148) Carrick, P. G.; Brossard, S. D.; Engelking, P. C. J. Chem. Phys.<br />
1985, 83, 1995.<br />
(149) Geers, A.; Kappert, J.; Temps, F.; Sears, T. J. J. Chem. Phys.<br />
1993, 98, 4297.<br />
(150) Geers, A.; Kappert, J.; Temps, F.; Wiebrecht, J. W. J. Chem. Phys.<br />
1994, 101, 3618.<br />
(151) Engelking, P. C.; Ellison, G. B.; Lineberger, W. C. J. Chem. Phys.<br />
1978, 69, 1826.<br />
(152) Osborn, D. L.; Leahy, D. J.; Kim, E. H.; deBeer, E.; Neumark,<br />
D. M. Chem. Phys. Lett. 1998, 292, 651.<br />
(153) Ramond, T. M.; Davico, G. E.; Schwartz, R. L.; Lineberger, W. C.<br />
J. Chem. Phys. 2000, 112, 1158.<br />
(154) Osborn, D. L.; Leahy, D. J.; Ross, E. M.; Neumark, D. M. Chem.<br />
Phys. Lett. 1995, 235, 484.<br />
(155) Osborn, D. L.; Leahy, D. J.; Neumark, D. M. J. Phys. Chem. A<br />
1997, 101, 6583.<br />
(156) Barckholtz, T. A.; Miller, T. A. Int. ReV. Phys. Chem. 1998, 17,<br />
435.<br />
(157) Hoper, U.; Botschwina, P.; Koppel, H. J. Chem. Phys. 2000, 112,<br />
4132.<br />
(158) Schmidt-Klugmann, J.; Koppel, H.; Schmatz, S.; Botschwina, P.<br />
Chem. Phys. Lett. 2003, 369, 21.<br />
(159) Marenich, A. V.; Boggs, J. E. Chem. Phys. Lett. 2005, 404, 351.<br />
(160) Gruebele, M.; Roberts, G.; Zewail, A. H. Phil. Trans. Roy. Soc.<br />
London A 1990, 332, 223.<br />
(161) Foster, S. C.; Hsu, Y. C.; Damo, C. P.; Liu, X. M.; Kung, C. Y.;<br />
Miller, T. A. J. Phys. Chem. 1986, 90, 6766.<br />
(162) Curtiss, L. A.; Lucas, D. J.; Pople, J. A. J. Chem. Phys. 1995,<br />
102, 3292.<br />
(163) Schuurman, M. S.; Young, R. A.; Yarkony, D. R. Chem. Phys.<br />
2008, 347, 57.<br />
(164) Young, R. A.; Yarkony, D. R. J. Chem. Phys. 2006, 125.<br />
(165) Burnett, S. M.; Stevens, A. E.; Feigerle, C. S.; Lineberger, W. C.<br />
Chem. Phys. Lett. 1983, 100, 124.<br />
(166) de Beer, E.; Kim, E. H.; Neumark, D. M.; Gunion, R. F.;<br />
Lineberger, W. C. J. Phys. Chem. 1995, 99, 13627.<br />
(167) Wenthold, P. G.; Hrovat, D. A.; Borden, W. T.; Lineberger, W. C.<br />
Science 1996, 272, 1456.<br />
(168) Neumark, D. M. J. Chem. Phys. 2006, 125.<br />
(169) Weaver, A.; Metz, R. B.; Bradforth, S. E.; Neumark, D. M.<br />
J. Chem. Phys. 1990, 93, 5352.<br />
(170) Manolopoulos, D. E.; Stark, K.; Werner, H. J.; Arnold, D. W.;<br />
Bradforth, S. E.; Neumark, D. M. Science 1993, 262, 1852.<br />
(171) Wild, D. A.; Weiser, P. S.; Bieske, E. J.; Zehnacker, A. J. Chem.<br />
Phys. 2001, 115, 824.<br />
(172) Bian, W. S.; Werner, H. J. J. Chem. Phys. 2000, 112, 220.<br />
(173) Alagia, M.; Balucani, N.; Cartechini, L.; Casavecchia, P.; Vankleef,<br />
E. H.; Volpi, G. G.; Aoiz, F. J.; Banares, L.; Schwenke, D. W.; Allison,<br />
T. C.; Mielke, S. L.; Truhlar, D. G. Science 1996, 273, 1519.<br />
(174) Alagia, M.; Balucani, N.; Cartechini, L.; Casavecchia, P.; Volpi,<br />
G. G.; Aoiz, F. J.; Banares, L.; Allison, T. C.; Mielke, S. L.; Truhlar, D. G.<br />
Phys. Chem. Chem. Phys. 2000, 2, 599.<br />
(175) Wheeler, M. D.; Anderson, D. T.; Lester, M. I. Int. ReV. Phys.<br />
Chem. 2000, 19, 501.<br />
(176) Lester, M. I.; Pond, B. V.; Marshall, M. D.; Anderson, D. T.;<br />
Harding, L. B.; Wagner, A. F. Faraday Disc. 2001, 118, 373.<br />
(177) Skouteris, D.; Manolopoulos, D. E.; Bian, W. S.; Werner, H. J.;<br />
Lai, L. H.; Liu, K. P. Science 1999, 286, 1713.<br />
(178) Dong, F.; Lee, S. H.; Liu, K. J. Chem. Phys. 2001, 115, 1197.<br />
(179) Alexander, M. H.; Capecchi, G.; Werner, H. J. Science 2002, 296,<br />
715.<br />
(180) Manolopoulos, D. E.; Alexander, M. H. Phys. Chem. Chem. Phys.<br />
2004, 6, 4984.<br />
(181) Ferguson, M. J.; Meloni, G.; Gomez, H.; Neumark, D. M. J. Chem.<br />
Phys. 2002, 117, 8181.<br />
(182) Garand, E.; Zhou, J.; Manolopoulos, D. E.; Alexander, M. H.;<br />
Neumark, D. M. Science 2008, 319, 72.<br />
(183) Alexander, M. H.; Klos, J.; Manolopoulos, D. E. J. Chem. Phys.<br />
2008, 128, 084312.
Centennial Feature Article J. Phys. Chem. A, Vol. 112, No. 51, 2008 13301<br />
(184) Solomon, S. ReV. Geophys. 1999, 37, 275.<br />
(185) Simpson, W. R.; Rakitzis, T. P.; Kandel, S. A.; Orrewing, A. J.;<br />
Zare, R. N. J. Chem. Phys. 1995, 103, 7313.<br />
(186) Yoon, S.; Henton, S.; Zivkovic, A. N.; Crim, F. F. J. Chem. Phys.<br />
2002, 116, 10744.<br />
(187) Bechtel, H. A.; Camden, J. P.; Brown, D. J. A.; Martin, M. R.;<br />
Zare, R. N.; Vodopyanov, K. Angew. Chem., Int. Ed. 2005, 44, 2382.<br />
(188) Yan, S.; Wu, Y. T.; Zhang, B. L.; Yue, X. F.; Liu, K. P. Science<br />
2007, 316, 1723.<br />
(189) Espinosa-Garcia, J. J. Phys. Chem. A 2007, 111, 9654.<br />
(190) Wild, D. A.; Loh, Z. M.; Wolynec, P. P.; Weiser, P. S.; Bieske,<br />
E. J. Chem. Phys. Lett. 2000, 332, 531.<br />
(191) Loh, Z. M.; Wilson, R. L.; Wild, D. A.; Bieske, E. J.; Gordon,<br />
M. S. Aust. J. Chem. 2004, 57, 1157.<br />
(192) Hiraoka, K.; Mizuno, T.; Iino, T.; Eguchi, D.; Yamabe, S. J. Phys.<br />
Chem. A 2001, 105, 4887.<br />
(193) Klos, J. Chem. Phys. Lett. 2002, 359, 309.<br />
(194) Troya, D.; Weiss, P. J. E. J. Chem. Phys. 2006, 124.<br />
(195) Sheehan, S. M.; Parsons, B. F.; Zhou, J.; Garand, E.; Yen, T. A.;<br />
Moore, D. T.; Neumark, D. M. J. Chem. Phys. 2008, 128, 034301.<br />
(196) Pachkov, M.; Pino, T.; Tulej, M.; Maier, J. P. Mol. Phys. 2001,<br />
99, 1397.<br />
(197) Peric, M.; Mladenovic, M.; Tomic, K.; Marian, C. M. J. Chem.<br />
Phys. 2003, 118, 4444.<br />
(198) Gerlich, D. AdV. Chem. Phys. 1992, 82, 1.<br />
(199) Asmis, K. R.; Brummer, M.; Kaposta, C.; Santambrogio, G.; von<br />
Helden, G.; Meijer, G.; Rademann, K.; Woste, L. Phys. Chem. Chem. Phys.<br />
2002, 4, 1101.<br />
(200) Wang, X. B.; Woo, H. K.; Wang, L. S.; Min<strong>of</strong>ar, B.; Jungwirth,<br />
P. J. Phys. Chem. A 2006, 110, 5047.<br />
JP807182Q