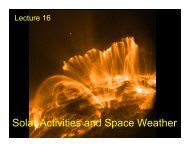
312 Lab Manual - Solar Physics at MSU - Montana State University
312 Lab Manual - Solar Physics at MSU - Montana State University
312 Lab Manual - Solar Physics at MSU - Montana State University

Create successful ePaper yourself
Turn your PDF publications into a flip-book with our unique Google optimized e-Paper software.
•M<strong>at</strong>erials<br />
Stellar Structure<br />
Computer program: Microsoft Excel or Equivalent<br />
•Introduction<br />
When you think of a star, wh<strong>at</strong> properties do<br />
you associ<strong>at</strong>e with it? It’s a hot ball of gas, right?<br />
Wh<strong>at</strong> about th<strong>at</strong> hot ball of gas makes it a star?<br />
A good answer to this question is th<strong>at</strong> a star is<br />
stable. Our Sun, for example, is not exploding<br />
or contracting. Scientists refer to the stability of<br />
stars by saying th<strong>at</strong> they are in hydrost<strong>at</strong>ic<br />
and thermal equilibrium. Hydrost<strong>at</strong>ic equilibrium<br />
is a balance between the forces th<strong>at</strong> act on<br />
the star. The forces include downward pressure<br />
of the gas layers into the center, upward pressure<br />
of the hot gasses, and the downward pull<br />
of gravity due to the weight of the gas itself.<br />
The upward gas pressure must compens<strong>at</strong>e for<br />
both gravity and the pressure of the outer layers.<br />
Thermal equilibrium means th<strong>at</strong> even<br />
though the temper<strong>at</strong>ure in stellar interiors varies<br />
with depth, the temper<strong>at</strong>ure <strong>at</strong> each depth<br />
remains constant in time.<br />
Another important property of a star is how<br />
energy is transported from its center to the surface.<br />
The energy source for stars is the nuclear<br />
reactions th<strong>at</strong> take place in the core. The energy<br />
is transported to the surface by conduction,<br />
convection, and/or radi<strong>at</strong>ive diffusion. In<br />
the sun, energy is transported by radi<strong>at</strong>ive diffusion<br />
from the core to about 0.7 solar radii.<br />
From th<strong>at</strong> depth out, energy is transported by<br />
convection. Some stars have very large radi<strong>at</strong>ive<br />
zones and little or no convective zones, while<br />
others have very deep convective zones.<br />
Scientists use equilibrium concepts, along with<br />
energy transport mechanisms, to construct<br />
models for stellar structure. The models determine<br />
the size, temper<strong>at</strong>ure, and mass of the<br />
star. Some stars are very large and luminous,<br />
but cool. Others are small but very hot. The sun<br />
is a main sequence, or hydrogen burning, star.<br />
In this lab, you will study the rel<strong>at</strong>ionship between<br />
luminosity and three factors: temper<strong>at</strong>ure,<br />
mass, and radius of main sequence stars.<br />
•Procedure<br />
In this lab, you will take a close look <strong>at</strong> how<br />
three aspects of stellar structure (temper<strong>at</strong>ure,<br />
mass, and size) effect luminosity. Scientists often<br />
use luminosity to learn about stellar structure<br />
because it is easily measured, and many<br />
other inform<strong>at</strong>ive quantities can be deduced from<br />
it. You will look specifically <strong>at</strong> main sequence<br />
stars, which generally obey the following equ<strong>at</strong>ions:<br />
1) L/L o<br />
= (T/T o<br />
) 6<br />
2) L/L o<br />
= (M/M o<br />
) 4<br />
3) R/R o<br />
= (M/M o<br />
) 0.7<br />
where L = luminosity, T = temper<strong>at</strong>ure, M =<br />
mass, R = radius, and the subscript o<br />
refers to<br />
the solar value for th<strong>at</strong> variable.<br />
*How is luminosity rel<strong>at</strong>ed to radius?<br />
4) L/L o<br />
= ___________<br />
Use equ<strong>at</strong>ions 1, 2 and 4 to fill out an Excel<br />
table. If you are unfamiliar with doing m<strong>at</strong>h in<br />
Excel, see the instructions on the next page.<br />
You will use logarithmic x and y values to<br />
make a plot of the three luminosity rel<strong>at</strong>ionships<br />
in Excel. The x axis will always have<br />
the same values, referring to T/T o<br />
for the<br />
first rel<strong>at</strong>ionship, M/M o<br />
for the second, and<br />
R/R o<br />
for the last. Calcul<strong>at</strong>e the y axis values<br />
using the appropri<strong>at</strong>e equ<strong>at</strong>ion: (T/T o<br />
) 6 for the<br />
first, etc., then take the logarithm of these values.<br />
Once you’ve made all of your calcul<strong>at</strong>ions,<br />
cre<strong>at</strong>e a plot in Excel. Excel hint: when plotting<br />
this type of d<strong>at</strong>a, use the sc<strong>at</strong>ter plot th<strong>at</strong> cre<strong>at</strong>es<br />
a line through the d<strong>at</strong>a points. Ask your lab<br />
instructor if you have questions on how to cre<strong>at</strong>e<br />
the plot. For credit, turn in your (x,y) values,<br />
plot and answers to the questions below.<br />
•Questions<br />
1) Wh<strong>at</strong> aspect of solar structure increases the<br />
luminosity the most as it increases? The least?<br />
2) Why is it better to plot the logarithm of the<br />
values you calcul<strong>at</strong>ed r<strong>at</strong>her th<strong>at</strong> the actual values?<br />
3) The plot of L/L o<br />
vs. T/T o<br />
is the usual way you<br />
will see a Hertzprung-Russell diagram displayed.<br />
Why is it a straight line instead of a curve? Hint:<br />
look <strong>at</strong> the procedure you followed in the H-R<br />
diagram lab compared to this lab.<br />
Stellar Structure<br />
25