Hoechst 33342 HSC Staining and Stem Cell Purification Protocol
Hoechst 33342 HSC Staining and Stem Cell Purification Protocol
Hoechst 33342 HSC Staining and Stem Cell Purification Protocol

Create successful ePaper yourself
Turn your PDF publications into a flip-book with our unique Google optimized e-Paper software.
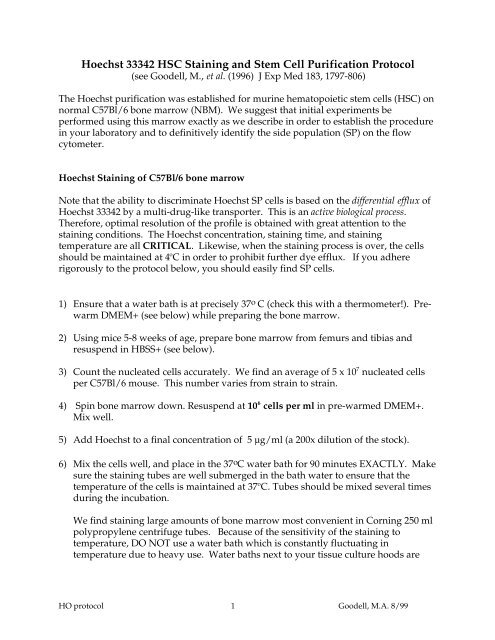
<strong>Hoechst</strong> <strong>33342</strong> <strong>HSC</strong> <strong>Staining</strong> <strong>and</strong> <strong>Stem</strong> <strong>Cell</strong> <strong>Purification</strong> <strong>Protocol</strong><br />
(see Goodell, M., et al. (1996) J Exp Med 183, 1797-806)<br />
The <strong>Hoechst</strong> purification was established for murine hematopoietic stem cells (<strong>HSC</strong>) on<br />
normal C57Bl/6 bone marrow (NBM). We suggest that initial experiments be<br />
performed using this marrow exactly as we describe in order to establish the procedure<br />
in your laboratory <strong>and</strong> to definitively identify the side population (SP) on the flow<br />
cytometer.<br />
<strong>Hoechst</strong> <strong>Staining</strong> of C57Bl/6 bone marrow<br />
Note that the ability to discriminate <strong>Hoechst</strong> SP cells is based on the differential efflux of<br />
<strong>Hoechst</strong> <strong>33342</strong> by a multi-drug-like transporter. This is an active biological process.<br />
Therefore, optimal resolution of the profile is obtained with great attention to the<br />
staining conditions. The <strong>Hoechst</strong> concentration, staining time, <strong>and</strong> staining<br />
temperature are all CRITICAL. Likewise, when the staining process is over, the cells<br />
should be maintained at 4 o C in order to prohibit further dye efflux. If you adhere<br />
rigorously to the protocol below, you should easily find SP cells.<br />
1) Ensure that a water bath is at precisely 37 o C (check this with a thermometer!). Prewarm<br />
DMEM+ (see below) while preparing the bone marrow.<br />
2) Using mice 5-8 weeks of age, prepare bone marrow from femurs <strong>and</strong> tibias <strong>and</strong><br />
resuspend in HBSS+ (see below).<br />
3) Count the nucleated cells accurately. We find an average of 5 x 10 7 nucleated cells<br />
per C57Bl/6 mouse. This number varies from strain to strain.<br />
4) Spin bone marrow down. Resuspend at 10 6 cells per ml in pre-warmed DMEM+.<br />
Mix well.<br />
5) Add <strong>Hoechst</strong> to a final concentration of 5 µg/ml (a 200x dilution of the stock).<br />
6) Mix the cells well, <strong>and</strong> place in the 37 o C water bath for 90 minutes EXACTLY. Make<br />
sure the staining tubes are well submerged in the bath water to ensure that the<br />
temperature of the cells is maintained at 37 o C. Tubes should be mixed several times<br />
during the incubation.<br />
We find staining large amounts of bone marrow most convenient in Corning 250 ml<br />
polypropylene centrifuge tubes. Because of the sensitivity of the staining to<br />
temperature, DO NOT use a water bath which is constantly fluctuating in<br />
temperature due to heavy use. Water baths next to your tissue culture hoods are<br />
HO protocol 1 Goodell, M.A. 8/99
constantly dropping temperature as your friends put 500 ml bottles of ice cold<br />
medium in, or worse, 500 ml of frozen serum.<br />
7) After 90 minutes, spin the cells down in the COLD <strong>and</strong> re-suspended in COLD<br />
HBSS+.<br />
8) At this point samples may be run directly on the FACS or further stained with<br />
antibodies*. All further manipulations MUST be performed at 4 o C to prohibit<br />
leakage of the <strong>Hoechst</strong> dye from the cells. Magnetic enrichments may also be<br />
employed at this stage if the entire procedure is carried out at 4 o C. Alternatively,<br />
perform magnetic enrichments prior to <strong>Hoechst</strong> staining.<br />
9) At the end of the staining, resuspend bone marrow cells in cold HBSS+ containing 2<br />
µg/ml propidium iodide (PI) for dead cell discrimination. This is not required to<br />
see the SP cells, but will help. <strong>Hoechst</strong> is somewhat toxic to the bone marrow, <strong>and</strong><br />
the PI will allow you exclude the dead cells from the profile (see Figure 1).<br />
*Antibody <strong>Staining</strong> of <strong>Hoechst</strong>-stained cells<br />
In order to confirm to your satisfaction that you have the correct population, you may<br />
want to co-stain the <strong>Hoechst</strong>-stained bone marrow with antibodies. We find the mouse<br />
SP population to be very homogeneous with respect to cell surface markers. We<br />
recommend staining with two antibodies, one which positively stains most SP cells<br />
(Sca-1 or c-kit) <strong>and</strong> one which does not stain SP cells but stains a large fraction of the<br />
bone marrow (for example Gr-1, or B220). These antibodies are available from<br />
Pharmingen. We suggest Sca-1-FITC <strong>and</strong> Gr-1-PE. Figure 2 shows typical staining of<br />
whole marrow <strong>and</strong> SP cells with these markers.<br />
<strong>Hoechst</strong> <strong>33342</strong><br />
We obtain from Sigma (called Bis-Benzimide) as a powder <strong>and</strong> resuspend at 1 mg/ml in<br />
water, filter sterilize, <strong>and</strong> freeze in small aliquots. Since Hoecsht is not costly, there is<br />
no reason to reuse old or frozen dye.<br />
HBSS+<br />
Hanks Balanced Salt Solution (from Gibco) with 2% Fetal Calf Serum <strong>and</strong> 10 mM<br />
HEPES buffer (Gibco).<br />
DMEM+<br />
DMEM (Gibco) with 2% Fetal Calf Serum <strong>and</strong> 10mM HEPES buffer (Gibco).<br />
Propidium Iodide<br />
We obtain from Sigma. Our frozen stock is at 10 mg/ml in water. Our working stock<br />
(covered with aluminum foil <strong>and</strong> kept in the fridge) is at 200 micrograms/ml in PBS.<br />
Final concentration of PI in your sample should be 2 micrograms/ml.<br />
HO protocol 2 Goodell, M.A. 8/99
Other Species<br />
The optimal <strong>Hoechst</strong>-staining protocols are similar for multiple species. We<br />
found 90 minutes to be optimal for mouse SP cells, whereas 120 minutes is optimal for<br />
human, rhesus, <strong>and</strong> swine cells. Follow the protocol exactly as described above, but<br />
stain the bone marrow for 120 minutes.<br />
Storage of <strong>Cell</strong>s<br />
If bone marrow preparation <strong>and</strong> sorting cannot be performed the same day, we<br />
recommend that the BM be kept in the refrigerator overnight prior to <strong>Hoechst</strong> staining.<br />
In our experience, cell viability is best when unficolled bone marrow is kept at 4 o C.<br />
[Note that mouse marrow does not need to be ficolled] In the morning, ficolled or unficolled<br />
bone marrow may be warmed to 37 o C, resuspended at 10 6 cells/ml, <strong>and</strong> stained<br />
with <strong>Hoechst</strong> as described above. We do not recommend plating the bone marrow on<br />
tissue culture plastic <strong>and</strong> leaving in the incubator overnight.<br />
Flow Cytometry<br />
Set Up<br />
We have now used this set-up on multiple cytometers from both BD (Facstar-plus <strong>and</strong><br />
Vantage) <strong>and</strong> Cytomation (MoFlow). You need an ultraviolet laser to excite the<br />
<strong>Hoechst</strong> dye <strong>and</strong> propidium iodide. A second laser can be used to excite additional<br />
fluorochromes (eg. FITC <strong>and</strong> phycoerythrin with a 488 laser).<br />
The <strong>Hoechst</strong> dye is excited with the UV laser at 350 nm <strong>and</strong> its fluorescence is<br />
measured with a 450/20 BP filter (<strong>Hoechst</strong> Blue) <strong>and</strong> a 675 EFLP optical filter (<strong>Hoechst</strong><br />
Red) (Omega Optical, Brattleboro VT). A 610 DMSP is used to separate the emission<br />
wavelengths. Propidium iodide (PI) fluorescence is also measured through the 675<br />
EFLP (having been excited at 350 nm). Note that PI is much BRIGHTER than the<br />
<strong>Hoechst</strong> red signal. <strong>Hoechst</strong> blue is the st<strong>and</strong>ard analysis wavelength for <strong>Hoechst</strong><br />
<strong>33342</strong> DNA content analysis. We have tried other filter sets/combinations. While<br />
others work sufficiently, we have found these to give the best results.<br />
Running<br />
<strong>Hoechst</strong>-stained cells are placed on the flow cytometer <strong>and</strong> preferably kept cold by the<br />
use of a chilling apparatus. It is not necessary to establish live gates on forward vs. side<br />
scatter parameters. First, the <strong>Hoechst</strong> BLUE vs. RED profile is displayed, with BLUE<br />
(450 BP filter) on the vertical axis <strong>and</strong> RED (675 LP) on the horizontal axis. With the<br />
detectors in LINEAR mode, the voltages are adjusted so that the red blood cells are seen<br />
in the lower left corner <strong>and</strong> the dead cells line up on a vertical line to the far right (very<br />
bright for the PI wavelength, thus dead cells: SEE FIGURE 1). The bulk of the rest of<br />
the cells can be centered. It should be possible to identify a major G0-G1 population<br />
with S-G2M cells going off to the upper right corner.<br />
HO protocol 3 Goodell, M.A. 8/99
Once you can see a profile similar to that shown in Figure 1, draw a live gate to exclude<br />
the red <strong>and</strong> dead cells. Then, collect a large file within this window. In order to<br />
identify the SP region definitively, 50,000-100,000 events MUST be collected within<br />
this live gate. The SP region should appear as shown in the figure. The prevalence is<br />
LOW: it is around 0.05% of whole bone marrow in the mouse. In human samples, the<br />
prevalence is lower (0.03% of ficolled marrow).<br />
Confirmation<br />
In order to confirm that you have identified the right cells, you can 1) block the<br />
population with verapamil, or 2) co-stain with antibodies. Verapamil is used at 50µM<br />
(buy it from Sigma, <strong>and</strong> make a 100x stock in 95% ethanol), <strong>and</strong> is included during the<br />
entire <strong>Hoechst</strong> staining procedure. To confirm the mouse SP population, good<br />
antibodies to co-stain with are Sca-1 <strong>and</strong> Gr-1 or another lineage antigen. Figure 2<br />
shows whole C57Bl/6 bone marrow <strong>and</strong> SP cells stained with Gr-1 <strong>and</strong> Sca-1.<br />
For human SP cells, you can also block with verapamil. For antibody staining,<br />
you can use CD34 <strong>and</strong> some other marker. The most consistent feature of human SP<br />
cells is their lack of CD34 expression. They express low but variable level of CD38.<br />
Other tips for optimal resolution of the multiple <strong>Hoechst</strong> populations<br />
Since analysis of the <strong>Hoechst</strong> dye is performed in linear mode, we have found<br />
that good C.V.s are critical. We perform alignments in linear mode with particles<br />
which have a very tight distribution (e.g. DNA Check beads from Coulter).<br />
Furthermore, we have used the UV laser in the "first" position for optimal C.V.s (this<br />
has the added benefit of allowing thresholding on DNA (<strong>Hoechst</strong> blue) <strong>and</strong> thus red<br />
blood cells are irrelevant). However, this is not necessary.<br />
In keeping with having good C.V.s, the sample differential pressure must be as<br />
low as possible. Preferably, the maximum sample differential pressure is calibrated<br />
with your alignment particle. In other words if your C.V. for your alignment particle is<br />
3% with a low differential pressure then determine the maximum differential pressure<br />
that will still give you good % C.V. s <strong>and</strong> do not ever exceed that pressure.<br />
Finally, a relatively high power on the UV laser gives the best CVs. We find 50-<br />
100 mW to give the best <strong>Hoechst</strong> signal. Less power will suffice, but the populations<br />
may not be as clearly resolved.<br />
Other comments about <strong>Hoechst</strong> Fluorescence<br />
Many people have asked us why we even see <strong>Hoechst</strong> fluorescence in the far red (>675<br />
nm). This is indeed surprising. None of the great flow cytometry textbooks document<br />
<strong>Hoechst</strong> fluorescence out this far. We do NOT think that this represents a separate<br />
emission peak for <strong>Hoechst</strong> fluorescence, but rather the fact that <strong>Hoechst</strong> stains cells<br />
VERY brightly, <strong>and</strong> we still manage to detect significant signal this far because the<br />
overall quantity of signal is so great. However, although you can easily detect a signal,<br />
HO protocol 4 Goodell, M.A. 8/99
it is not very bright in the red wavelengths, relative to the blue. The voltage on our red<br />
PMT is usually cranked fairly high.<br />
Note that the red signal is NOT propidium iodide. PI positive cells are even brighter<br />
than these <strong>Hoechst</strong>-red cells <strong>and</strong> can be seen lining up at the far right of the profile (see<br />
Figure 1). Of course, if you also have a 488 laser running, you will also see these PI<br />
positive cells in the PE <strong>and</strong> PI channels until you gate them out on the basis of the<br />
<strong>Hoechst</strong> profile.<br />
Given that we DO see red <strong>Hoechst</strong> fluorescence, what is going on? And why are so<br />
many populations resolved? <strong>Hoechst</strong> is doing several things at once:<br />
1) It IS a DNA binding dye, <strong>and</strong> can be used for DNA cell cycle analysis. Some of the<br />
cells that reach into the upper right of your plot are in S-G2M. And if you had a<br />
homogeneous population of cells, you should get a simple cell cycle profile if you<br />
look at <strong>Hoechst</strong> fluorescence at only one wavelength (usually the blue).<br />
2) <strong>Hoechst</strong> is pumped out by hematopoietic stem cells. That is why we see the LOW<br />
<strong>Hoechst</strong> fluorescence in the SP population<br />
3) <strong>Hoechst</strong> also has some property that we don’t underst<strong>and</strong>, that we think of as a<br />
chromatin effect. If you do a literature search, you can find out more about how<br />
<strong>Hoechst</strong> binds AT base pairs <strong>and</strong> think about how the binding <strong>and</strong> emission spectra<br />
might be affected by chromatin conformation<br />
The best paper we have found that explores this dual wavelength phenomenon in any<br />
detail is:<br />
Watson, J. V.; Nakeff, A.; Chambers, S. H.; Smith, P. J. (1985) Flow cytometric<br />
fluorescence emission spectrum analysis of <strong>Hoechst</strong>-<strong>33342</strong>-stained DNA in chicken<br />
thymocytes. Cytometry 6 310-5.<br />
GOOD LUCK!<br />
HO protocol 5 Goodell, M.A. 8/99
NO PI<br />
NO GATE<br />
+ PI<br />
+ PI<br />
S-G2M<br />
SP<br />
NO GATE<br />
G0-G1<br />
RED BLOOD<br />
CELLS<br />
<strong>and</strong> DEBRIS<br />
GATED<br />
SP<br />
Figure 1<br />
UV 405/30<br />
UV 405/30<br />
4000<br />
3000<br />
UV 405/30<br />
2000<br />
1000<br />
0<br />
0 1000 2000<br />
UV 670/40<br />
3000 4000<br />
4000<br />
3000<br />
2000<br />
1000<br />
4000<br />
3000<br />
2000<br />
100,000 events collected<br />
in the live gate shown:<br />
allows the SP to be 1000<br />
better defined <strong>and</strong><br />
cleans up the FSC/SSC<br />
view<br />
MOUSE BONE MARROW<br />
0<br />
0 1000 2000<br />
UV 670/40<br />
3000 4000<br />
PI POSITIVES: DEAD CELLS<br />
0<br />
0 1000 2000<br />
UV 670/40<br />
3000 4000<br />
0 1000 2000 3000 4000<br />
forward scatter<br />
HO protocol 6 Goodell, M.A. 8/99<br />
side scatter<br />
side scatter<br />
4000<br />
3000<br />
side scatter<br />
2000<br />
1000<br />
0<br />
4000<br />
3000<br />
2000<br />
1000<br />
4000<br />
3000<br />
2000<br />
1000<br />
0<br />
0 1000 2000<br />
forward scatter<br />
3000 4000<br />
0<br />
0 1000 2000 3000<br />
forward scatter<br />
4000
Whole BM NO STAIN (Gated from Fig 1) Whole BM: Sca-PE+ Gr1-FITC (Gated from Fig 1))<br />
<br />
UV 405/30<br />
10000<br />
1000<br />
100<br />
10<br />
4000<br />
3000<br />
2000<br />
1000<br />
0.94 0.091<br />
1<br />
97.5 1.49<br />
1 10 100<br />
<br />
1000 10000<br />
0.03<br />
0<br />
0 1000 2000<br />
UV 670/40<br />
3000 4000<br />
Figure 2<br />
Mouse Bone Marrow (C57Bl/6)<br />
1<br />
43.5 3.72<br />
1 10 100<br />
<br />
1000 10000<br />
HO protocol 7 Goodell, M.A. 8/99<br />
<br />
<br />
10000<br />
1000<br />
100<br />
10<br />
10000<br />
1000<br />
Gr1-FITC<br />
100<br />
10<br />
52.1 0.62<br />
Sca-1-PE<br />
Whole BM SP <strong>Cell</strong>s<br />
Gr1-FITC<br />
0.52 1.03<br />
1<br />
17 81.4<br />
1 10 100<br />
<br />
1000 10000<br />
SCA-1-PE