Presentation
Presentation
Presentation

Create successful ePaper yourself
Turn your PDF publications into a flip-book with our unique Google optimized e-Paper software.
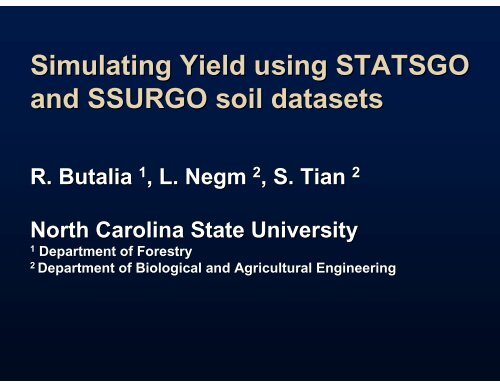
Simulating Yield using STATSGO<br />
and SSURGO soil datasets<br />
R. Butalia 1 , L. Negm 2 , S. Tian 2<br />
North Carolina State University<br />
1<br />
Department of Forestry<br />
2<br />
Department of Biological and Agricultural Engineering
Outline<br />
1. Introduction and Objectives<br />
2. Soil Datasets – STATSGO and SSURGO<br />
3. Methods<br />
• Model Selection and Application<br />
• Subbasin Selection<br />
• Validation<br />
4. Results<br />
5. Summary and Conclusion
Introduction<br />
Study Area<br />
• Robeson Creek<br />
Watershed<br />
• Piedmont, Carolina<br />
Slate Belt<br />
• Impaired<br />
waterbody, active<br />
TMDL for P<br />
• Section 319 funded<br />
• 7 Sampling points<br />
• Mixed land use
Introduction<br />
SWAT<br />
• SWAT is a hydrologic modeling tool developed<br />
at Texas A&M University.<br />
• Capable of predicting the effect of different land<br />
uses on water yield and quality in large complex<br />
watersheds.
Objectives<br />
• Determine the influence of soil input dataset<br />
spatial resolution on model behaviour<br />
• Determine the variation in this influence for two<br />
basins – smaller basin nested in larger<br />
STATSGO<br />
SSUGRO<br />
WS A<br />
WYLD AST<br />
WYLD ASR<br />
WS B<br />
WYLD BST<br />
WYLD BSR<br />
WS A -Entire Basin WS B – Subbasin 6
Soil Datasets<br />
• STATSGO – lower spatial resolution<br />
• SSURGO – more detailed geography and more<br />
recent data (survey conducted 1990s).<br />
• VBA code created for pre-processing SSURGO 2.2.1<br />
• Only one soil type per polygon was used in<br />
SWAT
Methods<br />
Model Selection and Application<br />
• SWAT<br />
• Commonly used, tested at various spatial scales<br />
• Allows use of spatial data, Arc SWAT<br />
• Simulation experiment<br />
• Two different soil datasets<br />
• Two different watershed sizes<br />
• Uncalibrated simulations
Methods<br />
Model Selection and Application<br />
Soil Water Balance (Arnold et al 1999)<br />
R – Rainfall<br />
Q - Runoff<br />
ET – Evapotranspiration<br />
P - Percolation<br />
QR – Return Flow<br />
Calculated for each HRU for each time step, typically daily
Methods<br />
Name<br />
Source<br />
Date<br />
STATSGO<br />
Simulation<br />
SSURGO<br />
Simulation<br />
Spatial Resolution/<br />
Map Scale<br />
Flow<br />
NCSU<br />
WQ<br />
2002 -<br />
2006<br />
Elevation<br />
NCDOT<br />
8/15/07<br />
X<br />
X<br />
20 foot cell,<br />
rounded down to<br />
nearest foot<br />
Land Use /<br />
Land Cover<br />
MRLC<br />
8/15/07<br />
X<br />
X<br />
30 meter cell,<br />
minimum 1 acre<br />
Unit<br />
Soil<br />
STATSGO<br />
SWAT<br />
(modified)<br />
8/15/07<br />
X<br />
1: 250, 000<br />
Soil SSURGO<br />
NRCS<br />
3/20/07<br />
X<br />
1: 24,000
Methods<br />
• Subbasins delineated using sampling<br />
locations as outlets<br />
• Subbasins characteristics from reports<br />
created by SWAT<br />
• Attempt to normalize for Land Use
Soil Datasets<br />
STATSGO<br />
Watershed Outlet<br />
Subbasin 6 Outlet
Soil Datasets<br />
SSURGO<br />
Watershed Outlet<br />
Subbasin 6 Outlet
Sample Profiles<br />
Cid<br />
Badin<br />
Georgeville<br />
• Clay and Silty Clay Loams<br />
• Variation in depth of profile<br />
• Most commonly low permeability<br />
STATSGO - 62 in.<br />
SSURGO – bottom of C 80 in.
Methods<br />
Subbasin Selection: Yield ratio (measured flows)<br />
ratio<br />
Ratio<br />
5<br />
4.5<br />
4<br />
3.5<br />
3<br />
2.5<br />
2<br />
1.5<br />
1<br />
0.5<br />
0<br />
sub_1 Sub1<br />
sub_2 Sub2<br />
sun_3<br />
Sub3<br />
sub_4 sub_6 sub_7<br />
Sub4<br />
Sub6<br />
Sub7<br />
May-02 Dec-02 Jun-03 Jan-04 Aug-04 Feb-05 Sep-05 Mar-06<br />
Date<br />
time
Methods<br />
Subbasin characteristics<br />
(value in %) WATERSHED SUBBASIN 6<br />
NC061 2.8 0<br />
Soil Type NC064 22.2 23.8<br />
NC068 75 76.2<br />
0 - 2 53.6 52.7<br />
2 - 6 44 45.4<br />
Land Slope 6 - 10 2 1.6<br />
10 - 15 0.15 0.14<br />
> 15 0.02 0.04<br />
URBN 9.3 5.9<br />
WATR 0.39 0.62<br />
SWRN 0.15 0.1<br />
Land Use FRST 69 64.8<br />
RAG 9.6 11.95<br />
HAY 11.4 15.1
Methods<br />
Validation<br />
Compared simulated flow to measured data<br />
I. Nash Sutcliffe (E)<br />
II. Pearson Product Momentum Coefficient (r)
Results<br />
Monthly Flow Entire Watershed<br />
water Yield Flow (1000 yield (1000 m 3 ) /m)<br />
m3/M)<br />
9000<br />
8000<br />
7000<br />
6000<br />
5000<br />
4000<br />
3000<br />
2000<br />
1000<br />
0<br />
Results from SSURGO data<br />
Results from STATSGO data<br />
Measured results<br />
Sep-02 Mar-03 Oct-03 Apr-04 Nov-04 May-05 Dec-05 Jul-06<br />
Date<br />
time
Results Monthly Flow Subbasin 6<br />
water yield (1000 m3/M)<br />
Flow (1000 m 3 )<br />
1000<br />
900<br />
800<br />
700<br />
600<br />
500<br />
400<br />
300<br />
200<br />
100<br />
0<br />
Sep-02 Mar-03 Oct-03 Apr-04 Nov-04 May-05 Dec-05<br />
time<br />
Date<br />
Results from SSURGO data<br />
Results from STATSGO data<br />
Measured results
Results<br />
STATSGO<br />
SSUGRO<br />
E r E r<br />
Watershed -0.75 -0.1 -1 -0.24<br />
Sub basin 6 0.09 -0.07 -1.45 -0.16<br />
Not Indicative of accurate modelling
S&R1<br />
Results<br />
Ratio = Q 6<br />
/ Q ww<br />
3<br />
SSURGO ratio STATSGO ratio Measured ratio<br />
2.5<br />
2<br />
Ratio<br />
1.5<br />
1<br />
0.5<br />
0<br />
0 5 10 15 20 25 30 35 40<br />
Time
Slide 21<br />
S&R1<br />
this should have been measured ratio and then shown statsgo and ssurgo<br />
Sharon & Raj, 2/20/2008
Results<br />
• In our case SSURGO yields were lower<br />
than STATSGO. Others also running<br />
uncalibrated models (Peschel et al,<br />
2006) have found different results
Results<br />
Entire Watershed<br />
Differences between simulations using SSURGO and<br />
STATSGO data for key hydrologic processes: A<br />
400<br />
350<br />
Percolation Soil Water Water Yield (q)<br />
300<br />
250<br />
Difference (mm<br />
200<br />
150<br />
100<br />
50<br />
Initial Conditions<br />
0<br />
-50<br />
-100<br />
0 5 10 15 20 25 30 35 40 45<br />
Time Indicator
Results<br />
Entire Watershed<br />
Differences between simulations using SSURGO and<br />
STATSGO data for key hydrologic processes: B<br />
30<br />
Surface Runoff Groundwater Flow ET Water Yield (q)<br />
20<br />
10<br />
Difference (mm)<br />
0<br />
-10<br />
-20<br />
-30<br />
-40<br />
0 5 10 15 20 25 30 35 40 45<br />
Time Indicator
Results<br />
T-test Analysis Comparing Yield (mm) Results<br />
from STATSGO and SSURGO<br />
Values in cells are<br />
t (P)<br />
STATSGO<br />
WW<br />
SSURGO<br />
SB6<br />
STATSGO<br />
SB6<br />
-0.79 (0.433)<br />
-0.17<br />
(0.8687)<br />
SSURGO<br />
WW<br />
-2.97<br />
(0.0054)<br />
3.67 (0.0008)
Conclusions<br />
• Results using SSURGO data showed<br />
differences between the entire watershed and<br />
the nested subasin.<br />
• Need to perform further sensitivity analysis<br />
and compare calibrated results<br />
Future Steps<br />
• Calibration and sensitivity analysis may lead<br />
to different conclusions<br />
• Factor in saprolite and restrictive layers
Acknowledgements<br />
NCSU Water Quality Group<br />
Dan Line<br />
Karen Hall<br />
Hugh Devine, CNR, NCSU<br />
Hoffman Fund, NCSU