Neighborhood Environment Walkability Scale ... - ResearchGate
Neighborhood Environment Walkability Scale ... - ResearchGate
Neighborhood Environment Walkability Scale ... - ResearchGate

Create successful ePaper yourself
Turn your PDF publications into a flip-book with our unique Google optimized e-Paper software.
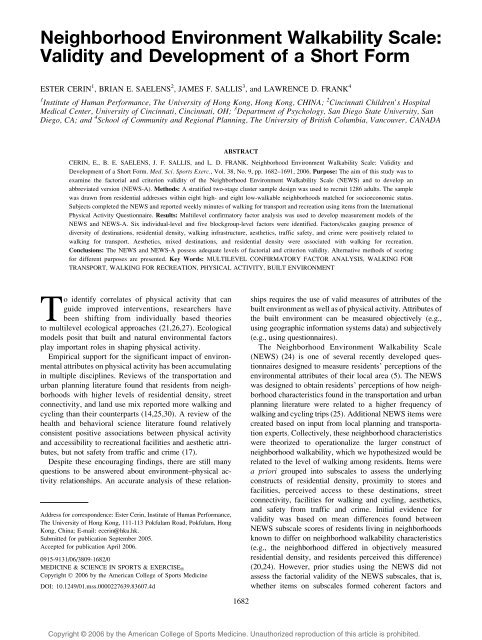
<strong>Neighborhood</strong> <strong>Environment</strong> <strong>Walkability</strong> <strong>Scale</strong>:<br />
Validity and Development of a Short Form<br />
ESTER CERIN 1 , BRIAN E. SAELENS 2 , JAMES F. SALLIS 3 , and LAWRENCE D. FRANK 4<br />
1 Institute of Human Performance, The University of Hong Kong, Hong Kong, CHINA; 2 Cincinnati Children’s Hospital<br />
Medical Center, University of Cincinnati, Cincinnati, OH; 3 Department of Psychology, San Diego State University, San<br />
Diego, CA; and 4 School of Community and Regional Planning, The University of British Columbia, Vancouver, CANADA<br />
ABSTRACT<br />
CERIN, E., B. E. SAELENS, J. F. SALLIS, and L. D. FRANK. <strong>Neighborhood</strong> <strong>Environment</strong> <strong>Walkability</strong> <strong>Scale</strong>: Validity and<br />
Development of a Short Form. Med. Sci. Sports Exerc., Vol. 38, No. 9, pp. 1682–1691, 2006. Purpose: The aim of this study was to<br />
examine the factorial and criterion validity of the <strong>Neighborhood</strong> <strong>Environment</strong> <strong>Walkability</strong> <strong>Scale</strong> (NEWS) and to develop an<br />
abbreviated version (NEWS-A). Methods: A stratified two-stage cluster sample design was used to recruit 1286 adults. The sample<br />
was drawn from residential addresses within eight high- and eight low-walkable neighborhoods matched for socioeconomic status.<br />
Subjects completed the NEWS and reported weekly minutes of walking for transport and recreation using items from the International<br />
Physical Activity Questionnaire. Results: Multilevel confirmatory factor analysis was used to develop measurement models of the<br />
NEWS and NEWS-A. Six individual-level and five blockgroup-level factors were identified. Factors/scales gauging presence of<br />
diversity of destinations, residential density, walking infrastructure, aesthetics, traffic safety, and crime were positively related to<br />
walking for transport. Aesthetics, mixed destinations, and residential density were associated with walking for recreation.<br />
Conclusions: The NEWS and NEWS-A possess adequate levels of factorial and criterion validity. Alternative methods of scoring<br />
for different purposes are presented. Key Words: MULTILEVEL CONFIRMATORY FACTOR ANALYSIS, WALKING FOR<br />
TRANSPORT, WALKING FOR RECREATION, PHYSICAL ACTIVITY, BUILT ENVIRONMENT<br />
Address for correspondence: Ester Cerin, Institute of Human Performance,<br />
The University of Hong Kong, 111-113 Pokfulam Road, Pokfulam, Hong<br />
Kong, China; E-mail: ecerin@hku.hk.<br />
Submitted for publication September 2005.<br />
Accepted for publication April 2006.<br />
0915-9131/06/3809-1682/0<br />
MEDICINE & SCIENCE IN SPORTS & EXERCISE Ò<br />
Copyright Ó 2006 by the American College of Sports Medicine<br />
DOI: 10.1249/01.mss.0000227639.83607.4d<br />
To identify correlates of physical activity that can<br />
guide improved interventions, researchers have<br />
been shifting from individually based theories<br />
to multilevel ecological approaches (21,26,27). Ecological<br />
models posit that built and natural environmental factors<br />
play important roles in shaping physical activity.<br />
Empirical support for the significant impact of environmental<br />
attributes on physical activity has been accumulating<br />
in multiple disciplines. Reviews of the transportation and<br />
urban planning literature found that residents from neighborhoods<br />
with higher levels of residential density, street<br />
connectivity, and land use mix reported more walking and<br />
cycling than their counterparts (14,25,30). A review of the<br />
health and behavioral science literature found relatively<br />
consistent positive associations between physical activity<br />
and accessibility to recreational facilities and aesthetic attributes,<br />
but not safety from traffic and crime (17).<br />
Despite these encouraging findings, there are still many<br />
questions to be answered about environment–physical activity<br />
relationships. An accurate analysis of these relationships<br />
requires the use of valid measures of attributes of the<br />
built environment as well as of physical activity. Attributes of<br />
the built environment can be measured objectively (e.g.,<br />
using geographic information systems data) and subjectively<br />
(e.g., using questionnaires).<br />
The <strong>Neighborhood</strong> <strong>Environment</strong> <strong>Walkability</strong> <strong>Scale</strong><br />
(NEWS) (24) is one of several recently developed questionnaires<br />
designed to measure residents’ perceptions of the<br />
environmental attributes of their local area (5). The NEWS<br />
was designed to obtain residents’ perceptions of how neighborhood<br />
characteristics found in the transportation and urban<br />
planning literature were related to a higher frequency of<br />
walking and cycling trips (25). Additional NEWS items were<br />
created based on input from local planning and transportation<br />
experts. Collectively, these neighborhood characteristics<br />
were theorized to operationalize the larger construct of<br />
neighborhood walkability, which we hypothesized would be<br />
related to the level of walking among residents. Items were<br />
a priori grouped into subscales to assess the underlying<br />
constructs of residential density, proximity to stores and<br />
facilities, perceived access to these destinations, street<br />
connectivity, facilities for walking and cycling, aesthetics,<br />
and safety from traffic and crime. Initial evidence for<br />
validity was based on mean differences found between<br />
NEWS subscale scores of residents living in neighborhoods<br />
known to differ on neighborhood walkability characteristics<br />
(e.g., the neighborhood differed in objectively measured<br />
residential density, and residents perceived this difference)<br />
(20,24). However, prior studies using the NEWS did not<br />
assess the factorial validity of the NEWS subscales, that is,<br />
whether items on subscales formed coherent factors and<br />
1682<br />
Copyright @ 2006 by the American College of Sports Medicine. Unauthorized reproduction of this article is prohibited.
whether individual factors derived from subscales were<br />
related to walking (5,20,24).<br />
Three studies have supported test–retest reliability of the<br />
NEWS (5,20,24), and other studies have provided partial<br />
support for its construct validity by reporting significant<br />
differences on some NEWS subscales between neighborhoods<br />
selected to differ on walkability (20,24) and modest<br />
correlations between NEWS subscales and accelerometer<br />
(1) and self-reported (9) estimates of physical activity.<br />
Several of these studies were limited in terms of neighborhood<br />
variability (e.g., only two neighborhoods were<br />
examined) and participant sample sizes. The a priori scales<br />
used may not be optimal, which could partly explain why<br />
only modest correlations were observed between the<br />
original a priori NEWS subscales and physical activity<br />
outcomes. Hence, the aim of this study was to provide a<br />
more comprehensive evaluation of the construct validity<br />
(factorial and criterion) of the NEWS. This was achieved<br />
by analyzing data collected on a large sample of residents<br />
from neighborhoods in an urban area of the United States<br />
with wide variability in neighborhood types. Finally, because<br />
the NEWS is a relatively long questionnaire (68 items)<br />
and response rates may be negatively affected by survey<br />
length (3), an additional purpose was to develop an abbreviated<br />
version of the NEWS (NEWS-A).<br />
METHODS<br />
$15,000 and greater than $150,000 were not included in the<br />
sampling frame to avoid extreme income values. The second,<br />
third, and fourth deciles constituted the low-income category,<br />
and the seventh, eighth, and ninth deciles made up the highincome<br />
category. Simple random sampling, without replacement,<br />
was used to select households from each neighborhood.<br />
Only one respondent per household was asked to participate.<br />
Individuals who were in group living establishments (e.g.,<br />
nursing homes, military barracks), unable to walk without<br />
assistance, or unable to take part in surveys in English were<br />
excluded. Subjects’ sociodemographic characteristics are<br />
shown in Table 1. Written informed consent was obtained<br />
from the subjects. This study was approved by the ethics<br />
committee of the local university.<br />
Measures<br />
<strong>Neighborhood</strong> environment walkability scale<br />
(NEWS). This 68-item instrument measured perceived<br />
attributes of the local environment hypothesized to be related<br />
to physical activity and, particularly, to walking for transport<br />
and walking for recreation. Concepts and subscales were<br />
based on variables believed to relate to walking and other<br />
physical activities that are discussed in the urban planning<br />
literature (11). The questionnaire assessed the following environmental<br />
characteristics: a) residential density; b) proximity<br />
to nonresidential land uses, such as restaurants<br />
and retail stores (land use mix–diversity); c) ease of access<br />
to nonresidential uses (land use mix–access); d) street<br />
Subjects<br />
A stratified two-stage cluster sample design was used to<br />
recruit 1286 adults aged 20–65, all of whom were residents<br />
of private dwellings in King County, WA. The study sample<br />
was drawn from residential addresses within 16 selected<br />
neighborhoods (103 census blockgroups) and classified,<br />
based on their walkability characteristics and median<br />
household income, into four strata: high walkable/high<br />
socioeconomic status (SES); low walkable/high SES; high<br />
walkable/low SES; and low walkable/low SES. <strong>Neighborhood</strong><br />
was defined as a cluster of adjacent blockgroups.<br />
<strong>Neighborhood</strong> walkability was determined using geographic<br />
information systems (GIS) data on four neighborhood<br />
attributes: residential density (number of residential units<br />
per acre), street connectivity (number of intersections per<br />
square kilometer), land use mix (evenness of distribution of<br />
building floor area of residential, retail, entertainment,<br />
office, and institutional development), and retail floor area<br />
ratio (ratio of retail building floor area to land area), with<br />
higher values of these characteristics indicating more<br />
walkable neighborhoods (12,13).<br />
Census blockgroups within the county were ranked and<br />
divided into deciles based on a walkability index. The top<br />
four and bottom four deciles represented high-walkability<br />
and low-walkability areas. Census blockgroups in the county<br />
were also deciled by median household income, using U.S.<br />
Census data, and categorized into high income and low<br />
income. Areas with median household incomes less than<br />
TABLE 1. Sociodemographic characteristics of the sample (N = 1286).<br />
Characteristic<br />
Estimate<br />
Gender (%)<br />
Male 54.7<br />
Missing values 0.2<br />
Ethnicity (%)<br />
Caucasian 82.3<br />
African American 3.3<br />
Asian American 6.5<br />
Pacific Islander 1.4<br />
Native American 1.2<br />
Other 4.7<br />
Missing values 0.5<br />
Marital status (%)<br />
Married 57.0<br />
Widowed/divorced/separated 15.9<br />
Single and never married 20.8<br />
Living with partner 6.1<br />
Missing values 0.2<br />
Age (yr)<br />
Mean (SD) 44.0 (11.0)<br />
Missing values (%) 0.2<br />
Educational attainment (%)<br />
Primary or less 1.3<br />
Secondary 35.4<br />
Tertiary 60.1<br />
Missing values 0.2<br />
Annual household income (%)<br />
G $19,500 23.8<br />
$19,500–$39,500 50.2<br />
$39,500–$59,500 22.2<br />
9 $59,500 3.5<br />
Missing values 0.2<br />
Children in household (%)<br />
Yes 38.5<br />
Missing values 0.2<br />
NEWS AND NEWS-A VALIDITY Medicine & Science in Sports & Exercise d<br />
1683<br />
Copyright @ 2006 by the American College of Sports Medicine. Unauthorized reproduction of this article is prohibited.
connectivity; e) walking/cycling facilities, such as sidewalks<br />
and pedestrian/bike trails; f) aesthetics; g) pedestrian traffic<br />
safety; and h) crime safety. With the exception of the<br />
residential density and land use mix–diversity subscales,<br />
items were rated on a 4-point Likert scale from 1 (strongly<br />
disagree) to 4 (strongly agree). Residential density items<br />
asked about the frequency of various types of residences,<br />
from single-family detached homes to 13-story or higher<br />
apartments/condominiums, with a response range of 1<br />
(none) to 5 (all). Residential density items were weighted<br />
relative to the average density of single-family detached<br />
residences (e.g., 7- to 12-story apartments and condominiums<br />
were considered to be 50 times more person-dense<br />
than single-family residences), and weighted values were<br />
summed to create a residential density subscale score. Land<br />
use mix–diversity was assessed by the walking proximity<br />
from home to various types of stores and facilities, with<br />
responses ranging from 1- to 5-min walking distance (coded<br />
as 5) to 9 30-min walking distance (coded as 1). Higher<br />
scores on land use mix–diversity indicated closer average<br />
proximity. The NEWS and its abbreviated version are<br />
available at www.drjamessallis.sdsu.edu.<br />
Self-reported walking for transport and recreation.<br />
Because the variables assessed in the NEWS are hypothesized<br />
to be differentially associated with walking for different<br />
purposes, self-reported walking was used as the validity<br />
criterion. Weekly minutes of walking for transport and<br />
walking for recreation were assessed using the long version<br />
of the International Physical Activity Questionnaire (IPAQ).<br />
Subjects were instructed to report the frequency and duration<br />
of walking for transport and recreation during the past 7 d.<br />
Weekly minutes of walking for transport and walking for<br />
recreation were computed, and outlier values were truncated to<br />
the 99th percentile. A recent report on data collected in<br />
12 countries showed that the IPAQ had comparable reliability<br />
and validity to other self-report measures of physical activity<br />
(7). There is evidence for an acceptable degree of reliability<br />
and validity of the transportation and leisure-time physical<br />
activity items of the IPAQ, which include the walking items<br />
used in this study. For these items, intraclass correlations<br />
ranging from 0.60 and 0.82 have been reported (32). Also,<br />
moderate correlations (0.50–0.63) were found between diary<br />
measures of transport-related and leisure-time physical<br />
activity and the corresponding IPAQ items (32). In the<br />
present study, the blockgroup-level correlation between selfreported<br />
total weekly minutes of walking, and accelerometryestimated<br />
weekly minutes of moderate-intensity activity was<br />
0.54, whereas that at the individual-level was 0.19, indicating<br />
moderate criterion validity.<br />
Sociodemographic characteristics. Subjects were<br />
asked to provide information on their age, sex, educational<br />
attainment, marital status, ethnicity, annual household income,<br />
and number of children (G 18 yr old) in the household.<br />
Procedure<br />
Households within the selected blockgroups were identified<br />
by a marketing company and were sent an introductory<br />
1684 Official Journal of the American College of Sports Medicine<br />
letter. Households were called within 2 wk of the expected<br />
receipt of this letter, with an adult in the household queried<br />
about interest and study eligibility. One interested and<br />
eligible adult per household was sent the consent form and,<br />
upon its return, was sent questionnaires with instructions<br />
and a postage-paid return envelope. The recruitment rate<br />
(subjects/eligible people contacted) was 28%.<br />
Data Analytic Plan<br />
Phase I: Confirmatory factor analysis of the long<br />
version of the NEWS. Confirmatory factor analysis<br />
(CFA) was conducted on the items from six of the eight<br />
subscales of the NEWS. These were the subscales using the<br />
same 4-point rating scales: land use mix–access, street/<br />
connectivity, infrastructure for walking/cycling, aesthetics,<br />
traffic safety, and crime safety. Given their formats, it was<br />
not appropriate to factor analyze the subscales of residential<br />
density and land use mix–diversity. For the items included<br />
in the CFA, univariate normality of the individual deviations<br />
from the blockgroup mean scores and the disaggregated<br />
blockgroup mean scores was examined. To establish<br />
whether a multilevel rather than a single-level CFA of the<br />
NEWS was needed, intraclass correlation coefficients (ICC)<br />
were computed for each of the NEWS items. It is generally<br />
maintained that when ICC exceed values of 0.10 and group<br />
sizes exceed 15, the multilevel structure of the data should<br />
be modeled (22).<br />
Multilevel CFA of the six subscales of the NEWS was<br />
carried out using Bentler and Liang’s maximum likelihood<br />
estimation (MLE) method (2). This method uses an<br />
expectation maximization–type gradient algorithm for<br />
computing the MLE for two-level structural equation<br />
models, of which confirmatory factor analysis is a special<br />
case. This algorithm is applicable to any study with<br />
balanced or unbalanced design and is preferable to other<br />
methods when the sample sizes vary substantially among<br />
clusters (blockgroups).<br />
The construction of a two-level measurement model of the<br />
long version of the NEWS included two main steps. First, an<br />
a priori two-level measurement model with six oblique<br />
factors, as originally defined by its developers (24), was<br />
examined. For this model, the factor structures at the<br />
individual and blockgroup levels were defined to be equal.<br />
In the second step of the analyses, respecification of the<br />
original model was conducted according to Jöreskog and<br />
Sörbom’s iterative model-generating approach (18). This<br />
approach consists of testing the viability of initial hypothetical<br />
models in terms of whether they satisfactorily fit the<br />
observed data. If the results indicate a lack of fit based on<br />
empirical or substantive evidence, the models are respecified.<br />
The ultimate goal of model respecification is to<br />
identify models that can provide a statistically acceptable<br />
fit and a theoretically meaningful interpretation of the data.<br />
Model respecification was based on the analysis of<br />
standardized factor loadings, the analysis of three empirical<br />
indices of poor model fit (standardized residual covariances,<br />
univariate Lagrange multiplier tests, and Wald tests), and<br />
http://www.acsm-msse.org<br />
Copyright @ 2006 by the American College of Sports Medicine. Unauthorized reproduction of this article is prohibited.
substantive considerations (i.e., salience) (18). Factor loadings<br />
greater than |0.30| were considered to be significant (6).<br />
Several measures of absolute and incremental fit were used<br />
to evaluate the goodness-of-fit of the measurement models<br />
(4,19). Absolute-fit indices describe the ability of the model<br />
to reproduce the original covariance matrix. The absolute-fit<br />
indices reported in this paper are the W 2 test (specifically, the<br />
Bentler–Liang likelihood ratio statistic), the goodness-of-fit<br />
index (GFI), and the root mean square error of approximation<br />
(RMSEA) (4,19). Two incremental fit indices, assessing<br />
the degree to which a specified model is better than a<br />
baseline model that specifies no covariances, were used.<br />
These were the nonnormed fit index (NNFI) and the<br />
comparative fit index (CFI). In addition to the above indices<br />
of fit, the standardized root mean squared residual (SRMR)<br />
was computed. The SRMR is a standardized summary of the<br />
average covariance residuals (19). We also used the Aikake<br />
information criterion (AIC) of the standard goodness-of-fit<br />
W 2 statistics that includes a penalty for complexity. This<br />
index can be used for the comparison of nonnested<br />
measurement models (models that are not subsets of one<br />
another) (19). Hu and Bentler’s recommended cutoff values<br />
for specific fit indices were adopted (16). According to these<br />
authors, GFI, CFI, and NNFI with values exceeding 0.95 are<br />
generally indicative of a good model fit. A favorable value<br />
for the SRMR is less than 0.08; for RMSEA, a favorable<br />
value is less than 0.06. All CFA-related analyses were<br />
conducted using EQS 6.1 (Multivariate Software Inc., 2004).<br />
Phase II: Selection of items for the NEWS-A. To<br />
create an abbreviated version of the NEWS, pairs of items<br />
overlapping in content were identified, and those with the<br />
better psychometric properties were selected. The following<br />
psychometric properties were taken into account:<br />
1. Criterion validity: direction and magnitude of associations<br />
(correlations) between ratings on a specific<br />
item and reported weekly minutes of walking for<br />
transport and walking for recreation at the individual<br />
level (i.e., within blockgroups) and the blockgroup<br />
level (i.e., between blockgroups) after controlling for<br />
sociodemographic factors (age, gender, educational<br />
attainment, children in household, and annual household<br />
income). These correlations were computed as<br />
specified by Snijder and Bosker (29).<br />
2. Contribution of a specific item to the criterion validity<br />
of its factor in relation to walking for transport and<br />
walking for recreation. This was established by<br />
examining the change in shared variance (R 2 ) between<br />
a factor and measures of walking following the<br />
exclusion of the item (dR 2 =R 2 of factor without<br />
item j R 2 of factor with item).<br />
3. Magnitude of ICC (i.e., how much of the total item<br />
variance is due to differences between blockgroups).<br />
4. Test–retest reliability (intraclass correlation observed<br />
in an earlier study) (24).<br />
5. Magnitude of the standardized loading of a specific item<br />
on its corresponding underlying dimension (factor).<br />
Higher values of the above criteria were considered to be<br />
desirable. In an overlapping pair of items, the item with a<br />
greater tally of higher values was retained. Any other items<br />
with low criterion validity, either as a single item (see #1<br />
above) and as an element of a factor (see #2 above) or of<br />
potentially low theoretical salience, were excluded from the<br />
abbreviated scale (NEWS-A).<br />
Phase III: Confirmatory factor analysis of the<br />
NEWS-A. Confirmatory factor analysis of the NEWS-A<br />
was conducted using the same procedure outlined in phase I<br />
(CFA of the long version of the NEWS) by 1) testing the fit<br />
of a truncated measurement model with a structure equivalent<br />
to that identified for the long version of the NEWS and<br />
2) defining a respecified model providing a statistically<br />
acceptable fit and a theoretically meaningful interpretation<br />
of the data.<br />
Phase IV: Criterion validity of the NEWS and<br />
NEWS-A. Criterion validity of the multilevel CFA-derived<br />
factors of the NEWS and NEWS-A and the residential<br />
density and land use mix–diversity scales were determined<br />
by examining the individual- and blockgroup-level<br />
associations between scores on the identified factors/scales<br />
and walking for transport and recreation. Individual- and<br />
blockgroup-level correlations were estimated following the<br />
procedure specified by Snijder and Bosker (29). The<br />
associations between self-reported walking and the NEWS<br />
and NEWS-A factors/scales were estimated after controlling<br />
for sociodemographic confounders (partial correlations).<br />
Huber–White sandwich estimators of standard<br />
errors were used to compute the associations with the<br />
nonnormal variables of walking for transport and walking<br />
for recreation (33). The same analyses were carried out<br />
using normalized variables. Normalization involved<br />
assigning expected values from the standard normal distribution<br />
according to the ranks of the original values so<br />
that normal equivalent deviates were computed for (i-0.5)/n<br />
where i is the rank of the original values and n is the total<br />
number of values (23). In case of no substantial difference<br />
between the two sets of analyses, the results with the<br />
original outcome values were reported. These analyses<br />
TABLE 2. Results of the multilevel CFA of the NEWS and NEWS-A.<br />
Model W 2 df GFI RMSEA (90% CI) SRMR NNFI CFI AIC<br />
NEWS<br />
Model 1: A priori 5701.5 1374 0.92 0.050 (0.048–0.051) 0.074 0.81 0.82 2954<br />
Model 2: Respecified 3400.2 1135 0.98 0.040 (0.038–0.041) 0.063 0.92 0.92 1130<br />
NEWS-A<br />
Model 1a: NEWS based* 1052.9 442 1.00 0.033 (0.030–0.035) 0.052 0.97 0.97 169<br />
Model 2a: Respecified 1020.7 445 1.00 0.032 (0.029–0.034) 0.067 0.97 0.97 131<br />
* Based on the respecified measurement model of the NEWS (model 2).<br />
NEWS AND NEWS-A VALIDITY Medicine & Science in Sports & Exercise d<br />
1685<br />
Copyright @ 2006 by the American College of Sports Medicine. Unauthorized reproduction of this article is prohibited.
TABLE 3. Standardized factor loadings and uniquenesses for final respecified individual-level and neighborhood-level measurement models of the NEWS and NEWS-A<br />
(in parentheses).<br />
Individual Level<br />
Blockgroup Level<br />
Item #<br />
Item<br />
Standardized<br />
Loading<br />
Standardized<br />
Uniqueness<br />
Latent<br />
Factor<br />
Standardized<br />
Loading<br />
Standardized<br />
Uniqueness<br />
A1 I can do most of my shopping at local stores 0.68 (—) 0.54 (—) IL1 (—) 0.80 (—) 0.36 (—) BL1 (—)<br />
A2 Stores are within easy walking distance at my home 0.89 (0.76) 0.21 (0.43) IL1 (IL1 A ) 0.88 (0.80) 0.23 (0.36) BL1 (BL1 A )<br />
A3 Parking is difficult in local shopping areas Max std load = j0.11 on factor IL1 (j0.10 on factor IL1 A ) 0.50 (0.54) 0.75 (0.71) BL1 (BL1 A )<br />
A4 There are many places to go within walking distance at 0.74 (0.85) 0.46 (0.28) IL1 (IL1 A ) 0.86 (0.80) 0.26 (0.36) BL1 (BL1 A )<br />
my home<br />
A5 It is easy to walk to a transit stop (bus, train) from my home 0.45 (0.50) 0.80 (0.75) IL1 (IL1 A ) 0.80 (0.81) 0.36 (0.35) BL1 (BL1 A )<br />
A6 The streets in my neighborhood are hilly, making my Max std load = j0.17 on factor IL1 (j0.15 on 0.72 (0.78) 0.48 (0.40) BL2 (BL2 A )<br />
neighborhood difficult to walk in<br />
factor IL1 A )<br />
A7 There are many canyons/hillsides in my neighborhood that Max std load = 0.18 on factor IL1 (0.21 on factor IL1 A ) 0.79 (0.86) 0.37 (0.26) BL2 (BL2 A )<br />
limit the number of routes for getting from place to place<br />
B1 The streets in my neighborhood do not have many Max std load = 0.16 on factor IL2 (0.16 on factor IL2 A ) 0.78 (0.74) 0.40 (0.45) BL1 (BL1 A )<br />
cul-de-sacs<br />
B2 There are walkways in my neighborhood that connect Max std load = 0.15 on factor IL2 (—) Max std load = 0.17 on factor BL1 (—)<br />
cul-de-sacs to streets, trails, or other cul-de-sacs<br />
B3 The distance between intersections in my<br />
0.43 (0.37) 0.81 (0.86) IL2 (IL2 A ) 0.89 (0.89) 0.20 (0.20) BL1 (BL1 A )<br />
neighborhood is usually short<br />
B4 There are many four-way intersections in my<br />
0.46 (—) 0.79 (—) IL2 (—) 0.95 (—) 0.10 (—) BL1 (—)<br />
neighborhood.<br />
B5 There are many alternative routes for getting from place 0.61 (0.62) 0.63 (0.61) IL2 (IL2 A ) 0.98 (0.96) 0.04 (0.08) BL1 (BL1 A )<br />
to place in my neighborhood<br />
C1 There are sidewalks on most of the streets in my<br />
0.61 (0.49) 0.62 (0.76) IL3 (IL3 A ) 0.70 (0.74) 0.51 (0.45) BL1 (BL1 A )<br />
neighborhood<br />
C2 The sidewalks in my neighborhood are well maintained 0.63 (—) 0.61 (—) IL3 (—) j0.74 (—) 0.45 (—) BL2 (—)<br />
C3 There are bicycle or pedestrian trails in or near my 0.45 (—) 0.80 (—) IL3 (—) j0.50 (—) 0.75 (—) BL2 (—)<br />
neighborhood that are easy to get to<br />
C4 Sidewalks are separated from the road/traffic in my 0.38 (0.36) 0.85 (0.86) IL3 (IL3 A ) 0.97 (0.98) 0.06 (0.05) BL1 (BL1 A )<br />
neighborhood by parked cars<br />
C5 There is a grass/dirt strip that separates the streets from 0.30 (0.33) 0.90 (0.89) IL3 (IL3 A ) 0.81 (0.83) 0.35 (0.32) BL1 (BL1 A )<br />
the sidewalks in my neighborhood<br />
C6 It is safe to ride a bike in or near my neighborhood 0.61 (—) 0.62 (—) IL3 (—) j0.82 (—) 0.32 (—) BL2 (—)<br />
D1 There are trees along the streets in my neighborhood 0.32 (0.34) 0.90 (0.88) IL4 (IL4 A ) 0.89 (0.85) 0.21 (0.29) BL3 (BL3 A )<br />
D2 Trees give shade for the sidewalks in my neighborhood 0.34 (—) 0.88 (—) IL4 (—) 0.82 (—) 0.34 (—) BL3 (—)<br />
D3 There are many interesting things to look at while walking 0.69 (0.72) 0.53 (0.48) IL4 (IL4 A ) 0.94 (0.96) 0.12 (0.08) BL3 (BL3 A )<br />
in my neighborhood<br />
D4 My neighborhood is generally free from litter 0.49 (—) 0.76 (—) IL4 (—) 0.79 (—) 0.37 (—) BL3 (—)<br />
D5 There are many attractive natural sights in my<br />
0.76 (0.76) 0.43 (0.42) IL4 (IL4 A ) 0.95 (0.95) 0.10 (0.10) BL3 (BL3 A )<br />
neighborhood<br />
D6 There are attractive buildings/homes in my neighborhood 0.74 (0.72) 0.46 (0.48) IL4 (IL4 A ) 0.97 (0.96) 0.06 (0.07) BL3 (BL3 A )<br />
E1 There is so much traffic along the street I live on that it 0.72 (—) 0.48 (—) IL5 (—) 0.84 (—) 0.29 (—) BL4 (—)<br />
makes it difficult or unpleasant to walk in my<br />
neighborhood<br />
E2 There is so much traffic along nearby streets that it makes 0.70 (0.71) 0.51 (0.49) IL5 (IL5 A ) 0.96 (0.95) 0.08 (0.11) BL4 (BL4 A )<br />
it difficult or unpleasant to walk in my neighborhood<br />
E3 The speed of traffic on the street I live on is usually slow j0.61 (—) 0.63 (—) IL5 (—) j0.76 (—) 0.42 (—) BL4 (—)<br />
E4 The speed of traffic on most nearby streets is usually slow j0.59 (j0.64) 0.65 (0.59) IL5 (IL5 A ) j0.92 (j0.90) 0.15 (0.18) BL4 (BL4 A )<br />
E5 Most drivers exceed the posted limits while driving in my 0.46 (0.45) 0.79 (0.80) IL5 (IL5 A ) 0.93 (0.90) 0.13 (0.18) BL4 (BL4 A )<br />
neighborhood<br />
E6 My neighborhood is well lit at night 0.43 (0.50) 0.81 (0.75) IL3 (IL3 A ) j0.76 (j0.77) 0.42 (0.41) BL4 (BL4 A )<br />
E7 Walkers and bikers on the streets in my neighborhood can 0.39 (0.46) 0.85 (0.79) IL3 (IL3 A ) j0.83 (j0.83) 0.32 (0.31) BL4 (BL4 A )<br />
be easily seen by people in their homes<br />
E8 There are crosswalks and pedestrian signals to help walkers 0.35 (0.34) 0.88 (0.88) IL3 (IL3 A ) 0.89 (0.74) 0.20 (0.45) BL1 (BL1 A )<br />
cross busy streets in my neighborhood<br />
E9 The crosswalks in my neighborhood help walkers feel safe 0.43 (—) 0.81 (—) IL3 (—) 0.93 (—) 0.13 (—) BL1 (—)<br />
crossing busy streets<br />
E10 When walking in my neighborhood there are a lot of 0.50 (—) 0.75 (—) IL5 (—) 0.81 (—) 0.35 (—) BL5 (—)<br />
exhaust fumes<br />
F1 I see and speak to other people when I am walking in Max std load = j0.19 on factor IL6 (—) 0.58 (—) 0.67 (—) BL3 (—)<br />
my neighborhood<br />
F2 There is a high crime rate in my neighborhood 0.68 (0.67) 0.54 (0.55) IL6 (IL6 A ) 0.99 (0.98) 0.02 (0.04) BL5 (BL5 A )<br />
F3 The crime rate in my neighborhood makes it unsafe to go 0.55 (0.54) 0.70 (0.71) IL6 (IL6 A ) 0.92 (0.92) 0.17 (0.16) BL5 (BL5 A )<br />
on walks during the day<br />
F4 The crime rate in my neighborhood makes it unsafe to go 0.82 (0.83) 0.34 (0.31) IL6 (IL6 A ) 0.97 (0.97) 0.06 (0.05) BL5 (BL5 A )<br />
on walks at night<br />
F5 My neighborhood is safe enough so that I would let a 10-yr-old j0.39 (—) 0.85 (—) IL6 (—) 0.91 (—) 0.17 (—) BL3 (—)<br />
boy walk around my block alone in the daytime<br />
Max std load, maximal standardized loading; (—), not applicable.<br />
A priori factors: A, land use mix–access; B, street connectivity; C, infrastructure for walking/cycling; D, aesthetics; E, traffic safety; F, crime safety.<br />
Latent individual-level factors: IL1 and IL1 A , land use mix–access; IL2 and IL2 A , street connectivity; IL3, infrastructure and safety for walking/cycling; IL3 A , infrastructure and safety for<br />
walking; IL4 and IL4 A , aesthetics; IL5 and IL5 A , traffic hazards; IL6 and IL6 A , crime.<br />
Latent blockgroup-level factors: BL1 and BL1 A , land use mix–access and infrastructure for walking; BL2, physical obstacles to walking/cycling; BL2 A , physical obstacles to walking; BL3,<br />
aesthetics and friendliness; BL3 A , aesthetics; BL4 and BL4 A , traffic hazards; BL5 and BL5 A , crime.<br />
Autocorrelated within-factor error terms were modeled for the following items: D1 and D2 (r = 0.60; t = 19.5; P G 0.001), and E8 and E9 (r = 0.65; t = 20.4; P G 0.001).<br />
Latent<br />
Factor<br />
1686 Official Journal of the American College of Sports Medicine<br />
http://www.acsm-msse.org<br />
Copyright @ 2006 by the American College of Sports Medicine. Unauthorized reproduction of this article is prohibited.
TABLE 4. Correlations between individual-level latent factors of the NEWS (above the diagonal) and NEWS-A (below the diagonal).<br />
NEWS-A Factors (IL2) (IL3) (IL4) (IL5) (IL6) NEWS Factors<br />
Land use mix–access (IL1 A ) 0.33 0.23 0.20 G 0.10* G 0.10* Land use mix–access (IL1)<br />
Street connectivity (IL2 A ) 0.35 0.41 0.23 j0.21 G 0.10* Street connectivity (IL2)<br />
Infrastructure and safety for walking (IL3 A ) 0.28 0.54 0.48 j0.54 j0.35 Infrastructure and safety for walking/cycling (IL3)<br />
Aesthetics (IL4 A ) 0.23 0.30 0.44 j0.41 j0.38 Aesthetics (IL4)<br />
Traffic hazards (IL5 A ) G 0.10* j0.27 j0.49 j0.36 0.56 Traffic hazards (IL5)<br />
Crime (IL6 A ) G 0.10* G 0.10* j0.28 j0.30 0.48 Crime (IL6)<br />
(IL1 A ) (IL2 A ) (IL3 A ) (IL4 A ) (IL5 A )<br />
* Constrained to zero in the final model as correlation coefficients smaller than |0.10|. The subscript A stands for NEWS-A.<br />
were conducted using MLwiN version 2 (Multilevel Models<br />
Project, Institute of Education, 2004).<br />
The scores on the residential density and land use mix–<br />
diversity scales were calculated as explained by Saelens<br />
et al. (24). Participants’ scores on each of the individual-level<br />
CFA-derived factors were defined in two different ways:<br />
1a) as their average rating on the items loading on the<br />
specific factor, and 1b) as the deviation of their score from<br />
the mean score of their blockgroup for the specific factor<br />
(equation 1). Specifically, the score on an individual-level<br />
factor for the ith participant (Y ILF.i ) residing in the jth<br />
blockgroup was computed as<br />
the environment (see Discussion section for more details).<br />
The computation of scores on the individual-level factors as<br />
individual deviations from the blockgroup mean (as per 1b)<br />
and of scores on the blockgroup-level factors as the mean<br />
score for a specific blockgroup (as per 2b) is recommended<br />
when a researcher wishes to separately estimate interindividual<br />
differences in the perception of a same blockgroup<br />
(represented by 1b) and actual differences between blockgroups<br />
(represented by 2b). This approach facilitates the<br />
analysis of the independent effects of idiosyncratic perceptions<br />
of the environment and the actual environment on<br />
outcomes of interest (e.g., walking for transport).<br />
Y ILF :i ¼ ~½x i j:kjmeanðx j :kÞŠ=l<br />
½1Š<br />
where mean (x j.k ) is the average score on the kth item for<br />
the jth blockgroup, x ij.k is the ith resident’s (from blockgroup<br />
j) score on the kth item of a specific individual-level<br />
factor (ILF), and l is the total number of items loading on<br />
the specific ILF. Participants’ scores on the blockgrouplevel<br />
factors were defined as 2a) their average rating on the<br />
items loading on the specific factor, and 2b) the mean score<br />
of their blockgroup on the specific factor (equation 2). The<br />
score on a blockgroup-level factor (BLF) for the ith<br />
participant (Y BLF.i ) residing in the jth blockgroup was<br />
computed as<br />
Y BLF :i ¼ ~½meanðx j :kÞŠ=l<br />
representing the mean score on a blockgroup-level factor<br />
for the jth blockgroup (i.e., all residents from the same<br />
blockgroup are assigned the same score on a specific<br />
blockgroup-level factor).<br />
In practice, scores based on the individual-level factors<br />
operationalized as in 1a provide measures that best<br />
differentiate individual perceptions of the same environment.<br />
In contrast, scores based on the blockgroup-level<br />
factors operationalized as in 2a provide measures that best<br />
differentiate between perceptions of residents from different<br />
blockgroups and are to be used when the focus is more on<br />
the actual environment rather than individual perceptions of<br />
½2Š<br />
RESULTS<br />
Phase I: Confirmatory factor analysis of the long<br />
version of the NEWS. In the present study, the number of<br />
respondents per census blockgroup ranged from 1 to 46. The<br />
ICC of the NEWS items were small to moderate in size and<br />
ranged from 0.02 to 0.49. The mean ICC was 0.23 (SD =<br />
0.12). These results confirmed the need for a multilevel CFA<br />
of the NEWS using Bentler–Liang’s MLE method. Items’<br />
univariate skewness and kurtosis values were within<br />
acceptable limits for the use of maximum likelihood<br />
estimation (8).<br />
The a priori measurement model of the NEWS exhibited<br />
an unacceptable level of fit, with two indices (RMSEA and<br />
SRMR) meeting, and two indices being substantially lower<br />
than the adopted cutoff values (Table 2, part a). In contrast,<br />
the final two-level respecified model showed a relatively<br />
good fit to the data, with three fit indices meeting, and the<br />
remaining two approaching the adopted cutoff values.<br />
Inspection of the standardized factor loadings and modification<br />
indices of the a priori model suggested that, at the<br />
individual level, items A3, A6, A7, B1, B2, and F1 did not<br />
substantively load on any of the factors (Table 3).<br />
Items E6–E9 showed a stronger association with the<br />
infrastructure for walking/cycling than, as originally<br />
TABLE 5. Correlations between blockgroup-level latent factors of the NEWS (above the diagonal) and NEWS-A (below the diagonal).<br />
(BL2) (BL3) (BL4) (BL5) NEWS Factors<br />
Land use mix–access and infrastructure for walking<br />
(BL1 A )<br />
j0.41 0.38 j0.72 0.25 Land use mix–access and infrastructure for walking<br />
(BL1)<br />
Physical obstacles to walking (BL2 A ) j0.41 j0.13 0.43 0.20 Physical obstacles to walking/cycling (BL2)<br />
Aesthetics (BL3 A ) 0.62 G 0.10* j0.75 j0.70 Aesthetics and friendliness (BL3)<br />
Traffic hazards (BL4 A ) j0.62 0.26 j0.82 0.30 Traffic hazards (BL4)<br />
Crime (BL5 A ) G 0.10* G 0.10* j0.69 0.40 Crime (BL5)<br />
BL1 A BL2 A BL3 A BL4 A<br />
* Constrained to zero in the final model as correlation coefficients smaller than |0.10|. The subscript A stands for NEWS-A.<br />
NEWS AND NEWS-A VALIDITY Medicine & Science in Sports & Exercise d<br />
1687<br />
Copyright @ 2006 by the American College of Sports Medicine. Unauthorized reproduction of this article is prohibited.
TABLE 6. Partial correlations (r p ) between walking for transport, walking for recreation, and the factors/scales of the NEWS and NEWS-A (in parentheses).<br />
Method of Factor/<strong>Scale</strong>/Item Scoring<br />
Factor/<strong>Scale</strong> (Label)<br />
Block-Level Factors<br />
Disaggregated<br />
Blockgroup Mean Score<br />
on Factor (Equation #2)<br />
Walking for Transport r p<br />
Blockgroup Level<br />
Individual Deviations from<br />
Blockgroup Average Score<br />
on Factor (Equation #1)<br />
Walking for Transport r p<br />
Individual Level<br />
Individual Average Rating on Factor_s Items (Conventional<br />
Scoring)/Single Items and Predefined <strong>Scale</strong>s<br />
Walking for<br />
Transport r p<br />
Blockgroup Level<br />
Walking for<br />
Transport r p<br />
Individual Level<br />
Walking for<br />
Recreation r p<br />
Individual Level<br />
Land use mix–access and infrastructure for<br />
walking (BL1 (A) )<br />
0.72‡ (0.73‡) — 0.70‡ (0.71‡) 0.05 (0.06*) 0.00 (0.03)<br />
Physical obstacles to walking/cycling (BL2 (A) ) j0.12 (j0.06 ) — j0.12 (j0.11 ) 0.00 (-0.04) 0.00 (j0.03)<br />
Aesthetics (and friendliness) (BL3 (A) ) 0.41‡ (0.53‡) — 0.43‡ (0.52‡) 0.13‡ (0.11‡) 0.04 (0.08*)<br />
Traffic hazards (BL4 (A) ) j0.55‡ (j0.62‡) — j0.32‡ (j0.41‡) 0.00 (0.00) 0.10‡ (0.02)<br />
Crime (BL5 (A) ) 0.26† (0.21†) — 0.28† (0.21†) 0.04 (0.09†) 0.09† (0.08*)<br />
Individual-Level Factors<br />
Land use mix–access (IL1 (A) ) — 0.09† (0.09†) 0.48‡ (0.48‡) 0.10† (0.09†) 0.03 (0.04)<br />
Street connectivity (IL2 (A) ) — 0.03 (0.06 ) 0.61‡ (0.61‡) 0.00 (0.05 ) 0.01 (0.03)<br />
Infrastructure and safety for walking/cycling<br />
— 0.00 (0.03) 0.46‡ (0.59‡) 0.00 (0.00) 0.00 (0.00)<br />
(IL3 (A) )<br />
Aesthetics (IL4 (A) ) — 0.12‡ (0.12‡) 0.44‡ (0.52‡) 0.12‡ (0.11‡) 0.06* (0.08*)<br />
Traffic hazards (IL5 (A) ) — j0.04 (j0.01 ) j0.16 (j0.33‡) j0.03 (0.00) 0.11‡ (j0.02)<br />
Crime (IL6 (A) ) — 0.04 (0.05) 0.17* (0.21†) 0.06† (0.09†) 0.07* (0.08*)<br />
Predefined <strong>Scale</strong>s<br />
Residential density (RD) — — 0.80‡ (0.80‡) 0.00 (0.00) 0.17‡ (0.17‡)<br />
Land use mix–diversity (LUM-D) — — 0.53‡ (0.53‡) 0.07* (0.07*) 0.07* (0.07*)<br />
Single Items<br />
Parking is difficult in local shopping areas (A3) — — 0.68‡ (0.68‡) 0.00 (0.00) 0.04 (0.04)<br />
The streets in my neighborhood are hilly,<br />
— — 0.00 ( 0.00 ) j0.03 (j0.03) j0.04 (j0.04 )<br />
making my neighborhood difficult to walk in (A6)<br />
There are many canyons/hillsides in my<br />
— — j0.22* (j0.22*) j0.03 (j0.03) j0.01 (j0.01)<br />
neighborhood that limit the number of routes for<br />
getting from place to place (A7)<br />
The streets in my neighborhood do not have<br />
— — 0.12 (0.12) 0.00 (0.00) 0.00 (0.00)<br />
many cul-de-sacs (B1)<br />
I see and speak to other people when I am<br />
— — j0.09 0.16‡ 0.08†<br />
walking in my neighborhood (F1)<br />
* P G 0.05; † P G 0.01; ‡ P G 0.001.<br />
hypothesized, with the traffic and safety a priori factor,<br />
thus forming an infrastructure and safety for walking<br />
factor. This finding is not surprising because items E6–E9<br />
describe pedestrian-related safety features of the local area<br />
rather than presence of motorized traffic. All of the<br />
remaining items that were hypothesized to gauge traffic<br />
safety (E1–E5, E10) pertained to presence of motorized<br />
traffic. Items D1 and D2 (trees in the local area) and E8<br />
and E9 (crossways to help cross busy streets) had<br />
correlated uniqueness.<br />
In the final individual-level measurement model, all factor<br />
loadings and uniquenesses were significant at the 0.001<br />
probability level (Table 3). The interrelationships between<br />
the individual-level factors of the NEWS are reported in<br />
Table 4 (above diagonal). In general, at the individual<br />
(within-blockgroup) level, support was found for the<br />
hypothesized six-factor measurement model of the NEWS,<br />
although not all items loaded on the expected factor.<br />
At the blockgroup level, an analysis of factor loadings,<br />
modification indices, and residual covariance matrix<br />
suggested a different measurement model from that at<br />
the individual level. Five, rather than six, oblique factors<br />
were identified. These were land use mix–access and<br />
infrastructure for walking, physical obstacles to walking/<br />
cycling, aesthetics and friendliness, traffic hazards, and<br />
1688 Official Journal of the American College of Sports Medicine<br />
crime (Table 3). Weak to strong associations were<br />
observed between the latent blockgroup-level factors<br />
(Table 5). Similarly to what was observed for the<br />
individual-level measurement model, item B2 did not<br />
significantly load on any of the latent blockgroup-level<br />
factors. All other items’ standardized loadings were<br />
significant at the 0.001 level.<br />
Phase II: Selection of items for NEWS-A. Following<br />
the previously outlined procedure (see Data analytic plan:<br />
phase II), items A1, B2, B4, C2, C3, C6, D2, D4, E1, E3, E9,<br />
E10, F1, and F5 were excluded from the NEWS-A (Table 2;<br />
part b). Details on the psychometric characteristics of these<br />
items are available at www.drjamessallis.sdsu.edu.<br />
Phase III: Confirmatory factor analysis of the<br />
NEWS-A. The two-level measurement model of the<br />
NEWS-A based on the multilevel CFA of the NEWS (see<br />
phase I) showed a good level of fit (Table 2, part b). An<br />
analysis of the interfactor correlations, standardized<br />
loadings, and modification indices suggested that no<br />
alterations to the model were needed at the individual level.<br />
At the blockgroup-level, the pattern of interfactor<br />
relationships called for some modifications (independence<br />
of the factors land use mix–access and infrastructure for<br />
walking, physical obstacles to walking, and crime). Although<br />
the factors traffic hazards and aesthetics were highly<br />
http://www.acsm-msse.org<br />
Copyright @ 2006 by the American College of Sports Medicine. Unauthorized reproduction of this article is prohibited.
negatively correlated (r = j0.86), they were not combined<br />
into one factor because our goal was to develop an<br />
abbreviated NEWS with a measurement model comparable<br />
with its original version. The respecified model of the<br />
NEWS-A yielded a slightly better level of model fit<br />
according to most indices (Table 2, part b). All standardized<br />
loadings and interfactor correlations in the final two-level<br />
measurement model of the NEWS-A were significant at the<br />
0.001 level (Table 3; numbers in brackets). The correlations<br />
between the scores on the NEWS and NEWS-A factors<br />
were very high and ranged between 0.82 and 0.98 at the<br />
blockgroup level and between 0.83 and 0.97 at the<br />
individual level.<br />
Phase IV: Criterion validity of the NEWS and<br />
NEWS-A. Respondents reported, on average, 118 weekly<br />
minutes of walking for recreation (median = 60; SD = 190),<br />
and 163 weekly minutes of walking for transport (median =<br />
60; SD = 289). All of the variance in walking for recreation<br />
was attributable to (within-blockgroup) differences between<br />
individuals. In contrast, approximately 5% of the total<br />
variance of walking for transport was due to differences<br />
between blockgroups.<br />
Factors/scales measuring access/presence of destinations<br />
(BL1 (A) , IL1 (A) , and land use mix–diversity (LUM-D)),<br />
street connectivity (IL2 (A) ), infrastructure for walking<br />
(BL2 (A) and IL3 (A) ), residential density (RD), and aesthetics<br />
(BL3 (A) and IL4 (A) ) were expected to be positively<br />
correlated, and crime (BL5 (A) and IL6 (A) ) and traffic hazards<br />
(BL4 (A) and IL5 (A) ) were negatively correlated with walking<br />
for transport. In general, this was found to be true (Table 6,<br />
walking for transport section). However, a positive relationship<br />
was found between walking for transport and the crime<br />
factors. With respect to walking for recreation, positive<br />
associations were expected with infrastructure for walking<br />
(IL3 (A) ), aesthetics (BL3 (A) and IL4 (A) ), and presence of<br />
destinations (LUM-D), whereas negative associations were<br />
expected with crime (BL5 (A) and IL6 (A) ) and traffic hazards<br />
(BL4 (A) and IL5 (A) ). Partial support was found only for the<br />
hypothesized relationships with aesthetics and presence of<br />
destinations (Table 6, walking for recreation section). In<br />
contrast, weak but positive associations were observed<br />
between crime, traffic hazards, and walking for recreation.<br />
DISCUSSION<br />
The present study examined the factorial and criterion<br />
validity of the original NEWS and the abbreviated NEWS-A<br />
in a large sample of adults. The type of sampling design and<br />
the presence of meaningful cluster effects called for the<br />
application of a multilevel approach to the confirmatory<br />
factor analysis (CFA) (2,22,31). The end result of a<br />
multilevel CFA is the estimation of a measurement model<br />
for each level of variation. In this study, two measurement<br />
models of the NEWS and NEWS-A were estimated: one at<br />
the individual level (based on within-blockgroup variations<br />
in the responses to the items), the other at the blockgroup<br />
level (based on between-blockgroup variations in the<br />
responses to the items).<br />
Although similar, the two measurement models of the<br />
NEWS (and NEWS-A) were not equivalent. These findings<br />
indicated the environmental attributes measured by the<br />
items of NEWS and NEWS-A might group in different<br />
ways within and across neighborhoods/blockgroups in the<br />
geographic area examined in this study. For instance,<br />
blockgroups reported to offer a greater number of commercial<br />
and noncommercial destinations were also reported to<br />
have better street connectivity (i.e., intersections, alternative<br />
routes) and infrastructure for walking. These three attributes<br />
formed a single factor at the blockgroup level. In contrast, at<br />
the within-blockgroup (individual) level, these characteristics<br />
were not as strongly associated and formed separate<br />
low to moderately intercorrelated factors. These findings<br />
might be an expression of the way environmental attributes<br />
objectively covary within the same census blockgroup (e.g.,<br />
areas with a high level of street connectivity may vary in the<br />
number and types of destinations they offer to individuals<br />
within a given blockgroup). However, the observed differences<br />
between the blockgroup- and individual-level measurement<br />
models also may be due partly to the different<br />
mechanisms determining the grouping of the items at the<br />
two levels of variations. Specifically, the blockgroup-level<br />
measurement model is likely to be more reflective of the<br />
way environmental attributes group objectively because it is<br />
based on the blockgroup average scores of the items across<br />
residents. The average resident rating is likely to be a more<br />
reliable and valid measure of the objective environment than<br />
a single resident rating.<br />
Besides being reflective of the objective covariation of<br />
environmental attributes within a blockgroup, the individuallevel<br />
measurement model may be determined by perceptual<br />
biases. For instance, the relationship between crime and<br />
traffic hazards blockgroup-level latent factors (BL4 (A) and<br />
BL5 (A) ) was consistently lower than that between the<br />
corresponding individual-level latent factors (IL5 (A) and<br />
IL6 (A) ). This could be due to respondents higher in trait<br />
anxiety giving higher ratings to all items describing<br />
potentially threatening stimuli, such as those loading on<br />
the crime and traffic hazards factors (10), even though these,<br />
in reality, were not correlated. In such case, the observed<br />
relationship between crime and traffic hazards would be<br />
stronger at the individual than at the blockgroup level. This<br />
is because the individual-level factors describe individual<br />
differences in perception of the local environment.<br />
The above discussion calls for explicit recommendations<br />
on how to score the NEWS and NEWS-A for various study<br />
purposes. One alternative would be to use both blockgroupand<br />
individual-level factors, with the former computed as<br />
disaggregated blockgroup mean scores and the latter<br />
computed as individual deviations from the blockgroup<br />
means. Such an approach could help differentiate between<br />
objective environmental characteristics and residents’ idiosyncratic<br />
perceptions of the environment, which, in turn,<br />
could aid evaluation of their independent associations with<br />
physical activity. However, caution is warranted because of<br />
the unknown generalizability of present study measurement<br />
models to other locations. The conceptual soundness of the<br />
NEWS AND NEWS-A VALIDITY Medicine & Science in Sports & Exercise d<br />
1689<br />
Copyright @ 2006 by the American College of Sports Medicine. Unauthorized reproduction of this article is prohibited.
individual-level measurement model suggests that the<br />
individual-level scales would be applicable to other settings.<br />
However, cross-validation, particularly of the blockgrouplevel<br />
factors to samples in other geographical locations, is<br />
certainly needed. The observed blockgroup-level measurement<br />
models were based on a nonrepresentative sample of<br />
census blockgroups, where only high and low, but not<br />
moderate, walkable blockgroups were selected. This likely<br />
increased the associations between certain environmental<br />
characteristics (e.g., street connectivity and land use mix).<br />
Secondly, patterns of association between environmental<br />
characteristics (e.g., high street connectivity predictive of<br />
high land-use mix) may vary across urban and other (e.g.,<br />
rural) areas. If the blockgroup-level measurement models<br />
are shown to vary across locations, researchers are encouraged<br />
to carry out a multilevel CFA on their data and apply<br />
the measurement model they observe. Of course, this<br />
alternative solution applies to studies adopting a two-stage<br />
cluster sampling design with a sufficient sample size of<br />
residents and geographic units such as census blockgroups<br />
or neighborhoods (9 100) (15).<br />
Presently, it is recommended that the NEWS and NEWS-A<br />
be scored according to the individual-level measurement<br />
model, particularly for studies that do not adopt a two-stage<br />
cluster-sampling design, are limited in size, and focus on the<br />
effect of perceived rather than objective and perceived<br />
environment on physical activity. In this case, the NEWS<br />
and NEWS-A would consist of eight subscales (residential<br />
density, land use mix–diversity, land use mix–access, street<br />
connectivity, infrastructure and safety for walking/cycling,<br />
aesthetics, traffic hazards, and crime) and five (for the NEWS)<br />
or four (for the NEWS-A) single items (access to parking,<br />
hilly streets, physical/natural obstacles, not many cul-de-sacs,<br />
and interaction with neighbors). These individual-level scales<br />
are clearly related to constructs commonly used in the urban<br />
planning and transportation fields (11). Findings based on<br />
these scales can be linked with specific policies that could<br />
improve the activity-friendliness of neighborhoods.<br />
Overall, this study supported the construct validity of the<br />
NEWS (and NEWS-A). Six intercorrelated latent factors<br />
were identified at the individual level. In general, the<br />
observed factors matched the original hypothesized measurement<br />
model, although not all items loaded on the a<br />
priori factors. Importantly, the modifications made to the a<br />
priori measurement model of the NEWS were substantively<br />
justifiable. Convergent and divergent validity evidence was<br />
found for the observed factors in relation to walking for<br />
transport. As expected, less support was found for the<br />
criterion validity of the NEWS and NEWS-A with respect<br />
to walking for recreation. However, most of the NEWS<br />
constructs were designed to be related to active transportation,<br />
and other surveys have been designed to assess<br />
environmental factors relevant for active recreation (24).<br />
When compared with the NEWS, the measurement model<br />
of the NEWS-A showed a better fit to the data and<br />
marginally better criterion validity with respect to walking<br />
for transport. Because it is possible that these results might<br />
be specific to this location or sample, future studies need to<br />
establish whether the NEWS-A is consistently a better<br />
instrument to assess neighborhood walkability than the<br />
NEWS. At this stage, we recommend that researchers use<br />
the NEWS-A rather than the NEWS whenever participant<br />
burden is a significant concern.<br />
It is important to mention that, although only weak<br />
associations between walking and the NEWS (and NEWS-<br />
A) factors/items were observed at the individual level, they<br />
were moderate to strong at the blockgroup level. Importantly,<br />
some individual differences in the responses to the<br />
NEWS (and the IPAQ) are due to measurement error. This<br />
indicates that the strength of the relationship between<br />
environmental attributes and physical activity behavior<br />
may be considerably greater than previously noted or<br />
suspected. However, even if these associations were truly<br />
weak, environmental factors would still need to be<br />
considered as a key component of the public health agenda.<br />
Public health effects depend on the effect size, number of<br />
people exposed, and duration of exposure. For instance, it<br />
has been estimated that about 50% of Americans live in<br />
low-density, low-walkable areas (28). Thus, the weak<br />
effect sizes are magnified by high exposure and the fact<br />
that people are exposed to neighborhood attributes every<br />
day over many years. The potential public health burden<br />
linked with low-walkable neighborhoods needs to be<br />
carefully studied to inform policy decisions. The development<br />
of high-quality measures is the first step toward this<br />
final goal.<br />
The authors would like to thank Kerri Cain and Terry Conway for<br />
their contribution to the project and acknowledge that, at the time<br />
of the write-up of this paper, Ester Cerin was supported by NHMRC<br />
Grant #252977 and worked at the Cancer Prevention Research<br />
Centre (School of Population Health, The University of Queensland,<br />
Australia). This work was also supported by NIH grant HL67350.<br />
REFERENCES<br />
1. ATKINSON, J. L., J. F. SALLIS, E.SAELENS, L.CAIN, and J. B. BLACK.<br />
The association of neighborhood design and recreational environments<br />
with physical activity. Am. J. Health Promotion 19:<br />
304–309, 2005.<br />
2. BENTLER, P. M., and J. LIANG. Two-level mean and covariance<br />
structures: maximum likelihood via an EM algorithm, In:<br />
Multilevel Modeling: Methodological Advances, Issues, and<br />
Applications, S. P. Reise and N. Duan (Eds.). Mahwah, NJ:<br />
Lawrence Erlbaum, pp. 53–70, 2003.<br />
3. BINER, P. M., and H. J. KIDD. The interactive effects of monetary<br />
1690 Official Journal of the American College of Sports Medicine<br />
incentive justification and questionnaire length on mail survey<br />
response rates. Psychol. Market 11:483–492, 1994.<br />
4. BROWNE, M. W., and R. CUDECK. Alternative ways of assessing<br />
model fit. In: Testing Structural Equation Models, K. A. Bolennn<br />
and J. S. Long (Eds.). Newbury Park, CA: Sage Publications,<br />
pp. 136–162, 1993.<br />
5. BROWNSON, R. C., J. J. CHANG, A.A.EYLER, et al. Measuring the<br />
environment for friendliness toward physical activity: a comparison<br />
of the reliability of 3 questionnaires. Am. J. Public Health<br />
94:473–483, 2004.<br />
http://www.acsm-msse.org<br />
Copyright @ 2006 by the American College of Sports Medicine. Unauthorized reproduction of this article is prohibited.
6. BRYANT, F. B., and P. R. YARNOLD. Principal-components analysis<br />
and exploratory and confirmatory factor analysis. In: Reading<br />
and Understanding Multivariate Statistics, L. G. Grimm and<br />
P. R. Yarnold. Washington, DC: APA, pp. 99–136, 1994.<br />
7. CRAIG, C. L., A. L. MARSHALL, M.SJÖSTRÖM, et al. International<br />
Physical Activity Questionnaire (IPAQ): 12-country reliability<br />
and validity. Med. Sci. Sports Exerc. 35:1381–1395, 2003.<br />
8. CURRAN, P. J., S. G. WEST, and J. F. FINCH. The robustness of test<br />
statistics to nonnormality and specification error in confirmatory<br />
factor analysis. Psychol. Methods 1:16–29, 1996.<br />
9. DE BOURDEAUDHUIJ, I., J. F. SALLIS, and B. E. SAELENS.<br />
<strong>Environment</strong>al correlates of physical activity in a sample of<br />
Belgian adults. Am. J. Health Promotion 18:83–92, 2003.<br />
10. EDELMANN, R. J. Anxiety Theory, Research and Intervention<br />
in Clinical and Health Psychology. New York: Wiley, pp. 1–349,<br />
1992.<br />
11. FRANK, L. D., P. O. ENGELKE, and T. L. SCHMID. Health and<br />
Community Design: The Impact of the Built <strong>Environment</strong> on<br />
Physical Activity. Washington, DC: Island, pp. 99–177, 2003.<br />
12. FRANK, L. D., J. F.SALLIS, T.L.CONWAY, et al. Many pathways<br />
from land use to health: associations between neighborhood<br />
walkability and active transportation, body mass and air quality.<br />
J. Am. Planning Assoc. 72:75–87, 2006.<br />
13. FRANK, L. D., T. L. SCHMID, J.F.SALLIS, and J. E. CHAPMAN.<br />
Linking objectively measured physical activity data with objectively<br />
measured urban form: findings from SMARTRAQ. Am. J.<br />
Prev. Med. 28(Suppl. 2):117–125, 2005.<br />
14. HEATH, G. W., R. C. BROWNSON, J.KRUGER, et al. The effectiveness<br />
of urban design and land use and transport policies and<br />
practices to increase physical activity: a systematic review.<br />
J. Phys. Act. Health 3(Suppl. 1):S55–S76, 2006.<br />
15. HOX, J. Multilevel Analysis: Techniques and Applications.<br />
Mahwah, NJ: Laurence Erlbaum, pp. 173–196, 2002.<br />
16. HU, L., and P. M. BENTLER. Cutoff criteria for fit indices in<br />
covariance structure analysis: conventional criteria versus new<br />
alternatives. Struct. Equat. Model 6:1–55, 1999.<br />
17. HUMPEL, N., N. OWEN, and E. LESLIE. <strong>Environment</strong>al factors<br />
associated with adults’ participation in physical activity: a<br />
review. Am. J. Prev. Med. 22:188–199, 2002.<br />
18. JÖRESKOG, K. G., and D. SÖRBOM. LISREL 8: Structural Equation<br />
Modelling with the SIMPLIS Command Language. Chicago, IL:<br />
SPSS, pp. 1–186, 1993.<br />
19. KLINE, R. B. Principles and Practice of Structural Equation<br />
Modeling. New York: Guilford Press, pp. 165–208, 2005.<br />
20. LESLIE, E., B. SAELENS, L.FRANK, et al. Residents’ perceptions of<br />
walkability attributes in objectively different neighbourhoods: a<br />
pilot study. Health Place 11:227–236, 2005.<br />
21. MCLEROY, K., D. BIBEAU, A. STECKLER, and K. GLANZ. An<br />
ecological perspective on health promotion programs. Health<br />
Educ. Q. 15:351–377, 1988.<br />
22. MUTHÉN, B. O. Latent variable modeling of longitudinal and<br />
multilevel data. In: Sociological Methodology, A. E. Raftery<br />
(Eds.). Washington, DC: ASA, pp. 453–481, 1997.<br />
23. RASBASH, J., F. STEELE, W.BROWNE, and B. PROSSER. A User’s<br />
Guide to MLwiN (version 2). London, UK: CMM, IE, University<br />
of London, pp. 136–153, 2004.<br />
24. SAELENS, B. E., F. SALLIS, B.BLACK, and D. CHEN. <strong>Neighborhood</strong>based<br />
differences in physical activity: an environmental scale<br />
evaluation. Am. J. Public Health 93:1552–1558, 2003.<br />
25. SAELENS, B. E., J. F. SALLIS, and L. D. FRANK. <strong>Environment</strong>al<br />
correlates of walking and cycling: findings from the transportation,<br />
urban design, and planning literatures. Ann. Behav. Med.<br />
25:80–91, 2003.<br />
26. SALLIS, J. F., M. F. JOHNSON, K.J.CALFAS, S.CAPAROSA, and<br />
J. NICHOLS. Assessing perceived physical environment variables<br />
that may influence physical activity. Res. Q. Exerc. Sport 68:<br />
345–351, 1997.<br />
27. SALLIS, J. F., and N. OWEN. Ecological models of health behavior.<br />
In: Health Behavior and Health Education: Theory, Research,<br />
and Practice, K. Glanz, F. M. Lewis, and B. K. Rimer. San<br />
Francisco, CA: Jossey-Bass, pp. 403–424, 2002.<br />
28. SCHILLING, J., and L. S. LINTON. The public health roots of zoning:<br />
in search of active living’s legal genealogy. Am. J. Prev. Med.<br />
28:96–104, 2005.<br />
29. SNIJDER, T. A. B., and R. BOSKER. Modeled variance in two level<br />
models. Sociol. Method Res. 22:342–363, 1994.<br />
30. TRANSPORTATION RESEARCH BOARD AND INSTITUTE OF MEDICINE.<br />
Does the Built <strong>Environment</strong> Influence Physical Activity? Examining<br />
the Evidence. Special Report 282. Washington, DC:<br />
National Academies Press, pp. 1–248, 2005.<br />
31. VAN DE VIJVER, F. J. R., and H. POORTINGA. Structural equivalence<br />
in multilevel research. J. Cross-Cultural Psychol. 33:141–156, 2002.<br />
32. VANDELANOTTE, C., I. DE BOURDEAUDHUIJ, R. PHILIPPAERTS,<br />
M. SJÖSTRÖM, and J. SALLIS. Reliability and validity of a computerized<br />
and Dutch version of the International Physical Activity<br />
Questionnaire (IPAQ). J. Phys. Activity Health 2:63–75, 2005.<br />
33. WHITE, H. Maximum likelihood estimation of misspecified<br />
models. Econometrica 50:1–25, 1982.<br />
NEWS AND NEWS-A VALIDITY Medicine & Science in Sports & Exercise d<br />
1691<br />
Copyright @ 2006 by the American College of Sports Medicine. Unauthorized reproduction of this article is prohibited.