June - 2012 - New York State Regents Earth Science
June - 2012 - New York State Regents Earth Science
June - 2012 - New York State Regents Earth Science

You also want an ePaper? Increase the reach of your titles
YUMPU automatically turns print PDFs into web optimized ePapers that Google loves.
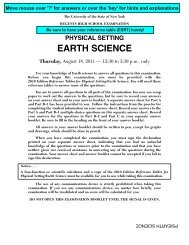
P.S./EARTH SCIENCE<br />
The University of the <strong>State</strong> of <strong>New</strong> <strong>York</strong><br />
REGENTS HIGH SCHOOL EXAMINATION<br />
PHYSICAL SETTING<br />
EARTH SCIENCE<br />
Friday, <strong>June</strong> 15, <strong>2012</strong> — 1:15 to 4:15 p.m., only<br />
Use your knowledge of <strong>Earth</strong> science to answer all questions in this examination.<br />
Before you begin this examination, you must be provided with the<br />
2011 Edition Reference Tables for Physical Setting/<strong>Earth</strong> <strong>Science</strong>. You will need these<br />
reference tables to answer some of the questions.<br />
You are to answer all questions in all parts of this examination. You may use scrap<br />
paper to work out the answers to the questions, but be sure to record your answers<br />
on your answer sheet and in your answer booklet. A separate answer sheet for Part A<br />
and Part B–1 has been provided to you. Follow the instructions from the proctor for<br />
completing the student information on your answer sheet. Record your answers to the<br />
Part A and Part B–1 multiple-choice questions on this separate answer sheet. Record<br />
your answers for the questions in Part B–2 and Part C in your separate answer<br />
booklet. Be sure to fill in the heading on the front of your answer booklet.<br />
All answers in your answer booklet should be written in pen, except for graphs<br />
and drawings, which should be done in pencil.<br />
When you have completed the examination, you must sign the declaration<br />
printed on your separate answer sheet, indicating that you had no unlawful<br />
knowledge of the questions or answers prior to the examination and that you have<br />
neither given nor received assistance in answering any of the questions during the<br />
examination. Your answer sheet and answer booklet cannot be accepted if you fail to<br />
sign this declaration.<br />
Notice. . .<br />
A four-function or scientific calculator and a copy of the 2011 Edition Reference Tables for<br />
Physical Setting/<strong>Earth</strong> <strong>Science</strong> must be available for you to use while taking this examination.<br />
The use of any communications device is strictly prohibited when taking this<br />
examination. If you use any communications device, no matter how briefly, your<br />
examination will be invalidated and no score will be calculated for you.<br />
DO NOT OPEN THIS EXAMINATION BOOKLET UNTIL THE SIGNAL IS GIVEN.<br />
P.S./EARTH SCIENCE
Part A<br />
Answer all questions in this part.<br />
Directions (1–35): For each statement or question, choose the word or expression that, of those given, best<br />
completes the statement or answers the question. Some questions may require the use of the 2011 Edition<br />
Reference Tables for Physical Setting/<strong>Earth</strong> <strong>Science</strong>. Record your answers on your separate answer sheet.<br />
1 A Foucault pendulum appears to change its<br />
direction of swing because <strong>Earth</strong><br />
(1) is tilted on its axis<br />
(2) is spinning on its axis<br />
(3) has a curved surface<br />
(4) has a density of 5.5 g/cm 3<br />
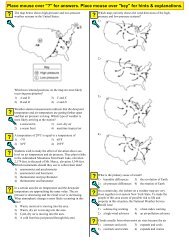
5 The map below shows an eastern portion of<br />
North America. Points A and B represent locations<br />
on the eastern shoreline.<br />
Canada<br />
2 The modern heliocentric model of planetary<br />
motion states that the planets travel around<br />
(1) the Sun in slightly elliptical orbits<br />
(2) the Sun in circular orbits<br />
(3) <strong>Earth</strong> in slightly elliptical orbits<br />
(4) <strong>Earth</strong> in circular orbits<br />
<strong>New</strong> <strong>York</strong><br />
A<br />
3 To an observer on <strong>Earth</strong>, the Sun appears<br />
brighter than the star Rigel because the Sun is<br />
(1) hotter than Rigel<br />
(2) more luminous than Rigel<br />
(3) closer than Rigel<br />
(4) larger than Rigel<br />
Florida<br />
Atlantic<br />
Ocean<br />
4 The cross section below represents four locations<br />
on a mountain. The arrow indicates the prevailing<br />
wind direction.<br />
Gulf of Mexico<br />
B<br />
0 500 miles<br />
Prevailing wind<br />
Ocean<br />
A<br />
B<br />
C<br />
D<br />
Which factor is primarily responsible for location A<br />
having a lower average yearly temperature<br />
than location B?<br />
(1) nearness to a large body of water<br />
(2) elevation<br />
(3) latitude<br />
(4) prevailing winds<br />
Which location has the warmest and most arid<br />
climate?<br />
(1) A (3) C<br />
(2) B (4) D<br />
6 El Cuy is a South American city located at<br />
40° south latitude. The first day of winter at this<br />
location occurs on <strong>June</strong> 21. During which month<br />
would the coldest day of the year most likely<br />
occur at this location?<br />
(1) May (3) November<br />
(2) July (4) January<br />
P.S./E. Sci.–<strong>June</strong> ’12 [2]
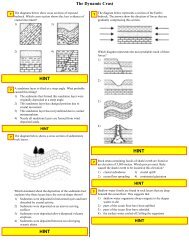
7 The map below shows a typical position and<br />
average velocity of the polar front jet stream<br />
during two different seasons.<br />
Polar<br />
front jet stream — Summer<br />
Polar front jet<br />
(60<br />
United <strong>State</strong>s<br />
stream — Winter<br />
(125<br />
km/h)<br />
km/h)<br />
For the eastern United <strong>State</strong>s, the change of the<br />
polar front jet stream from this summer position<br />
to this winter position causes<br />
(1) warmer temperatures farther north and<br />
causes storms to move more slowly<br />
(2) warmer temperatures farther north and<br />
causes storms to move more rapidly<br />
(3) cooler temperatures farther south and causes<br />
storms to move more slowly<br />
(4) cooler temperatures farther south and causes<br />
storms to move more rapidly<br />
8 Which soil characteristic allows greater amounts<br />
of water retention?<br />
(1) large-size particles<br />
(2) small-size particles<br />
(3) high-density particles<br />
(4) low-density particles<br />
9 A paved blacktop parking lot was built on what<br />
was once a soil-covered field. This area will now<br />
experience increased runoff when rain occurs<br />
because the paved parking lot has<br />
(1) less capillarity (3) greater infiltration<br />
(2) less permeability (4) greater porosity<br />
10 Which processes of the water cycle return water<br />
vapor directly to the atmosphere?<br />
(1) evaporation and transpiration<br />
(2) infiltration and capillarity<br />
(3) freezing and precipitation<br />
(4) water retention and runoff<br />
N<br />
11 Evidence supports the idea that increases in carbon<br />
dioxide and methane in <strong>Earth</strong>’s atmosphere are<br />
major contributors to global warming. This is<br />
based primarily on the fact that carbon dioxide<br />
and methane are excellent absorbers of<br />
(1) gamma rays (3) visible light<br />
(2) microwaves (4) infrared radiation<br />
12 The bedrock of the Adirondack Mountains was<br />
formed mainly by the<br />
(1) cementation of clastic sediments and<br />
precipitates from seawater<br />
(2) compaction and recrystallization of volcanic<br />
material<br />
(3) regional metamorphism of sedimentary and<br />
igneous rocks<br />
(4) contact metamorphism of unconsolidated<br />
gravels<br />
13 Which element, found in both biotite mica and<br />
muscovite mica, makes up the greatest percent by<br />
volume of <strong>Earth</strong>’s crust?<br />
(1) nitrogen (3) potassium<br />
(2) oxygen (4) silicon<br />
14 The inferred temperature and pressure of <strong>Earth</strong>’s<br />
interior at a depth of 3,000 kilometers are<br />
approximately<br />
(1) 1000°C and 0.5 million atmospheres<br />
(2) 1000°C and 1.0 million atmospheres<br />
(3) 5000°C and 1.5 million atmospheres<br />
(4) 5000°C and 3.0 million atmospheres<br />
15 Which agent of erosion most likely formed the<br />
drumlins and finger lakes in <strong>New</strong> <strong>York</strong> <strong>State</strong>?<br />
(1) running water (3) wave action<br />
(2) moving ice (4) mass movement<br />
16 The longest portion of the Genesee River in <strong>New</strong><br />
<strong>York</strong> <strong>State</strong> flows through which landscape<br />
region?<br />
(1) Erie-Ontario Lowlands<br />
(2) Tug Hill Plateau<br />
(3) Allegheny Plateau<br />
(4) St. Lawrence Lowlands<br />
P.S./E. Sci.–<strong>June</strong> ’12 [3] [OVER]
17 A model of <strong>Earth</strong>’s internal structure is shown<br />
below.<br />
Asthenosphere<br />
Solid<br />
Liquid<br />
Core<br />
Lithosphere<br />
(crust and<br />
rigid mantle)<br />
Mantle<br />
20 Which mineral will scratch fluorite, galena, and<br />
pyroxene?<br />
(1) graphite (3) olivine<br />
(2) calcite (4) dolomite<br />
21 Which radioactive isotope is most often used<br />
when determining the age of fossil bones found<br />
in sediments deposited during the Holocene<br />
Epoch?<br />
(1) carbon-14 (3) uranium-238<br />
(2) potassium-40 (4) rubidium-87<br />
22 The photograph below shows index fossil shells<br />
found in bedrock in <strong>New</strong> <strong>York</strong> <strong>State</strong>.<br />
(Not drawn to scale)<br />
Analysis of which type of data led to the development<br />
of this model?<br />
(1) seismic waves<br />
(2) depth of <strong>Earth</strong>’s oceans<br />
(3) electromagnetic radiation<br />
(4) isobar gradients<br />
18 What caused the interior of <strong>Earth</strong> to separate<br />
into layers?<br />
(1) a decrease in the rate of rotation of <strong>Earth</strong><br />
(2) the gravitational pull on materials of varying<br />
densities<br />
(3) variations in heating by the Sun due to<br />
<strong>Earth</strong>’s tilt<br />
(4) collisions with meteors and comets<br />
19 Which plate tectonic events occurred as the<br />
Iapetus Ocean closed?<br />
(1) Taconian orogeny and Grenville orogeny<br />
(2) Taconian orogeny and Acadian orogeny<br />
(3) Alleghenian orogeny and Acadian orogeny<br />
(4) Alleghenian orogeny and Grenville orogeny<br />
These index fossil shells were most likely found<br />
in the surface bedrock of which landscape<br />
region?<br />
(1) Adirondack Mountains<br />
(2) the Catskills<br />
(3) St. Lawrence Lowlands<br />
(4) Tug Hill Plateau<br />
P.S./E. Sci.–<strong>June</strong> ’12 [4]
Base your answers to questions 23 and 24 on the weather map below, which represents a low-pressure<br />
system over <strong>New</strong> <strong>York</strong> <strong>State</strong>. The L on the map represents the center of the low-pressure system. Two fronts<br />
extend from the center of the low, and are labeled front 1 and front 2. Cloud cover has been omitted from the<br />
station models.<br />
L<br />
52<br />
Old Forge<br />
54<br />
Buffalo<br />
Front 1<br />
76<br />
Front 2<br />
Binghamton<br />
74<br />
Kingston<br />
Riverhead<br />
78<br />
N<br />
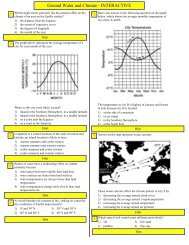
23 The arrows on which map best represent the surface wind pattern around this low-pressure center?<br />
L<br />
L<br />
L<br />
L<br />
( 1 )<br />
( 2 )<br />
( 3 )<br />
( 4 )<br />
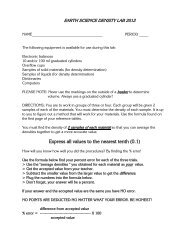
24 Which map best represents the type of fronts and direction of movement of these fronts in relation to the<br />
low-pressure center?<br />
L<br />
L<br />
L<br />
L<br />
( 1 )<br />
( 2 )<br />
( 3 )<br />
( 4 )<br />
P.S./E. Sci.–<strong>June</strong> ’12 [5] [OVER]
25 A timeline from the origin of <strong>Earth</strong> until the present is shown below.<br />
A B C D<br />
ARCHEAN<br />
PRECAMBRIAN<br />
PROTEROZOIC<br />
PHANERO-<br />
ZOIC<br />
Origin of<br />
<strong>Earth</strong><br />
Present<br />
At which letter on the timeline did the Ediacaran fauna exist?<br />
(1) A (3) C<br />
(2) B (4) D<br />
26 The diagram below represents three identical beakers filled to the same level with spherical beads.<br />
Beads of<br />
0.15-cm diameter<br />
Beads of<br />
0.45-cm diameter<br />
Beads of<br />
0.70-cm diameter<br />
A<br />
B<br />
C<br />
If the packing of the beads within each beaker is the same, which graph best represents the porosity within<br />
each beaker?<br />
Porosity<br />
Porosity<br />
Porosity<br />
Porosity<br />
A B C<br />
Beaker<br />
( 1 )<br />
A B C<br />
Beaker<br />
( 2 )<br />
A B C<br />
Beaker<br />
( 3 )<br />
A B C<br />
Beaker<br />
( 4 )<br />
P.S./E. Sci.–<strong>June</strong> ’12 [6]
27 Which diagram correctly represents the curving of <strong>Earth</strong>’s ocean currents and prevailing winds due to the<br />
Coriolis effect?<br />
Key<br />
= Ocean currents<br />
= Prevailing winds<br />
North<br />
Pole<br />
North<br />
Pole<br />
North<br />
Pole<br />
North<br />
Pole<br />
( 1 )<br />
( 2 )<br />
( 3 )<br />
( 4 )<br />
28 A topographic map and an incorrectly constructed profile from point A to point H on the map are shown below.<br />
AB<br />
C<br />
150<br />
Topographic Map<br />
D E<br />
100<br />
F<br />
G<br />
150<br />
H<br />
Elevation (ft)<br />
190<br />
180<br />
170<br />
160<br />
150<br />
140<br />
130<br />
120<br />
110<br />
100<br />
A<br />
B<br />
Incorrect Profile<br />
C<br />
D<br />
E F<br />
Distance (mi)<br />
G<br />
H<br />
What mistake was made in the construction of this profile?<br />
(1) using a contour interval of 10 feet<br />
(2) plotting points A through H the same distance apart horizontally<br />
(3) drawing a curved line instead of a straight line from point B to point C<br />
(4) increasing the elevation from point F to point H<br />
P.S./E. Sci.–<strong>June</strong> ’12 [7] [OVER]
Base your answers to questions 29 and 30 on the map of the night sky below, which represents the apparent<br />
locations of some of the constellations that are visible to an observer at approximately 40° N latitude at 9 p.m.<br />
in April. The point directly above the observer is labeled zenith.<br />
Horizon<br />
Canis Major<br />
South<br />
West<br />
Orion<br />
Zenith Leo<br />
Big<br />
Dipper<br />
Virgo<br />
Bootes<br />
East<br />
Pleiades<br />
Polaris<br />
Little Dipper<br />
Cassiopeia<br />
North<br />
Horizon<br />
29 Which map best illustrates the apparent path of Virgo during the next 4 hours?<br />
South<br />
South<br />
Canis Major<br />
Canis Major<br />
West<br />
Orion<br />
Zenith Leo<br />
Big<br />
Dipper<br />
Virgo<br />
Bootes<br />
East<br />
West<br />
Orion<br />
Zenith Leo<br />
Big<br />
Dipper<br />
Virgo<br />
Bootes<br />
East<br />
Pleiades<br />
Polaris<br />
Little Dipper<br />
Pleiades<br />
Polaris<br />
Little Dipper<br />
Cassiopeia<br />
Cassiopeia<br />
North<br />
North<br />
( 1 ) ( 3 )<br />
South<br />
South<br />
Canis Major<br />
Canis Major<br />
West<br />
Orion<br />
Zenith Leo<br />
Big<br />
Dipper<br />
Virgo<br />
Bootes<br />
East<br />
West<br />
Orion<br />
Zenith Leo<br />
Big<br />
Dipper<br />
Virgo<br />
Bootes<br />
East<br />
Pleiades<br />
Polaris<br />
Little Dipper<br />
Pleiades<br />
Polaris<br />
Little Dipper<br />
Cassiopeia<br />
Cassiopeia<br />
North<br />
North<br />
( 2 ) ( 4 )<br />
30 Which motion causes the constellation Leo to no longer be visible to an observer at 40° N in October?<br />
(1) spin of the constellation on its axis (3) spin of <strong>Earth</strong> on its axis<br />
(2) revolution of the constellation around the Sun (4) revolution of <strong>Earth</strong> around the Sun<br />
P.S./E. Sci.–<strong>June</strong> ’12 [8]
31 An earthquake occurs at 12:02 p.m. A seismic station records the first S-wave at 12:19 p.m. Which set of data<br />
shows the approximate arrival time of the first P-wave and the distance to the epicenter?<br />
(1) 12:11:25 p.m. and 4000 km (3) 12:19:40 p.m. and 4000 km<br />
(2) 12:11:25 p.m. and 6000 km (4) 12:19:40 p.m. and 6000 km<br />
32 The cross section below represents a portion of <strong>Earth</strong>’s crust. Letters A through D are locations within the rock<br />
units.<br />
A<br />
D<br />
B<br />
C<br />
Key<br />
Igneous<br />
intrusion<br />
Contact<br />
metamorphism<br />
At which location is quartzite most likely found?<br />
(1) A (3) C<br />
(2) B (4) D<br />
33 The diagram below represents a total solar eclipse as seen from <strong>Earth</strong>.<br />
Which diagram correctly represents the relative positions of the Sun (S), <strong>Earth</strong> (E), and the Moon (M) in<br />
space during a total solar eclipse? [The diagrams are not drawn to scale.]<br />
M<br />
M S E<br />
S<br />
E<br />
M<br />
S<br />
E<br />
S<br />
M<br />
E<br />
( 1 )<br />
( 2 )<br />
( 3 )<br />
( 4 )<br />
P.S./E. Sci.–<strong>June</strong> ’12 [9] [OVER]
Base your answers to questions 34 and 35 on the diagram and data table below. The diagram shows the<br />
equipment used to determine the factors affecting the rate of erosion in a stream. The data table shows the time<br />
it took a 10-gram sample of quartz sand to move 100 centimeters down the rain gutter under various conditions.<br />
Water faucet<br />
Bucket<br />
Rain gutter<br />
Sink<br />
Textbooks<br />
Flexible hose<br />
Data Table<br />
Rain Gutter<br />
Slope<br />
5°<br />
10°<br />
20°<br />
Water<br />
Velocity<br />
Erosion Time (s)<br />
Fine Sand<br />
Coarse Sand<br />
slow 20 60<br />
fast 15 40<br />
slow 15 40<br />
fast 10 30<br />
slow 10 30<br />
fast 5 15<br />
34 In this experiment, the water velocity could be increased by<br />
(1) decreasing the slope of the rain gutter (3) lowering the flexible hose<br />
(2) increasing the amount of water from the faucet (4) widening the rain gutter<br />
35 What is the relationship between the water velocity and the rate of erosion?<br />
(1) If the water velocity decreases, the rate of erosion increases.<br />
(2) If the water velocity increases, the rate of erosion increases.<br />
(3) If the water velocity remains constant, the rate of erosion decreases.<br />
(4) If the water velocity remains constant, the rate of erosion increases.<br />
P.S./E. Sci.–<strong>June</strong> ’12 [10]
Part B–1<br />
Answer all questions in this part.<br />
Directions (36–50): For each statement or question, choose the word or expression that, of those given, best<br />
completes the statement or answers the question. Some questions may require the use of the 2011 Edition<br />
Reference Tables for Physical Setting/<strong>Earth</strong> <strong>Science</strong>. Record your answers on your separate answer sheet.<br />
Base your answers to questions 36 and 37 on the diagrams below. The diagrams represent the events that<br />
occur when a large meteor, such as the one believed to have caused the extinction of many organisms, impacts<br />
<strong>Earth</strong>’s surface. Diagram A shows the meteor just before impact. Diagram B represents the crater forming,<br />
along with the vapor and ejecta (the fragmented rock and dust) thrown into the atmosphere.<br />
Vapor<br />
Meteor<br />
Ejecta<br />
Melt<br />
Diagram A: Before Impact<br />
Diagram B: During Impact<br />
36 Which statement best explains how global climate would most likely be affected after this large meteor<br />
impact?<br />
(1) Large quantities of ejecta in the atmosphere would block insolation and lower global temperatures.<br />
(2) An increase in vapor and ejecta would allow radiation to escape <strong>Earth</strong>’s atmosphere and lower global<br />
temperatures.<br />
(3) Ejecta settling in thick layers would increase the absorption of insolation by <strong>Earth</strong>’s surface and raise<br />
global temperatures.<br />
(4) Forest fires produced from the vapor and ejecta would raise global temperatures.<br />
37 Many meteors are believed to be fragments of celestial objects normally found between the orbits of Mars<br />
and Jupiter. These objects are classified as<br />
(1) stars (3) planets<br />
(2) asteroids (4) moons<br />
P.S./E. Sci.–<strong>June</strong> ’12 [11] [OVER]
Base your answers to questions 38 through 41 on the diagram and data table below. The diagram represents<br />
the Sun’s apparent paths as viewed by an observer located at 50° N latitude on <strong>June</strong> 21 and March 21. The data<br />
table shows the Sun’s maximum altitude for the same two dates of the year. The Sun’s maximum altitude for<br />
December 21 has been left blank.<br />
60<br />
70<br />
80<br />
90<br />
80<br />
70<br />
60<br />
Data Table<br />
30<br />
40<br />
50<br />
50<br />
40<br />
30<br />
Date<br />
Sun’s<br />
Maximum<br />
Altitude<br />
S<br />
10<br />
0<br />
20<br />
March 21<br />
W<br />
Observer<br />
<strong>June</strong> 21<br />
20<br />
10<br />
0<br />
N<br />
<strong>June</strong> 21 63.5°<br />
March 21 40°<br />
December 21<br />
E<br />
38 Which value should be placed in the data table for the Sun’s maximum altitude on December 21?<br />
(1) 16.5° (3) 40°<br />
(2) 23.5° (4) 90°<br />
39 Which graph best represents the relationship between the time of day and the length of a shadow cast by<br />
the observer on March 21?<br />
Length of Shadow<br />
Length of Shadow<br />
6 a.m. 12 noon 6 p.m.<br />
( 1 )<br />
6 a.m. 12 noon 6 p.m.<br />
( 2 )<br />
Length of Shadow<br />
Length of Shadow<br />
6 a.m. 12 noon 6 p.m.<br />
( 3 )<br />
6 a.m. 12 noon 6 p.m.<br />
( 4 )<br />
P.S./E. Sci.–<strong>June</strong> ’12 [12]
30<br />
40<br />
40 Which statement best compares the intensity and angle of insolation at noon on March 21 and <strong>June</strong> 21?<br />
(1) The intensity and angle of insolation are greatest on March 21.<br />
(2) The intensity and angle of insolation are greatest on <strong>June</strong> 21.<br />
(3) The intensity of insolation is greatest on <strong>June</strong> 21 and the angle of insolation is greatest on March 21.<br />
(4) The intensity of insolation is greatest on March 21 and the angle of insolation is greatest on <strong>June</strong> 21.<br />
41 Which diagram represents the approximate location of the Sun at 3 p.m. on March 21?<br />
60<br />
70<br />
80<br />
90<br />
80<br />
70<br />
60<br />
50<br />
50<br />
40<br />
30<br />
30<br />
60<br />
70<br />
80<br />
90<br />
80<br />
70<br />
60<br />
50<br />
50<br />
40<br />
40<br />
30<br />
20<br />
30<br />
W<br />
30<br />
20<br />
20<br />
30<br />
W<br />
Sun<br />
30<br />
20<br />
10<br />
10<br />
10<br />
10<br />
0<br />
N<br />
0Sun<br />
0S N<br />
E<br />
( 1 )<br />
E<br />
( 3 )<br />
60<br />
70<br />
80<br />
90<br />
80<br />
70<br />
60<br />
60<br />
70<br />
80<br />
90<br />
80<br />
70<br />
60<br />
40<br />
50<br />
50<br />
40<br />
40<br />
50<br />
Sun<br />
50<br />
40<br />
20<br />
W<br />
20<br />
20<br />
W<br />
20<br />
10<br />
10<br />
10<br />
10<br />
0<br />
Sun<br />
0S N<br />
0<br />
0S N<br />
E<br />
( 2 )<br />
E<br />
( 4 )<br />
P.S./E. Sci.–<strong>June</strong> ’12 [13] [OVER]
Base your answers to questions 42 through 45 on the laboratory experiment described below.<br />
The weathering of four different rock samples with different masses was studied.<br />
Each rock sample was placed in a separate beaker containing 500 milliliters of a dilute<br />
acid for 10 minutes. Bubbling was observed in some of the beakers. The data table<br />
below shows the mass of each sample, in grams, before placement in the acid and after<br />
removal from the acid.<br />
Data Table<br />
Rock Mass Before (g) Mass After (g)<br />
limestone 19.72 19.64<br />
granite 20.77 20.77<br />
gneiss 26.83 26.83<br />
marble 20.81 20.73<br />
42 Which <strong>Earth</strong> process is being modeled in this experiment?<br />
(1) physical weathering in the hydrosphere (3) chemical weathering in the hydrosphere<br />
(2) physical weathering in the mesosphere (4) chemical weathering in the mesosphere<br />
43 Which table correctly shows the classification of the rock samples based on the amount of weathering<br />
during this experiment?<br />
Group A<br />
Group B<br />
Group A<br />
Group B<br />
limestone<br />
marble<br />
granite<br />
gneiss<br />
limestone<br />
granite<br />
marble<br />
gneiss<br />
(1)<br />
(3)<br />
Group A<br />
Group B<br />
Group A<br />
Group B<br />
limestone<br />
granite<br />
gneiss<br />
marble<br />
limestone<br />
granite<br />
gneiss<br />
marble<br />
(2)<br />
(4)<br />
44 Approximately what percentage of the marble sample remained after the experiment?<br />
(1) 0.4% (3) 20.7%<br />
(2) 8.0% (4) 99.6%<br />
45 Which property of the gneiss sample prevented it from weathering?<br />
(1) crystalline texture (3) density<br />
(2) mineral composition (4) cleavage<br />
P.S./E. Sci.–<strong>June</strong> ’12 [14]
Base your answers to questions 46 through 48 on the topographic map below. Points A, X, and Y are<br />
reference points on the map.<br />
250<br />
500<br />
Flint Creek<br />
X<br />
500<br />
Y<br />
500<br />
500<br />
A<br />
N<br />
Contour interval = 50 meters<br />
0 1 2 3 4 5 km<br />
46 What is a possible elevation of point A?<br />
(1) 575 meters (3) 655 meters<br />
(2) 600 meters (4) 710 meters<br />
47 In which general direction does Flint Creek flow?<br />
(1) southwest (3) northwest<br />
(2) southeast (4) northeast<br />
48 What is the approximate gradient along the straight dashed line between points X and Y?<br />
(1) 50 m/km (3) 150 m/km<br />
(2) 100 m/km (4) 300 m/km<br />
P.S./E. Sci.–<strong>June</strong> ’12 [15] [OVER]
Base your answers to questions 49 and 50 on the diagram below, which represents the current locations of<br />
two planets, A and B, orbiting a star. Letter X indicates a position in the orbit of planet A. Numbers 1 through<br />
4 indicate positions in the orbit of planet B.<br />
4<br />
3<br />
2<br />
1<br />
B<br />
X<br />
A<br />
Star<br />
(Not drawn to scale)<br />
49 As planet A moves in orbit from its current location to position X, planet B most likely moves in orbit from<br />
its current location to position<br />
(1) 1 (3) 3<br />
(2) 2 (4) 4<br />
50 If the diagram represents our solar system and planet B is Venus, which planet is represented by planet A?<br />
(1) Mercury (3) <strong>Earth</strong><br />
(2) Jupiter (4) Mars<br />
P.S./E. Sci.–<strong>June</strong> ’12 [16]
Part B–2<br />
Answer all questions in this part.<br />
Directions (51–65): Record your answers in the spaces provided in your answer booklet. Some questions<br />
may require the use of the 2011 Edition Reference Tables for Physical Setting/<strong>Earth</strong> <strong>Science</strong>.<br />
Base your answers to questions 51 through 53 on the magnified views shown below of the minerals found<br />
in an igneous rock and in a metamorphic rock. The millimeter scale indicates the size of the crystals shown in<br />
the magnified views.<br />
Igneous Rock<br />
Metamorphic Rock<br />
Scale<br />
0 2 4 mm<br />
Amphibole<br />
Biotite<br />
Key<br />
Plagioclase feldspar<br />
Potassium feldspar<br />
Quartz<br />
51 Identify the environment of formation of this igneous rock based on the size of its intergrown crystals. [1]<br />
52 Based on the minerals present, identify the relative color and density of this igneous rock compared to<br />
mafic igneous rocks with the same crystal size. [1]<br />
53 Describe the texture shown by this metamorphic rock that indicates it could be schist. [1]<br />
P.S./E. Sci.–<strong>June</strong> ’12 [17] [OVER]
Base your answers to questions 54 through 58 on the passage below.<br />
Dinosaur Skull Offers Hints About Africa’s Past<br />
A fossil skull was found in Africa among many dinosaur bones from the Late<br />
Cretaceous Epoch. This skull came from a dinosaur named Rugops primus, or “first<br />
wrinkle face.” This meat eater, believed to have been about 30 feet long and to have<br />
lived 95 million years ago, belonged to a group of dinosaurs called abelisaurids.<br />
This fossil skull, unearthed in the Sahara Desert in 2000, provides new evidence<br />
that Africa split from other southern continents at a later time than previously thought.<br />
Before this discovery, abelisaurids from that period had been found only in South<br />
America, Madagascar, and India, but not in Africa. This new fossil, Rugops primus,<br />
found only in Africa, indicates that Africa was still connected to the other southern<br />
landmasses, at least by a land bridge, 100 million years ago.<br />
54 During which geologic era is Rugops primus inferred to have lived? [1]<br />
55 What evidence suggests that Africa was still attached to South America 100 million years ago? [1]<br />
56 <strong>State</strong> the type of rock in which Rugops primus was most likely preserved. [1]<br />
57 Rugops primus is not a good index fossil. Describe one characteristic of a good index fossil. [1]<br />
58 Identify the type of tectonic plate movement that caused Africa to separate from South America. [1]<br />
P.S./E. Sci.–<strong>June</strong> ’12 [18]
Base your answers to questions 59 through 61 on the map in your answer booklet, which represents two<br />
bridges that cross the Green River. Letters A, B, and C represent locations in the river. A ball was dropped from<br />
bridge 1 at location A and the distance and travel time to location B were recorded. The results are shown in<br />
the data table below.<br />
Distance (cm)<br />
Travel from A to B<br />
Time (s)<br />
12,000 240<br />
59 On the map in your answer booklet, place an X at the location between the bridges where the greatest<br />
amount of deposition is most likely occurring. [1]<br />
60 Determine the rate at which the ball traveled, in centimeters per second, from location A to location B. [1]<br />
61 After a thunderstorm, the velocity of the river at location C was 100 centimeters per second. What was the<br />
largest type of sediment transported by the river at this location? [1]<br />
P.S./E. Sci.–<strong>June</strong> ’12 [19] [OVER]
1041 mi/h<br />
Base your answers to questions 62 through 65 on the diagram below. The diagram represents daytime and<br />
nighttime on <strong>Earth</strong>. Point X is a location on <strong>Earth</strong>’s surface. <strong>Earth</strong>’s rotational surface velocity is shown in miles<br />
per hour (mi/h) at specific latitudes.<br />
0 mi/h<br />
416 mi/h<br />
955 mi/h<br />
0 mi/h<br />
62 What is <strong>Earth</strong>’s rotational surface velocity, in miles per hour, at 23.5° south latitude? [1]<br />
63 Record, to the nearest hour, the duration of insolation at location X for one <strong>Earth</strong> rotation. [1]<br />
64 On the grid in your answer booklet, draw a line to show the general relationship between distance from the<br />
equator and <strong>Earth</strong>’s rotational surface velocity. [1]<br />
65 Identify the Northern Hemisphere season that is just beginning when <strong>Earth</strong> is at the position represented<br />
in this diagram. [1]<br />
P.S./E. Sci.–<strong>June</strong> ’12 [20]
Part C<br />
Answer all questions in this part.<br />
Directions (66–85): Record your answers in the spaces provided in your answer booklet. Some questions<br />
may require the use of the 2011 Edition Reference Tables for Physical Setting/<strong>Earth</strong> <strong>Science</strong>.<br />
Base your answers to questions 66 and 67 on the world map below. Points A through H represent locations<br />
on <strong>Earth</strong>’s surface.<br />
North<br />
America<br />
Europe<br />
E<br />
Asia<br />
Hawaiian<br />
Islands<br />
A<br />
Atlantic<br />
Ocean<br />
D<br />
Africa<br />
F<br />
G<br />
Pacific Ocean<br />
South<br />
America<br />
B<br />
C<br />
Indian<br />
Ocean<br />
Australia<br />
H<br />
Antarctica<br />
66 Identify the two lettered locations from the map that are least likely to experience volcanic activity or<br />
earthquakes. [1]<br />
67 Identify the tectonic feature responsible for the formation of the Hawaiian Islands. [1]<br />
P.S./E. Sci.–<strong>June</strong> ’12 [21] [OVER]
Base your answers to questions 68 and 69 on the data table below and on the partial weather station model<br />
for Oklahoma City, Oklahoma, in your answer booklet.<br />
Visibility<br />
7 miles<br />
Dewpoint 48°F<br />
Wind Direction<br />
Wind Speed<br />
Data Table<br />
from the south<br />
25 knots<br />
68 On the partial weather station model for Oklahoma City in your answer booklet, add the correct weather<br />
map symbols to indicate the weather conditions shown in the data table. [1]<br />
69 <strong>State</strong> the actual barometric pressure at Oklahoma City. [1]<br />
P.S./E. Sci.–<strong>June</strong> ’12 [22]
Base your answers to questions 70 through 72 on the geologic cross section below, which represents a portion<br />
of <strong>Earth</strong>’s crust. Some rock units contain index fossils. Box A indicates a missing portion of the cross section.<br />
Fossils of large<br />
carnivorous mammals<br />
A<br />
x x x x x x x x x x x x x<br />
Fossils of earliest grasses<br />
x x x<br />
Key<br />
Volcanic ash<br />
Meteor impact<br />
debris<br />
Basaltic intrusion<br />
70 In the box that represents box A on the cross section in your answer booklet, draw both the volcanic ash<br />
layer and the basaltic intrusion to clearly show their relative age. [1]<br />
71 Describe one piece of evidence which indicates that the horizontal rock layers are younger than the tilted<br />
rock layers. [1]<br />
72 The meteor impact debris was deposited at the time trilobites became extinct. <strong>State</strong> the age, in million<br />
years, of this debris layer. [1]<br />
P.S./E. Sci.–<strong>June</strong> ’12 [23] [OVER]
Base your answers to questions 73 and 74 on the map in your answer booklet, which represents the center<br />
of a low-pressure system indicated by L. The 1000-millibar (mb) isobar is drawn around the center of this<br />
low-pressure system.<br />
73 On the map in your answer booklet, draw two additional isobars around the outside of the 1000-mb isobar<br />
in a way that indicates that the strongest winds are west of the low-pressure center. [1]<br />
74 Identify one factor that usually causes many low-pressure centers to generally move from west to east across<br />
the United <strong>State</strong>s. [1]<br />
P.S./E. Sci.–<strong>June</strong> ’12 [24]
Base your answers to questions 75 and 76 on the map below, which represents the geographic source regions<br />
of two air masses, X and Y. The arrows represent the convergence of these air masses, which may result in<br />
tornadoes.<br />
North America<br />
X<br />
Pacific<br />
Ocean<br />
Tornado<br />
Alley<br />
Y<br />
Atlantic<br />
Ocean<br />
75 Use the standard two-letter air-mass symbols to identify air-masses X and Y. [1]<br />
76 A tornado watch or warning is issued for a location in the area labeled Tornado Alley. <strong>State</strong> one safety<br />
precaution that should be taken to avoid possible injury from this tornado. [1]<br />
P.S./E. Sci.–<strong>June</strong> ’12 [25] [OVER]
Base your answers to questions 77 through 82 on the calendar and data table below. The calendar shows the<br />
month of February 2007, indicating the dates when some lunar phases occurred. February 24 lists only the name<br />
of the Moon phase that occurred on that day. The data table shows the highest and lowest tides (in feet) recorded<br />
for the Hudson River at Kingston, <strong>New</strong> <strong>York</strong>, over a 2-day period in February 2007.<br />
February 2007<br />
Sun Mon Tue Wed Thu Fri Sat<br />
1<br />
Full<br />
2 3<br />
Old gibbous<br />
Last quarter<br />
4 5 6 7 8 9 10<br />
11 12 13 14 15 16 17<br />
<strong>New</strong><br />
First<br />
quarter<br />
<strong>New</strong> crescent<br />
18 19 20 21 22 23 24<br />
25 26 27 28<br />
High and Low Tides for Kingston, <strong>New</strong> <strong>York</strong><br />
Date Time of Day Tide Height (ft)<br />
Friday,<br />
February 2<br />
Saturday,<br />
February 3<br />
1:30 a.m. 3.5<br />
7:30 a.m. –0.2<br />
1:30 p.m. 4.1<br />
8:00 p.m. –0.4<br />
2:00 a.m. 3.6<br />
8:30 a.m. –0.2<br />
2:00 p.m. 4.0<br />
9:00 p.m. –0.4<br />
P.S./E. Sci.–<strong>June</strong> ’12 [26]
77 On the grid in your answer booklet, plot the tide height for each time of day listed in the data table. Connect<br />
the plots with a line. [1]<br />
78 Predict the time of the first high tide on Sunday, February 4. Include a.m. or p.m. in your answer. [1]<br />
79 On the diagram in your answer booklet, draw a small circle (O) on the Moon’s orbit to show the position of<br />
the Moon in its orbit on February 2. [1]<br />
80 <strong>State</strong> the date of the next full Moon that occurred after February 2. [1]<br />
81 In the circle in your answer booklet, shade the part of the Moon that appeared dark to an observer in <strong>New</strong><br />
<strong>York</strong> <strong>State</strong> on February 24. [1]<br />
82 Determine the altitude of Polaris at Kingston, <strong>New</strong> <strong>York</strong>, to the nearest degree. [1]<br />
Base your answers to questions 83 through 85 on the passage below.<br />
Mount Manaro Erupts!<br />
Mount Manaro is a volcano on Ambae Island, about 1400 miles northeast of<br />
Australia. Ambae Island is located in the South Pacific Ocean at 15° south latitude,<br />
168° east longitude.<br />
After Mount Manaro had erupted in 1995, Ambae Island residents developed an<br />
evacuation plan. When Mount Manaro began erupting gas, steam, and ash on<br />
November 27, 2005, scientists and residents watched the volcano carefully.<br />
The eruption became more severe on December 9, 2005, when steam and gases<br />
rose 1.8 miles up into the air. Rocks and ash began to fall on nearby farms and homes.<br />
Thousands of people left their homes, making it the largest evacuation ever on Ambae<br />
Island.<br />
83 Name the highest layer of the atmosphere into which the steam from the volcanic eruption rose on<br />
December 9, 2005. [1]<br />
84 Identify the ocean current off the northeast coast of Australia that most affects the climate of Ambae Island. [1]<br />
85 On the diagram in your answer booklet, draw one arrow through point X and one arrow through point Y<br />
to indicate the direction of tectonic plate motion near Mount Manaro. [1]<br />
P.S./E. Sci.–<strong>June</strong> ’12 [27]
Part B–2<br />
Allow a maximum of 15 credits for this part.<br />
51 [1] Allow 1 credit. Acceptable responses include, but are not limited to:<br />
— intrusive<br />
— plutonic<br />
— underground<br />
52 [1] Allow 1 credit if both the color and density are correct. Acceptable responses include, but are not<br />
limited to:<br />
Color:<br />
— lighter<br />
— whiter<br />
— pinker<br />
Density:<br />
— lower<br />
— less dense<br />
53 [1] Allow 1 credit. Acceptable responses include, but are not limited to:<br />
— foliated<br />
— mineral alignment<br />
— flattened crystals<br />
P.S./E. Sci. Rating Guide–<strong>June</strong> ’12 [3]
54 [1] Allow 1 credit for Mesozoic Era.<br />
55 [1] Allow 1 credit. Acceptable responses include, but are not limited to:<br />
— Similar fossil remains are found in Africa and South America.<br />
— The fossil Rugops primus, found in Africa, is related to abelisaurids found in South America<br />
and India.<br />
— fossil evidence<br />
56 [1] Allow 1 credit for sedimentary rock or any specific sedimentary rock, such as shale.<br />
57 [1] Allow 1 credit. Acceptable responses include, but are not limited to:<br />
— wide geographic distribution or widespread<br />
— lived a short period of geologic time or short lived<br />
— easily recognizable<br />
58 [1] Allow 1 credit. Acceptable responses include, but are not limited to:<br />
— divergence<br />
— rifting<br />
— seafloor spreading<br />
P.S./E. Sci. Rating Guide–<strong>June</strong> ’12 [4]
59 [1] Allow 1 credit if the center of the X is located within the area indicated below.<br />
Note: It is recommended that an overlay of the same scale as the student answer booklet be used<br />
to ensure reliability in rating.<br />
Bridge 1<br />
A<br />
Correct<br />
response<br />
area<br />
B<br />
Bridge 2<br />
Green River<br />
C<br />
60 [1] Allow 1 credit for 50 cm/s.<br />
61 [1] Allow 1 credit. Acceptable responses include, but are not limited to:<br />
— pebbles<br />
— 2-cm to 3-cm-diameter particles<br />
P.S./E. Sci. Rating Guide–<strong>June</strong> ’12 [5]
62 [1] Allow 1 credit for 955 mi/h.<br />
63 [1] Allow 1 credit for 12 h.<br />
64 [1] Allow 1 credit for a graph that shows an inverse relationship.<br />
Examples of 1-credit graphs:<br />
<strong>Earth</strong>’s Rotational<br />
Surface Velocity<br />
<strong>Earth</strong>’s Rotational<br />
Surface Velocity<br />
Distance from the Equator<br />
Distance from the Equator<br />
65 [1] Allow 1 credit for summer.<br />
P.S./E. Sci. Rating Guide–<strong>June</strong> ’12 [6]
Part C<br />
Allow a maximum of 20 credits for this part.<br />
66 [1] Allow 1 credit for C and E.<br />
67 [1] Allow 1 credit. Acceptable responses include, but are not limited to:<br />
— Hawaii Hot Spot<br />
— mantle hot spot<br />
— volcano<br />
— a rising magma plume<br />
68 [1] Allow 1 credit if all four weather variables from the data table are correctly recorded in the<br />
proper format. Allow credit if feathers are drawn on either side of the staff.<br />
Example of a 1-credit response:<br />
7<br />
62 134<br />
48<br />
69 [1] Allow 1 credit for 1013.4 mb.<br />
P.S./E. Sci. Rating Guide–<strong>June</strong> ’12 [7]
70 [1] Allow 1 credit for a response showing the basaltic intrusion cutting through the ash layer.<br />
Example of a 1-credit response:<br />
x x x x x x x x x x<br />
x x x<br />
71 [1] Allow 1 credit. Acceptable responses include, but are not limited to:<br />
— The horizontal rocks are on top of the tilted layers.<br />
— Fossils of the earliest grasses and large carnivorous mammals are more recent than<br />
Manticoceras and Ctenocrinus.<br />
— The fossils in the tilted layers are older.<br />
72 [1] Allow 1 credit for 251 million years.<br />
P.S./E. Sci. Rating Guide–<strong>June</strong> ’12 [8]
73 [1] Allow 1 credit for correctly drawing the two isobars. The isobars should be closer together on the<br />
western side. If additional isobars are drawn, all must be correct to receive credit.<br />
Example of a 1-credit response:<br />
L<br />
1000<br />
N<br />
74 [1] Allow 1 credit. Acceptable responses include, but are not limited to:<br />
— the prevailing southwest winds<br />
— the jet stream<br />
— planetary winds<br />
75 [1] Allow 1 credit for a correct response for both air-mass symbols. Allow credit even if all uppercase<br />
letters are used.<br />
— Air-mass X: cP or cA<br />
— Air-mass Y: mT<br />
Note: Do not allow credit if the letters are reversed, such as Pc.<br />
76 [1] Allow 1 credit. Acceptable responses include, but are not limited to:<br />
— go to the basement<br />
— stay away from windows<br />
— listen to emergency warnings broadcast on radio or TV<br />
— go to a community emergency shelter<br />
P.S./E. Sci. Rating Guide–<strong>June</strong> ’12 [9]
77 [1] Allow 1 credit if the centers of all eight plots are located within the circles shown below and are<br />
connected with a line that passes within each circle.<br />
Note: It is recommended that an overlay of the same scale as the student answer booklet be used<br />
to ensure reliability in rating.<br />
5<br />
High and Low Tides<br />
4<br />
3<br />
Tide Height (ft)<br />
2<br />
1<br />
0<br />
–1<br />
12 6 a.m. 12<br />
midnight noon<br />
6 p.m. 12 6 a.m. 12<br />
midnight noon<br />
Friday, Feb 2 Saturday, Feb 3<br />
Time of Day<br />
6 p.m. 12<br />
midnight<br />
78 [1] Allow 1 credit for any time from 2 a.m. to 4 a.m.<br />
P.S./E. Sci. Rating Guide–<strong>June</strong> ’12 [10]
79 [1] Allow 1 credit if the center of the student-drawn circle is within the brackets shown below.<br />
Moon’s orbit<br />
Sun’s<br />
rays<br />
North<br />
Pole<br />
<strong>Earth</strong><br />
(Not drawn to scale)<br />
80 [1] Allow 1 credit for March 3 or March 4.<br />
81 [1] Allow 1 credit for shading half of the circle on the left side.<br />
Examples of 1-credit responses:<br />
82 [1] Allow 1 credit for 42°.<br />
P.S./E. Sci. Rating Guide–<strong>June</strong> ’12 [11]
83 [1] Allow 1 credit for troposphere.<br />
84 [1] Allow 1 credit. Acceptable responses include, but are not limited to:<br />
— East Australia Current<br />
— South Equatorial Current<br />
— E. Australia C.<br />
85 [1] Allow 1 credit if both arrows show the correct directions, even if the arrows do not pass through<br />
the dots.<br />
Example of a 1-credit response:<br />
Mount<br />
Manaro<br />
Australia<br />
Trench<br />
Ambae<br />
Island<br />
Indian-Australian Plate<br />
X<br />
Y<br />
Fiji Plate<br />
(Not drawn to scale)<br />
P.S./E. Sci. Rating Guide–<strong>June</strong> ’12 [12]