1 Students will chart the temperatures of two cities at approximately ...
1 Students will chart the temperatures of two cities at approximately ...
1 Students will chart the temperatures of two cities at approximately ...

Create successful ePaper yourself
Turn your PDF publications into a flip-book with our unique Google optimized e-Paper software.
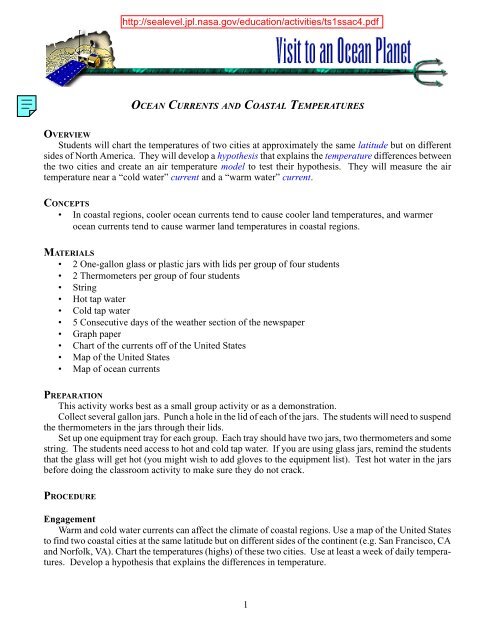
OCEAN CURRENTS AND COASTAL TEMPERATURES<br />
OVERVIEW<br />
<strong>Students</strong> <strong>will</strong> <strong>chart</strong> <strong>the</strong> <strong>temper<strong>at</strong>ures</strong> <strong>of</strong> <strong>two</strong> <strong>cities</strong> <strong>at</strong> approxim<strong>at</strong>ely <strong>the</strong> same l<strong>at</strong>itude but on different<br />
sides <strong>of</strong> North America. They <strong>will</strong> develop a hypo<strong>the</strong>sis th<strong>at</strong> explains <strong>the</strong> temper<strong>at</strong>ure differences between<br />
<strong>the</strong> <strong>two</strong> <strong>cities</strong> and cre<strong>at</strong>e an air temper<strong>at</strong>ure model to test <strong>the</strong>ir hypo<strong>the</strong>sis. They <strong>will</strong> measure <strong>the</strong> air<br />
temper<strong>at</strong>ure near a “cold w<strong>at</strong>er” current and a “warm w<strong>at</strong>er” current.<br />
CONCEPTS<br />
• In coastal regions, cooler ocean currents tend to cause cooler land <strong>temper<strong>at</strong>ures</strong>, and warmer<br />
ocean currents tend to cause warmer land <strong>temper<strong>at</strong>ures</strong> in coastal regions.<br />
MATERIALS<br />
• 2 One-gallon glass or plastic jars with lids per group <strong>of</strong> four students<br />
• 2 Thermometers per group <strong>of</strong> four students<br />
• String<br />
• Hot tap w<strong>at</strong>er<br />
• Cold tap w<strong>at</strong>er<br />
• 5 Consecutive days <strong>of</strong> <strong>the</strong> wea<strong>the</strong>r section <strong>of</strong> <strong>the</strong> newspaper<br />
• Graph paper<br />
• Chart <strong>of</strong> <strong>the</strong> currents <strong>of</strong>f <strong>of</strong> <strong>the</strong> United St<strong>at</strong>es<br />
• Map <strong>of</strong> <strong>the</strong> United St<strong>at</strong>es<br />
• Map <strong>of</strong> ocean currents<br />
PREPARATION<br />
This activity works best as a small group activity or as a demonstr<strong>at</strong>ion.<br />
Collect several gallon jars. Punch a hole in <strong>the</strong> lid <strong>of</strong> each <strong>of</strong> <strong>the</strong> jars. The students <strong>will</strong> need to suspend<br />
<strong>the</strong> <strong>the</strong>rmometers in <strong>the</strong> jars through <strong>the</strong>ir lids.<br />
Set up one equipment tray for each group. Each tray should have <strong>two</strong> jars, <strong>two</strong> <strong>the</strong>rmometers and some<br />
string. The students need access to hot and cold tap w<strong>at</strong>er. If you are using glass jars, remind <strong>the</strong> students<br />
th<strong>at</strong> <strong>the</strong> glass <strong>will</strong> get hot (you might wish to add gloves to <strong>the</strong> equipment list). Test hot w<strong>at</strong>er in <strong>the</strong> jars<br />
before doing <strong>the</strong> classroom activity to make sure <strong>the</strong>y do not crack.<br />
PROCEDURE<br />
Engagement<br />
Warm and cold w<strong>at</strong>er currents can affect <strong>the</strong> clim<strong>at</strong>e <strong>of</strong> coastal regions. Use a map <strong>of</strong> <strong>the</strong> United St<strong>at</strong>es<br />
to find <strong>two</strong> coastal <strong>cities</strong> <strong>at</strong> <strong>the</strong> same l<strong>at</strong>itude but on different sides <strong>of</strong> <strong>the</strong> continent (e.g. San Francisco, CA<br />
and Norfolk, VA). Chart <strong>the</strong> <strong>temper<strong>at</strong>ures</strong> (highs) <strong>of</strong> <strong>the</strong>se <strong>two</strong> <strong>cities</strong>. Use <strong>at</strong> least a week <strong>of</strong> daily <strong>temper<strong>at</strong>ures</strong>.<br />
Develop a hypo<strong>the</strong>sis th<strong>at</strong> explains <strong>the</strong> differences in temper<strong>at</strong>ure.<br />
1
Activity<br />
1. Suspend a <strong>the</strong>rmometer through <strong>the</strong> hole in <strong>the</strong> lid <strong>of</strong> each jar. Do not add w<strong>at</strong>er yet.<br />
2. Set <strong>the</strong> jars next to each o<strong>the</strong>r and measure <strong>the</strong> temper<strong>at</strong>ure <strong>of</strong> <strong>the</strong> air inside each jar. Plot <strong>the</strong> temper<strong>at</strong>ure<br />
versus time on graph paper. Take measurements until <strong>the</strong> temper<strong>at</strong>ure in both jars is about equal.<br />
3. Fill one jar half-full with warm w<strong>at</strong>er and one jar half-full with cold w<strong>at</strong>er. Wait five minutes and take<br />
<strong>the</strong> temper<strong>at</strong>ure <strong>of</strong> air above <strong>the</strong> w<strong>at</strong>er in each jar. Repe<strong>at</strong> after five additional minutes. Is <strong>the</strong> temper<strong>at</strong>ure<br />
<strong>of</strong> <strong>the</strong> air changing? Why?<br />
4. Loc<strong>at</strong>e your <strong>two</strong> <strong>cities</strong> on <strong>the</strong> map <strong>of</strong> United St<strong>at</strong>es. Also look <strong>at</strong> <strong>the</strong> <strong>chart</strong> <strong>of</strong> currents. Use <strong>the</strong> inform<strong>at</strong>ion<br />
on <strong>the</strong> current <strong>chart</strong> and from your model to determine if <strong>the</strong>re is a warm or a cool w<strong>at</strong>er current<br />
flowing <strong>of</strong>f each coast. Compare this new inform<strong>at</strong>ion to <strong>the</strong> hypo<strong>the</strong>sis th<strong>at</strong> you originally developed.<br />
Was your original hypo<strong>the</strong>sis correct? If not, develop a new hypo<strong>the</strong>sis to explain why <strong>the</strong>se <strong>two</strong> <strong>cities</strong><br />
<strong>at</strong> <strong>the</strong> same l<strong>at</strong>itude, which receive similar amounts <strong>of</strong> solar radi<strong>at</strong>ion, have such different <strong>temper<strong>at</strong>ures</strong>.<br />
Explan<strong>at</strong>ion<br />
Warm and cold ocean currents can affect <strong>the</strong> clim<strong>at</strong>e <strong>of</strong> coastal regions, but only when local winds<br />
blow in from <strong>the</strong> sea. Warm currents he<strong>at</strong> <strong>the</strong> air over <strong>the</strong> ocean and bring higher <strong>temper<strong>at</strong>ures</strong> over land.<br />
Cold currents can lower air <strong>temper<strong>at</strong>ures</strong> and can bring colder <strong>temper<strong>at</strong>ures</strong> over land.<br />
Because <strong>the</strong> current th<strong>at</strong> runs along <strong>the</strong> California coastline runs from north to south, it carries cool<br />
w<strong>at</strong>er. Thus <strong>the</strong> temper<strong>at</strong>ure <strong>of</strong> California’s coastal <strong>cities</strong> is rel<strong>at</strong>ively cool. On <strong>the</strong> eastern side <strong>of</strong> <strong>the</strong><br />
United St<strong>at</strong>es, <strong>the</strong> Gulf Stream brings warm w<strong>at</strong>er north from equ<strong>at</strong>orial regions to about Cape H<strong>at</strong>teras,<br />
North Carolina. Thus, <strong>the</strong> U.S. sou<strong>the</strong>astern coastal <strong>cities</strong> generally have warmer clim<strong>at</strong>es than western<br />
coastal <strong>cities</strong> <strong>at</strong> th<strong>at</strong> same l<strong>at</strong>itude.<br />
EXTENSION<br />
To test <strong>the</strong> understanding <strong>of</strong> <strong>the</strong> students, give <strong>the</strong>m <strong>the</strong> global temper<strong>at</strong>ure section <strong>of</strong> <strong>the</strong> newspaper.<br />
Have <strong>the</strong>m find pairs <strong>of</strong> coastal <strong>cities</strong> <strong>at</strong> about <strong>the</strong> same l<strong>at</strong>itude but on opposite sides <strong>of</strong> <strong>the</strong> same continent<br />
(not necessarily North America). See if <strong>the</strong>y can determine if <strong>the</strong> current <strong>of</strong>f each coastline is a warm or a<br />
cold w<strong>at</strong>er current.<br />
Altern<strong>at</strong>ively, have your students look <strong>at</strong> <strong>the</strong> map th<strong>at</strong> shows warm and cold currents [Fig. 1]. They can<br />
use this to try to predict <strong>the</strong> clim<strong>at</strong>e <strong>of</strong> coastal areas throughout <strong>the</strong> world. Have <strong>the</strong>m compare <strong>the</strong>ir<br />
predictions to wea<strong>the</strong>r and clim<strong>at</strong>e d<strong>at</strong>a from newspaper, <strong>the</strong> Internet, or an almanac.<br />
LINKS TO RELATED CD ACTIVITIES, IMAGES, AND MOVIES<br />
Map <strong>of</strong> Wind-driven surface currents<br />
Image <strong>of</strong> Seasonal vari<strong>at</strong>ions in similar l<strong>at</strong>itude <strong>cities</strong><br />
Anim<strong>at</strong>ion <strong>of</strong> Offshore/Onshore Winds<br />
Activity Coastal versus Inland Temper<strong>at</strong>ures<br />
VOCABULARY<br />
current hypo<strong>the</strong>sis l<strong>at</strong>itude<br />
model<br />
temper<strong>at</strong>ure<br />
SOURCE<br />
Orange County Marine Institute<br />
2
3<br />
Figure 1. Wind-driven surface currents