Antioch CHS Report Card - Community High School District 117
Antioch CHS Report Card - Community High School District 117
Antioch CHS Report Card - Community High School District 117

You also want an ePaper? Increase the reach of your titles
YUMPU automatically turns print PDFs into web optimized ePapers that Google loves.
34-049-<strong>117</strong>0-16-0001<br />
<strong>Antioch</strong> Comm <strong>High</strong> <strong>School</strong><br />
<strong>CHS</strong>D <strong>117</strong><br />
<strong>Antioch</strong>, ILLINOIS<br />
GRADES : 9 10 11 12<br />
<strong>Antioch</strong> Comm <strong>High</strong> <strong>School</strong> 1<br />
2<br />
0<br />
1<br />
2<br />
ILLINOIS<br />
SCHOOL<br />
REPORT<br />
CARD<br />
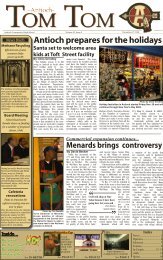
State and federal laws require public school districts to release report cards to the public each year.<br />
Starting in 2009, charter school information is included in district statistics.<br />
STUDENTS<br />
RACIAL/ETHNIC BACKGROUND AND OTHER INFORMATION<br />
White Black Hispanic Asian<br />
Native<br />
Hawaiian<br />
/Pacific American<br />
Islander Indian<br />
Two or<br />
More<br />
Races<br />
Percent<br />
Low-<br />
Income<br />
Percent<br />
Limited-<br />
English-<br />
Proficient<br />
Percent<br />
IEP<br />
<strong>High</strong><br />
Sch.<br />
Dropout<br />
Rate<br />
Chronic<br />
Truancy<br />
Rate<br />
Mobility<br />
Rate<br />
Attendance<br />
Rate<br />
Total<br />
Enrollment<br />
<strong>School</strong><br />
<strong>District</strong><br />
State<br />
84.4<br />
83.7<br />
51.0<br />
0.4<br />
2.8<br />
18.0<br />
9.1<br />
8.6<br />
23.6<br />
2.2<br />
2.0<br />
4.2<br />
0.2<br />
0.1<br />
0.1<br />
0.1<br />
0.2<br />
0.3<br />
3.6<br />
2.7<br />
2.8<br />
23.6<br />
17.8<br />
49.0<br />
0.0<br />
0.0<br />
9.4<br />
15.2<br />
13.3<br />
13.6<br />
1.7<br />
1.2<br />
2.5<br />
1.5<br />
1.2<br />
8.6<br />
5.9<br />
5.3<br />
13.1<br />
94.3<br />
94.5<br />
94.4<br />
1,371<br />
2,822<br />
2,066,692<br />
Low-income students come from families receiving public aid; live in<br />
institutions for neglected or delinquent children; are supported in foster homes<br />
with public funds; or are eligible to receive free or reduced-price lunches.<br />
IEP Students are those students eligible to receive special education services.<br />
Limited-English-proficient students are those students eligible for transitional bilingual programs.<br />
Mobility rate is based on the number of times students enroll in or leave a school during the school year.<br />
Chronic truants are students who are absent from school without valid cause for 18 or more of the last 180<br />
school days.<br />
Total Enrollment is based on Home <strong>School</strong>.<br />
INSTRUCTIONAL SETTING<br />
PARENTAL CONTACT*<br />
Percent<br />
STUDENT-TO-STAFF RATIOS<br />
Pupil-<br />
Pupil-<br />
Teacher Teacher<br />
Elementary Secondary<br />
Pupil-<br />
Certified<br />
Staff<br />
Pupil-<br />
Administrator<br />
<strong>School</strong><br />
<strong>District</strong><br />
State<br />
99.7<br />
99.8<br />
95.3<br />
--<br />
--<br />
19.5<br />
18.8<br />
--<br />
13.0<br />
13.7<br />
--<br />
122.2<br />
205.0<br />
* Parental contact includes parent-teacher conferences, parental visits to school, school visits to home, telephone conversations, and written correspondence.<br />
AVERAGE CLASS SIZE (as of the first school day in May)<br />
Grades<br />
<strong>School</strong><br />
<strong>District</strong><br />
State<br />
K<br />
1 2 3 4 5 6 7 8 9 - 12<br />
22.3<br />
23.2<br />
19.2<br />
TEACHER INFORMATION (Full-Time Equivalents)<br />
<strong>District</strong><br />
State<br />
White<br />
Black<br />
Hispanic<br />
Asian<br />
Native<br />
Hawaiian/<br />
Pacific<br />
islander<br />
American<br />
Indian<br />
Two or<br />
More<br />
Races<br />
Unknown<br />
Male<br />
Female<br />
Total<br />
Number<br />
95.1 1.7 0.9 1.1 0.0 0.6 0.0 0.6<br />
43.2 56.8 174<br />
83.3 7.1 5.3 1.3 0.1 0.2 0.8 2.0<br />
23.1 76.9 127,830
34-049-<strong>117</strong>0-16-0001<br />
<strong>Antioch</strong> Comm <strong>High</strong> <strong>School</strong> 2<br />
TEACHER INFORMATION ( Continued )<br />
Average<br />
Teaching<br />
Experience<br />
(Years)<br />
% of<br />
Teachers<br />
with<br />
Bachelor's<br />
Degrees<br />
% of<br />
Teachers<br />
with<br />
Master's<br />
& Above<br />
% of<br />
Teachers with<br />
Emergency or<br />
Provisional<br />
Credentials<br />
% of<br />
Classes Not<br />
Taught by<br />
<strong>High</strong>ly Qualified<br />
Teachers<br />
<strong>School</strong> -- -- --<br />
0.0 0.0<br />
<strong>District</strong><br />
11.3 27.1 72.9 0.6 0.0<br />
State<br />
12.9 37.8 61.7 0.6 0.7<br />
Some teacher/administrator data are not collected at the school level.<br />
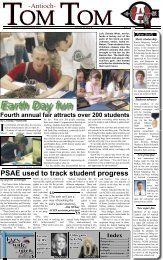
SCHOOL DISTRICT FINANCES<br />
TEACHER/ADMINISTRATOR SALARIES (Full-Time Equivalents)<br />
$200,000<br />
$160,000<br />
$120,000<br />
$108,026 $110,870<br />
Salaries and counts of staff are summed<br />
across a district based on the percentage of<br />
time that each individual is employed as a<br />
teacher or an administrator and may or may<br />
not reflect the actual paid salaries for the<br />
district.<br />
$80,000<br />
$65,527 $66,614<br />
<strong>District</strong><br />
$40,000<br />
State<br />
$0<br />
Average Teacher Salary<br />
Average Administrator Salary<br />
EXPENDITURE BY FUNCTION 2010-11 (Percentages)<br />
60.0<br />
50.0<br />
48.4 48.3<br />
40.0<br />
30.0<br />
20.0<br />
31.0 30.7<br />
19.1 17.7<br />
<strong>District</strong><br />
State<br />
10.0<br />
0.0<br />
1.5<br />
3.3<br />
Instruction<br />
General<br />
Administration<br />
Supporting<br />
Services<br />
Other<br />
Expenditures
34-049-<strong>117</strong>0-16-0001<br />
<strong>Antioch</strong> Comm <strong>High</strong> <strong>School</strong> 3<br />
REVENUE BY SOURCE 2010-11<br />
<strong>District</strong><br />
<strong>District</strong> %<br />
State %<br />
EXPENDITURE BY FUND 2010-11<br />
<strong>District</strong><br />
<strong>District</strong> %<br />
State %<br />
Local Property Taxes<br />
Other Local Funding<br />
General State Aid<br />
Other State Funding<br />
Federal Funding<br />
$36,160,401<br />
$4,870,567<br />
$1,750,085<br />
$5,217,187<br />
$868,818<br />
74.0<br />
10.0<br />
3.6<br />
10.7<br />
1.8<br />
58.2<br />
5.1<br />
17.1<br />
9.5<br />
10.1<br />
Education<br />
Operations & Maintenance<br />
Transportation<br />
Debt Service<br />
Tort<br />
Municipal Retirement/<br />
Social Security<br />
Fire Prevention & Safety<br />
Capital Projects<br />
$29,231,629<br />
$3,961,194<br />
$2,764,145<br />
$6,808,003<br />
$184,500<br />
$773,939<br />
$0<br />
$0<br />
66.9<br />
9.1<br />
6.3<br />
15.6<br />
0.4<br />
1.8<br />
0.0<br />
0.0<br />
73.7<br />
5.9<br />
3.8<br />
7.4<br />
1.2<br />
2.0<br />
0.8<br />
5.1<br />
TOTAL<br />
$48,867,058<br />
TOTAL<br />
$43,723,410<br />
OTHER FINANCIAL INDICATORS<br />
2009 Equalized<br />
Assessed Valuation<br />
per Pupil<br />
<strong>District</strong><br />
State<br />
2009 Total <strong>School</strong><br />
Tax Rate<br />
per $100<br />
$575,973 2.45<br />
** **<br />
2010-11 Instructional<br />
Expenditure<br />
per Pupil<br />
$8,460<br />
$6,824<br />
2010-11 Operating<br />
Expenditure<br />
per Pupil<br />
$15,402<br />
$11,664<br />
** Due to the way Illinois school districts are configured, state averages for equalized assessed valuation per pupil and total school tax rate per $100 are not provided.<br />
Equalized assessed valuation includes all computed property values upon which a district's local tax rate is calculated.<br />
Total school tax rate is a district's total tax rate as it appears on local property tax bills.<br />
Instructional expenditure per pupil includes the direct costs of teaching pupils or the interaction between teachers and pupils.<br />
Operating expenditure per pupil includes the gross operating cost of a school district excluding summer school, adult education, bond principal retired, and capital expenditures.<br />
ACADEMIC PERFORMANCE
34-049-<strong>117</strong>0-16-0001<br />
<strong>Antioch</strong> Comm <strong>High</strong> <strong>School</strong> 4<br />
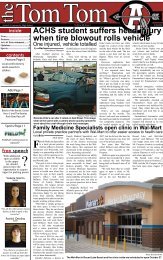
ACT ASSESSMENT: GRADUATING CLASS OF 2012 *<br />
36.0<br />
32.0<br />
28.0<br />
24.0 22.1 22.4 20.6<br />
21.7 22.2 20.1<br />
22.3 22.5 20.9 21.6 21.9 20.5<br />
22.2 22.6 20.6<br />
20.0<br />
16.0<br />
12.0<br />
8.0<br />
4.0<br />
0.0<br />
Composite English Mathematics Reading Science<br />
The number and percent of students taking<br />
the ACT are no longer reported since<br />
virtually every eleventh grade student takes<br />
the ACT as part of the PSAE.<br />
* Includes graduating students' most recent<br />
ACT Assessment scores from an ACT<br />
national test date or PSAE testing. Excludes<br />
the scores of students who took the test with<br />
special accommodations. State averages for<br />
ACT data are based on regular public schools<br />
and do not include private and special<br />
purpose schools.<br />
<strong>School</strong> <strong>District</strong> State<br />
HIGH SCHOOL 4-YEAR GRADUATION RATE<br />
Gender<br />
All Male Female<br />
Race / Ethnicity<br />
White Black Hispanic Asian<br />
Native<br />
Hawaiian/<br />
Pacific<br />
Islander<br />
American<br />
Indian<br />
LEP<br />
Migrant<br />
Students<br />
with<br />
Disabilities<br />
Economically<br />
Disadvantaged<br />
<strong>School</strong> 94.7 92.9 97.0 95.5 100.0 88.2 100.0 80.0<br />
84.3 87.5<br />
<strong>District</strong> 95.3 94.0 96.7 96.2 84.2 90.3 100.0 83.3<br />
86.3 84.7<br />
State 82.3 79.0 85.8 88.9 68.4 76.0 93.0 83.3<br />
68.9 72.8<br />
Two or<br />
More<br />
Races<br />
HIGH SCHOOL 5-YEAR GRADUATION RATE<br />
Gender<br />
Race / Ethnicity<br />
<strong>School</strong><br />
<strong>District</strong><br />
State<br />
All Male Female<br />
93.0<br />
94.0<br />
84.0<br />
92.9<br />
93.2<br />
81.1<br />
93.0<br />
94.8<br />
87.1<br />
White Black Hispanic Asian<br />
93.0<br />
94.2<br />
89.3<br />
100.0<br />
83.3<br />
72.2<br />
91.2<br />
92.6<br />
78.8<br />
83.3<br />
92.3<br />
92.8<br />
Native<br />
Hawaiian/<br />
Pacific<br />
Islander<br />
100.0<br />
100.0<br />
94.5<br />
American<br />
Indian<br />
100.0<br />
100.0<br />
83.7<br />
Two or<br />
More<br />
Races<br />
100.0<br />
100.0<br />
83.9<br />
LEP<br />
Migrant<br />
Students<br />
with<br />
Disabilities<br />
82.1<br />
84.3<br />
72.5<br />
Economically<br />
Disadvantaged<br />
87.5<br />
83.3<br />
76.7<br />
OVERALL STUDENT PERFORMANCE<br />
These charts present the overall percentages of state test scores categorized as meeting or exceeding the Illinois Learning<br />
Standards for your school, district, and the state. They respresent your school's performance in reading, mathematics, and<br />
science.
34-049-<strong>117</strong>0-16-0001<br />
<strong>Antioch</strong> Comm <strong>High</strong> <strong>School</strong> 5<br />
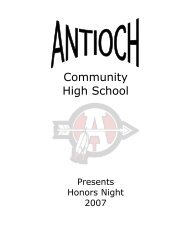
OVERALL PERFORMANCE - ALL STATE TESTS<br />
100<br />
80<br />
76.5 76.7<br />
60<br />
61.5<br />
55.2<br />
64.5<br />
61.1<br />
2010-11<br />
40<br />
2011-12<br />
20<br />
0<br />
<strong>School</strong> <strong>District</strong> State<br />
OVERALL PRAIRIE STATE ACHIEVEMENT EXAMINATION (PSAE) PERFORMANCE<br />
100<br />
80<br />
60<br />
40<br />
61.3<br />
55.2<br />
64.2<br />
61.0<br />
50.5 51.3<br />
2010-11<br />
2011-12<br />
20<br />
0<br />
<strong>School</strong> <strong>District</strong> State<br />
PSAE PERFORMANCE<br />
These charts provide information on attainment of the Illinois Learning Standards. They show the average scores and also the<br />
percents of student scores meeting or exceeding standards in reading, mathematics, and science on PSAE.<br />
PRAIRIE STATE ACHIEVEMENT EXAMINATION (PSAE) - Average Scores<br />
200<br />
180<br />
160<br />
157 154<br />
158 157 156 155<br />
159 157<br />
160 160<br />
156 156<br />
161 161 162 162<br />
157 158<br />
2010-11<br />
2011-12<br />
140<br />
120<br />
<strong>School</strong> <strong>District</strong> State <strong>School</strong> <strong>District</strong> State<br />
<strong>School</strong><br />
<strong>District</strong><br />
State<br />
Reading<br />
Mathematics<br />
Science<br />
PSAE scores range from 120 to 200.
34-049-<strong>117</strong>0-16-0001<br />
<strong>Antioch</strong> Comm <strong>High</strong> <strong>School</strong> 6<br />
PRAIRIE STATE ACHIEVEMENT EXAMINATION (PSAE) - Percents Meeting or Exceeding Standards<br />
100<br />
80<br />
60<br />
59.8<br />
51.2<br />
62.2<br />
55.0<br />
51.0 50.7<br />
61.2<br />
52.7<br />
65.1 62.0<br />
51.3 51.6<br />
62.9 61.7<br />
65.3 66.0<br />
49.2 51.7<br />
2010-11<br />
40<br />
2011-12<br />
20<br />
0<br />
<strong>School</strong> <strong>District</strong> State <strong>School</strong> <strong>District</strong> State<br />
<strong>School</strong><br />
<strong>District</strong><br />
State<br />
Reading<br />
Mathematics<br />
Science<br />
Number of students in this school with PSAE scores in 2012: 334<br />
PERFORMANCE ON STATE ASSESSMENTS<br />
Federal law requires that student achievement results for reading, mathematics, and science for schools providing Title I<br />
services be reported to the general public.<br />
The Illinois Standards Achievement Test (ISAT) is administered to students in grades 3 through 8. The Prairie State<br />
Achievement Examination (PSAE) is administered to students in grade 11. The Illinois Alternate Assessment (IAA) is<br />
administered to students with disabilities whose Individualized Education Programs (IEPs) indicate that participation in the<br />
ISAT or PSAE would not be appropriate.<br />
Students with disabilities have an IEP (No Child Left Behind Act). An IEP is a written plan for a child with a disability who is<br />
eligible to receive special education services under the Individuals with Disabilities Education Act.<br />
Reading and Mathematics are tested in grades 3 through 8 and 11. Science is tested in grades 4, 7, and 11.<br />
In order to protect students' identities, test data for groups of fewer than ten students are not reported.<br />
PERCENTAGE OF STUDENTS NOT TESTED IN STATE TESTING PROGRAMS FOR READING<br />
Gender<br />
Racial/Ethnic Background<br />
All<br />
Male<br />
Female<br />
White<br />
Black<br />
Hispanic<br />
Asian<br />
Native<br />
Hawaiian<br />
/Pacific<br />
islander<br />
American<br />
Indian<br />
Two or<br />
More<br />
Races<br />
LEP<br />
Migrant<br />
Students<br />
with<br />
Disabilities<br />
Economically<br />
Disadvantaged<br />
<strong>School</strong><br />
*Enrollment<br />
Reading<br />
338<br />
0.6<br />
196<br />
0.5<br />
142<br />
0.7<br />
281<br />
0.4<br />
1<br />
37<br />
0.0<br />
6<br />
0<br />
0<br />
13<br />
7.7<br />
1<br />
0<br />
48<br />
2.1<br />
98<br />
2.0<br />
<strong>District</strong><br />
*Enrollment<br />
Reading<br />
703<br />
0.6<br />
391<br />
0.5<br />
312<br />
0.6<br />
591<br />
0.3<br />
17<br />
5.9<br />
61<br />
0.0<br />
13<br />
0.0<br />
0<br />
1<br />
20<br />
5.0<br />
1<br />
0<br />
88<br />
3.4<br />
142<br />
2.1<br />
State<br />
*Enrollment<br />
Reading<br />
1,072,304<br />
0.4<br />
548,690<br />
0.5<br />
523,352<br />
0.3<br />
547,900<br />
0.3<br />
192,977<br />
0.7<br />
251,440<br />
0.4<br />
45,188<br />
0.3<br />
977<br />
0.6<br />
3,177<br />
0.6<br />
29,968<br />
0.4<br />
75,031<br />
0.6<br />
261<br />
2.3<br />
146,113<br />
0.9<br />
531,157<br />
0.5<br />
* Enrollment as reported during the testing windows for grades 3 - 8 and 11.<br />
Number of LEP Students who have attended schools in the U.S. for less than 12 months and are not assessed on the State's reading/language arts test: 0
34-049-<strong>117</strong>0-16-0001<br />
<strong>Antioch</strong> Comm <strong>High</strong> <strong>School</strong> 7<br />
PERCENTAGE OF STUDENTS NOT TESTED IN STATE TESTING PROGRAMS FOR MATHEMATICS<br />
Gender<br />
Racial/Ethnic Background<br />
<strong>School</strong><br />
*Enrollment<br />
Mathematics<br />
All<br />
338<br />
0.6<br />
Male<br />
196<br />
0.5<br />
Female<br />
142<br />
0.7<br />
White<br />
281<br />
0.4<br />
Black<br />
1<br />
Hispanic<br />
37<br />
0.0<br />
Asian<br />
6<br />
Native<br />
Hawaiian<br />
/Pacific<br />
islander<br />
0<br />
American<br />
Indian<br />
Two or<br />
More<br />
Races<br />
0 13<br />
7.7<br />
LEP<br />
1<br />
Migrant<br />
0<br />
Students<br />
with<br />
Disabilities<br />
48<br />
2.1<br />
Economically<br />
Disadvantaged<br />
98<br />
2.0<br />
<strong>District</strong><br />
*Enrollment<br />
Mathematics<br />
703<br />
0.4<br />
391<br />
0.3<br />
312<br />
0.6<br />
591<br />
0.2<br />
17<br />
5.9<br />
61<br />
0.0<br />
13<br />
0.0<br />
0<br />
1<br />
20<br />
5.0<br />
1<br />
0<br />
88<br />
2.3<br />
142<br />
2.1<br />
State<br />
*Enrollment<br />
Mathematics<br />
1,073,764<br />
0.4<br />
549,462<br />
0.4<br />
524,040<br />
0.3<br />
548,234<br />
0.3<br />
193,064<br />
0.7<br />
252,013<br />
0.4<br />
45,638<br />
0.2<br />
983<br />
0.5<br />
3,180 29,975 76,502<br />
0.5 0.4 0.3<br />
271<br />
1.1<br />
146,133<br />
0.9<br />
532,214<br />
0.5<br />
* Enrollment as reported during the testing windows for grades 3 - 8 and 11.<br />
PERCENTAGE OF STUDENTS NOT TESTED IN STATE TESTING PROGRAMS FOR SCIENCE<br />
Gender<br />
Racial/Ethnic Background<br />
All<br />
Male<br />
Female<br />
White<br />
Black<br />
Hispanic<br />
Asian<br />
Native<br />
Hawaiian<br />
/Pacific<br />
islander<br />
American<br />
Indian<br />
Two or<br />
More<br />
Races<br />
LEP<br />
Migrant<br />
Students<br />
with<br />
Disabilities<br />
Economically<br />
Disadvantaged<br />
<strong>School</strong><br />
*Enrollment<br />
Science<br />
338<br />
0.6<br />
196<br />
0.5<br />
142<br />
0.7<br />
281<br />
0.4<br />
1<br />
37<br />
0.0<br />
6<br />
0<br />
0<br />
13<br />
7.7<br />
1<br />
0<br />
48<br />
2.1<br />
98<br />
2.0<br />
<strong>District</strong><br />
*Enrollment<br />
Science<br />
703<br />
0.6<br />
391<br />
0.5<br />
312<br />
0.6<br />
591<br />
0.3<br />
17<br />
5.9<br />
61<br />
0.0<br />
13<br />
0.0<br />
0<br />
1<br />
20<br />
5.0<br />
1<br />
0<br />
88<br />
3.4<br />
142<br />
2.1<br />
State<br />
*Enrollment<br />
Science<br />
456,721<br />
0.7<br />
232,992<br />
0.8<br />
223,651<br />
0.6<br />
237,912<br />
0.5<br />
81,780<br />
1.4<br />
103,594<br />
0.7<br />
19,211<br />
0.3<br />
393<br />
1.0<br />
1,359<br />
0.9<br />
12,254<br />
0.7<br />
25,859<br />
0.8<br />
107<br />
0.9<br />
61,941<br />
1.6<br />
217,988<br />
1.0<br />
* Enrollment as reported during the testing windows for grades 4, 7, and 11.<br />
PRAIRIE STATE ACHIEVEMENT EXAMINATION (PSAE)<br />
The following tables show the percentages of student scores in each of four performance levels. These levels were<br />
established with the help of Illinois educators who teach the grade levels and learning areas tested. Due to rounding, the sum<br />
of the percentages in the four performance levels may not always equal 100.<br />
Level 1 -- Academic Warning -<br />
Level 2 -- Below Standards -<br />
Level 3 -- Meets Standards -<br />
Level 4 -- Exceeds Standards -<br />
Student work demonstrates limited knowledge and skills in the subject. Because of major gaps in learning, students apply<br />
knowledge and skills ineffectively.<br />
Student work demonstrates basic knowledge and skills in the subject. However, because of gaps in learning, students<br />
apply knowledge and skills in limited ways.<br />
Student work demonstrates proficient knowledge and skills in the subject. Students effectively apply knowledge and skills<br />
to solve problems.<br />
Student work demonstrates advanced knowledge and skills in the subject. Students creatively apply knowledge and skills<br />
to solve problems and evaluate the results.
34-049-<strong>117</strong>0-16-0001<br />
<strong>Antioch</strong> Comm <strong>High</strong> <strong>School</strong> 8<br />
Grade 11<br />
Grade 11 - All<br />
Reading<br />
Mathematics<br />
Science<br />
Levels 1 2 3 4<br />
1<br />
2<br />
3<br />
4<br />
1 2 3 4<br />
<strong>School</strong><br />
<strong>District</strong><br />
State<br />
6.3 42.5 45.2 6.0<br />
5.6 39.4 44.7 10.3<br />
9.9 39.4 41.6 9.0<br />
9.9 37.4 42.2 10.5<br />
6.8 31.2 50.4 11.6<br />
10.7 37.7 42.2 9.4<br />
5.7 32.6 49.1 12.6<br />
4.2 29.8 52.2 13.7<br />
8.8 39.6 41.1 10.6<br />
Grade 11 - Gender<br />
Levels<br />
Reading<br />
1 2 3 4<br />
Mathematics<br />
1 2 3 4<br />
Science<br />
1 2 3 4<br />
Male<br />
<strong>School</strong><br />
<strong>District</strong><br />
State<br />
8.8 41.8 44.8 4.6<br />
7.8 41.0 41.6 9.6<br />
12.2 40.1 39.7 8.0<br />
8.8 33.5 44.8 12.9<br />
6.8 30.1 48.8 14.3<br />
11.2 35.4 42.2 11.2<br />
6.2 26.3 52.6 14.9<br />
4.9 26.8 51.9 16.4<br />
9.0 36.2 41.5 13.3<br />
Female<br />
<strong>School</strong><br />
<strong>District</strong><br />
State<br />
2.9 43.6 45.7 7.9<br />
2.9 37.3 48.7 11.1<br />
7.6 38.8 43.6 10.0<br />
11.4 42.9 38.6 7.1<br />
6.8 32.6 52.4 8.1<br />
10.2 40.0 42.3 7.5<br />
5.0 41.4 44.3 9.3<br />
3.3 33.7 52.6 10.5<br />
8.5 42.9 40.7 7.9<br />
Grade 11 - Racial/Ethnic Background<br />
Reading<br />
Levels 1 2 3 4<br />
White<br />
<strong>School</strong><br />
5.0 41.9 46.2 6.8<br />
<strong>District</strong><br />
4.8 38.3 45.6 11.3<br />
State<br />
5.7 30.6 50.8 12.9<br />
Mathematics<br />
Science<br />
1 2 3 4 1 2 3 4<br />
9.7 36.2 43.0 11.1<br />
6.2 29.7 51.8 12.3<br />
5.6 29.8 51.7 12.9<br />
5.4 30.5 50.9 13.3<br />
3.6 28.0 53.7 14.8<br />
4.3 29.2 51.3 15.2<br />
Black<br />
Hispanic<br />
Asian<br />
<strong>School</strong><br />
<strong>District</strong><br />
State<br />
<strong>School</strong><br />
<strong>District</strong><br />
State<br />
<strong>School</strong><br />
<strong>District</strong><br />
State<br />
Native Hawaiian/Pacific<br />
Islander<br />
<strong>School</strong><br />
<strong>District</strong><br />
State<br />
American Indian<br />
<strong>School</strong><br />
<strong>District</strong><br />
State<br />
Two or More Races<br />
<strong>School</strong><br />
<strong>District</strong><br />
State<br />
13.3 40.0 46.7 0.0 25.0 50.0 25.0 0.0 20.0 33.3 46.7 0.0<br />
19.1 56.6 22.8 1.5 25.4 53.8 20.1 0.8 20.6 60.0 18.4 1.0<br />
18.9 48.6 29.7 2.7 16.2 43.2 32.4 8.1 10.8 51.4 32.4 5.4<br />
13.1 49.2 32.8 4.9 11.5 42.6 39.3 6.6 6.6 52.5 36.1 4.9<br />
14.7 51.9 30.6 2.8 13.9 49.9 33.6 2.6 12.1 54.6 30.4 2.9<br />
0.0 46.2 53.8 0.0 0.0 15.4 76.9 7.7 0.0 23.1 69.2 7.7<br />
6.5 27.3 49.0 17.1 4.0 18.5 48.7 28.8 4.6 22.5 49.2 23.7<br />
8.5 42.3 37.3 12.0 9.9 34.5 47.2 8.5 9.2 39.4 43.0 8.5<br />
10.6 43.4 40.1 5.9 10.4 41.3 43.6 4.7 9.0 48.3 36.6 6.1<br />
0.0 27.3 72.7 0.0 0.0 45.5 45.5 9.1 0.0 18.2 54.5 27.3<br />
5.6 33.3 50.0 11.1 0.0 38.9 44.4 16.7 5.6 11.1 55.6 27.8<br />
7.2 37.1 44.4 11.3 8.7 37.2 43.1 11.0 7.2 36.7 43.2 12.9
34-049-<strong>117</strong>0-16-0001<br />
<strong>Antioch</strong> Comm <strong>High</strong> <strong>School</strong> 9<br />
Grade 11 - Students with Disabilities<br />
IEP<br />
<strong>School</strong><br />
Levels<br />
<strong>District</strong><br />
State<br />
Reading<br />
1 2 3 4<br />
21.7 60.9 17.4 0.0<br />
24.4 57.7 17.9 0.0<br />
41.0 42.7 14.4 2.0<br />
Mathematics<br />
Science<br />
1 2 3 4 1 2 3 4<br />
37.0 45.7 15.2 2.2<br />
30.4 50.6 17.7 1.3<br />
45.7 41.1 11.9 1.3<br />
26.1 41.3 28.3 4.3<br />
25.6 44.9 26.9 2.6<br />
36.9 48.2 12.6 2.3<br />
Non-IEP<br />
<strong>School</strong><br />
<strong>District</strong><br />
State<br />
3.8 39.6 49.7 6.9<br />
3.3 37.0 48.1 11.6<br />
5.9 39.0 45.1 9.9<br />
5.6 36.1 46.5 11.8<br />
3.8 28.7 54.6 12.9<br />
6.2 37.3 46.1 10.4<br />
2.4 31.3 52.4 13.9<br />
1.5 27.9 55.5 15.2<br />
5.2 38.5 44.7 11.6<br />
Grade 11 - Economically Disadvantaged<br />
Free/Reduced Price Lunch<br />
<strong>School</strong><br />
<strong>District</strong><br />
State<br />
Not Eligible<br />
Levels<br />
<strong>School</strong><br />
<strong>District</strong><br />
State<br />
Reading<br />
1 2 3 4<br />
7.4 55.8 35.8 1.1<br />
7.4 52.9 38.2 1.5<br />
16.9 52.3 28.4 2.3<br />
5.9 37.2 49.0 7.9<br />
5.2 36.0 46.3 12.4<br />
5.1 30.6 50.7 13.6<br />
1<br />
Mathematics<br />
2 3<br />
17.9 45.3 33.7 3.2<br />
15.3 46.7 34.3 3.6<br />
18.7 51.1 28.4 1.9<br />
6.7 34.3 45.6 13.4<br />
4.7 27.4 54.4 13.5<br />
5.2 28.6 51.7 14.5<br />
4<br />
1<br />
Science<br />
2 3 4<br />
10.5 44.2 40.0 5.3<br />
10.3 42.6 41.9 5.1<br />
15.8 55.5 26.5 2.3<br />
3.8 28.0 52.7 15.5<br />
2.7 26.7 54.8 15.9<br />
4.0 28.7 51.1 16.3
34-049-<strong>117</strong>0-16-0001<br />
<strong>Antioch</strong> Comm <strong>High</strong> <strong>School</strong> 10<br />
2012 ADEQUATE YEARLY PROGRESS (AYP) STATUS REPORT<br />
Is this school making Adequate Yearly Progress (AYP)?<br />
No<br />
Has this school been identified for <strong>School</strong> Improvement according to the<br />
AYP specifications of the federal No Child Left Behind Act?<br />
Yes<br />
Is this school making AYP in Reading?<br />
No<br />
2012-13 Federal Improvement Status Restructuring<br />
Is this school making AYP in Mathematics?<br />
No<br />
2012-13 State Improvement Status<br />
Academic Watch Status Year 2<br />
Reading<br />
Percent Tested on<br />
State Tests<br />
Mathematics<br />
Percent Meeting/Exceeding Standards *<br />
Reading<br />
Mathematics<br />
Safe<br />
Safe<br />
% Met % Met % Harbor Met % Harbor Met %<br />
AYP<br />
AYP<br />
Target ** AYP<br />
Target ** AYP<br />
Attendance Rate<br />
Other Indicators<br />
Met<br />
AYP<br />
5-YEAR<br />
Graduation Rate<br />
%<br />
Met<br />
AYP<br />
State AYP<br />
Minimum Target<br />
95.0 95.0 85.0 85.0 91.0 82.0<br />
All<br />
99.4<br />
Yes<br />
99.4<br />
Yes<br />
51.1<br />
No<br />
53.2<br />
No<br />
93.0<br />
Yes<br />
White<br />
Black<br />
99.6<br />
Yes<br />
99.6<br />
Yes<br />
52.9 66.7<br />
No<br />
54.7 67.6 No<br />
93.0<br />
Hispanic<br />
Asian<br />
Native Hawaiian/<br />
Pacific Islander<br />
American Indian<br />
Two or More<br />
Races<br />
LEP<br />
Students with<br />
Disabilities<br />
97.9<br />
Yes<br />
97.9<br />
Yes<br />
17.4<br />
No<br />
17.4<br />
No<br />
Economically<br />
Disadvantaged<br />
98.0<br />
Yes<br />
98.0<br />
Yes<br />
37.2<br />
No<br />
37.2<br />
No<br />
Four Conditions Are Required For Making Adequate Yearly Progress (AYP):<br />
1. At least 95% tested in reading and mathematics for every student group. If the current year participation rate is less than 95%, this condition may<br />
be met if the average of the current and preceding year rates is at least 95%, or if the average of the current and two preceding years is at least 95%.<br />
Only actual participation rates are printed. If the participation rate printed is less than 95% and yet this school makes AYP, it means that the 95%<br />
condition was met by averaging.<br />
2. At least 85% meeting/exceeding standards in reading and mathematics for every group. For any group with less than 85% meeting/exceeding<br />
standards, a 95% confidence interval was applied. Subgroups may meet this condition through Safe Harbor provisions. ***<br />
3. At least 91% attendance rate for non-high schools and at least 82% graduation rate for high schools.<br />
* Includes only students enrolled as of 05/01/2011.<br />
** Safe Harbor Targets of 85% or above are not printed.<br />
*** Subgroups with fewer than 45 students are not reported. Safe Harbor only applies to subgroups of 45 or more. In order for Safe Harbor to apply, a<br />
subgroup must decrease by 10% the percentage of scores that did not meet state standards from the previous year plus meet the other indicators<br />
(attendance rate for non-high schools and graduation rate for high schools) for the subgroup. For subgroups that do not meet their Safe Harbor<br />
Targets, a 75% confidence interval is applied. Safe Harbor allows schools an alternate method to meet subgroup minimum targets on achievement.
34-049-<strong>117</strong>0-16-0001<br />
<strong>Antioch</strong> Comm <strong>High</strong> <strong>School</strong> 11<br />
2012 DIFFERENTIATED ACCOUNTABILITY CLASSIFICATION<br />
The Differentiated Accountability classification for the school is:<br />
Comprehensive<br />
Is this school making (AYP) in the “ALL” subgroup in reading?<br />
No<br />
Is this school making (AYP) in the “ALL” subgroup in math?<br />
No<br />
In 2008, the Illinois State Board of Education (ISBE) was one of 6 states to be chosen by the US Department of Education to participate on the<br />
Differentiated Accountability Pilot Program. The Differentiated Accountability classification applies only to schools in federal improvement status<br />
that do not make AYP.<br />
The classification is a descriptor (i.e., focused or comprehensive) that is added to a school’s improvement status. Current Title I requirements do not<br />
change. The classification assists in distinguishing between schools that need focused supports verses more comprehensive interventions.<br />
If a school does make AYP in ALL-student group in both reading and math, this school will be classified as a focused school; otherwise, the school<br />
will be identified as a comprehensive school.