Charles Vögele increases sales and earnings significantly
Charles Vögele increases sales and earnings significantly
Charles Vögele increases sales and earnings significantly

You also want an ePaper? Increase the reach of your titles
YUMPU automatically turns print PDFs into web optimized ePapers that Google loves.
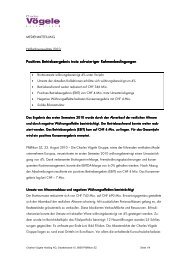
CHF million 1st Half-Year<br />
<strong>Charles</strong> <strong>Vögele</strong> Group<br />
Group Key Operating Figures<br />
2006<br />
1st Half-Year<br />
2007<br />
Change in<br />
Gross <strong>sales</strong> 720.7 782.8 9%<br />
Net <strong>sales</strong> 627.6 672.0 7%<br />
Changes in net <strong>sales</strong> adjusted for expansion in % (7%) 4%<br />
Gross profit from fashion retail 382.3 427.6 12%<br />
Gross profit in % of net <strong>sales</strong> 60.9% 63.6%<br />
Operating <strong>earnings</strong> before depreciation (EBITDA) 52.9 67.3 27%<br />
Operating <strong>earnings</strong> (EBIT) 26.6 38.4 44%<br />
Net profit 13.5 22.8 69%<br />
Cash flow from operating activities 1.0 35.6<br />
Net cash used by investing activities (31.2) (38.6)<br />
Free cash flow (30.2) (3.0)<br />
Number of stores as of 30 June 789 816 3%<br />
Sales area as of 30 June in m 2 602 908 629 992 4%<br />
Net <strong>sales</strong> per m 2 <strong>sales</strong> area in CHF 1) 1 044 1 077 3%<br />
Number of employees as of 30 June 2) 7 207 7 656 6%<br />
Average number of full-time employees on an half-year<br />
basis 2)<br />
Net <strong>sales</strong> per average number of full-time employees in<br />
CHF 2)<br />
CHF million<br />
%<br />
4 805 4 966 3%<br />
130 624 135 316 4%<br />
31.12.2006<br />
30.6.2007<br />
Change in<br />
Net debt 166.7 179.1 7%<br />
Shareholders’ equity 488.7 500.2 2%<br />
Balance sheet total 884.8 936.1 6%<br />
Shareholders’ equity in % of balance sheet total 55% 53%<br />
1) Calculated on the basis of average m 2 <strong>sales</strong> area per month<br />
2) Excluding apprentices<br />
%