Extending Health Insurance: Effects of the National ... - ResearchGate
Extending Health Insurance: Effects of the National ... - ResearchGate
Extending Health Insurance: Effects of the National ... - ResearchGate
You also want an ePaper? Increase the reach of your titles
YUMPU automatically turns print PDFs into web optimized ePapers that Google loves.
want to drift away from <strong>the</strong> main focus <strong>of</strong> <strong>the</strong> paper, we decided to leave <strong>the</strong> analysis <strong>of</strong> <strong>the</strong><br />
sustainability issue to fur<strong>the</strong>r studies.<br />
2.3 The Structure and Geography <strong>of</strong> <strong>Health</strong> Services in Ghana<br />
Formal health facilities in Ghana are hierarchically organized, and comprise four levels in <strong>the</strong> urban<br />
areas and five in rural areas (Mensah et al. 2010). The health post is <strong>the</strong> first level provider in <strong>the</strong><br />
rural areas. <strong>Health</strong> centers or clinics, district hospitals, regional hospitals and teaching hospitals<br />
follow in that order.<br />
Perhaps, <strong>the</strong> most striking feature <strong>of</strong> Ghana’s health system relates to spatial disparity, particularly<br />
between nor<strong>the</strong>rn and sou<strong>the</strong>rn Ghana, and between rural and urban areas <strong>of</strong> <strong>the</strong> country. Moreover,<br />
<strong>the</strong> health care system still suffers some serious challenges such as <strong>the</strong> dearth in health care<br />
pr<strong>of</strong>essionals caused by a serious drain. (60% <strong>of</strong> <strong>the</strong> doctors trained locally in <strong>the</strong> 1980s have left<br />
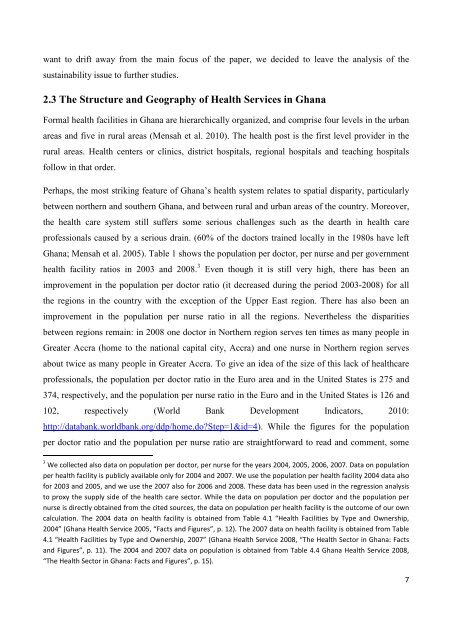
Ghana; Mensah et al. 2005). Table 1 shows <strong>the</strong> population per doctor, per nurse and per government<br />
health facility ratios in 2003 and 2008. 3 Even though it is still very high, <strong>the</strong>re has been an<br />
improvement in <strong>the</strong> population per doctor ratio (it decreased during <strong>the</strong> period 2003-2008) for all<br />
<strong>the</strong> regions in <strong>the</strong> country with <strong>the</strong> exception <strong>of</strong> <strong>the</strong> Upper East region. There has also been an<br />
improvement in <strong>the</strong> population per nurse ratio in all <strong>the</strong> regions. Never<strong>the</strong>less <strong>the</strong> disparities<br />
between regions remain: in 2008 one doctor in Nor<strong>the</strong>rn region serves ten times as many people in<br />
Greater Accra (home to <strong>the</strong> national capital city, Accra) and one nurse in Nor<strong>the</strong>rn region serves<br />
about twice as many people in Greater Accra. To give an idea <strong>of</strong> <strong>the</strong> size <strong>of</strong> this lack <strong>of</strong> healthcare<br />
pr<strong>of</strong>essionals, <strong>the</strong> population per doctor ratio in <strong>the</strong> Euro area and in <strong>the</strong> United States is 275 and<br />
374, respectively, and <strong>the</strong> population per nurse ratio in <strong>the</strong> Euro and in <strong>the</strong> United States is 126 and<br />
102, respectively (World Bank Development Indicators, 2010:<br />
http://databank.worldbank.org/ddp/home.do?Step=1&id=4). While <strong>the</strong> figures for <strong>the</strong> population<br />
per doctor ratio and <strong>the</strong> population per nurse ratio are straightforward to read and comment, some<br />
3 We collected also data on population per doctor, per nurse for <strong>the</strong> years 2004, 2005, 2006, 2007. Data on population<br />
per health facility is publicly available only for 2004 and 2007. We use <strong>the</strong> population per health facility 2004 data also<br />
for 2003 and 2005, and we use <strong>the</strong> 2007 also for 2006 and 2008. These data has been used in <strong>the</strong> regression analysis<br />
to proxy <strong>the</strong> supply side <strong>of</strong> <strong>the</strong> health care sector. While <strong>the</strong> data on population per doctor and <strong>the</strong> population per<br />
nurse is directly obtained from <strong>the</strong> cited sources, <strong>the</strong> data on population per health facility is <strong>the</strong> outcome <strong>of</strong> our own<br />
calculation. The 2004 data on health facility is obtained from Table 4.1 “<strong>Health</strong> Facilities by Type and Ownership,<br />
2004” (Ghana <strong>Health</strong> Service 2005, “Facts and Figures”, p. 12). The 2007 data on health facility is obtained from Table<br />
4.1 “<strong>Health</strong> Facilities by Type and Ownership, 2007” (Ghana <strong>Health</strong> Service 2008, “The <strong>Health</strong> Sector in Ghana: Facts<br />
and Figures”, p. 11). The 2004 and 2007 data on population is obtained from Table 4.4 Ghana <strong>Health</strong> Service 2008,<br />
“The <strong>Health</strong> Sector in Ghana: Facts and Figures”, p. 15).<br />
7


