2010 Nesting Season - Biodiversity Centre for Wildlife Studies
2010 Nesting Season - Biodiversity Centre for Wildlife Studies
2010 Nesting Season - Biodiversity Centre for Wildlife Studies

Create successful ePaper yourself
Turn your PDF publications into a flip-book with our unique Google optimized e-Paper software.
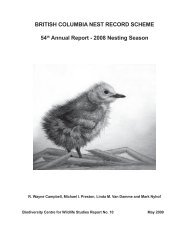
and the other <strong>for</strong> the cowbird. These included:<br />
Errol Anderson, Ed and Hazel Beynon, Gary<br />
Breault, R. Wayne Campbell, Evi Coulson,<br />
Gary Davidson, Clint and Irene Davy, Hugh<br />
Fraser, Warren Gilchrist, James Grant, Penny<br />
Hall, Ted Hillary, Robert E. Luscher, Arthur<br />
L. Meugens, North Okanagan Naturalists<br />
Club, Ivar Nygaard-Petersen, Janne Perrin,<br />
Mark Phinney, Glenn R. Ryder, Chris Siddle,<br />
and Linda Van Damme. Mark Nyhof found 12<br />
parasitized nests <strong>for</strong> 11 different host species<br />
including a pair of Ruby-crowned Kinglets<br />
feeding a fledged cowbird on the late date of 17<br />
July.<br />
Each nest card is filed separately in the<br />
BCNRS. This readily allows examination of<br />
changes in frequency of parasitism among<br />
hosts as well as regional changes throughout<br />
the province over time.<br />
Coverage<br />
Since the BCNRS is a volunteer-based<br />
endeavour, there was no attempt in <strong>2010</strong> to<br />
systematically focus an ef<strong>for</strong>t on any particular<br />
area, such as Haida Gwaii (Queen Charlotte<br />
Islands), Vancouver Island, or the Okanagan<br />
Valley. Rather, breeding records were received<br />
from widely scattered locations, although<br />
several areas, by default or personal interests,<br />
received more thorough coverage.<br />
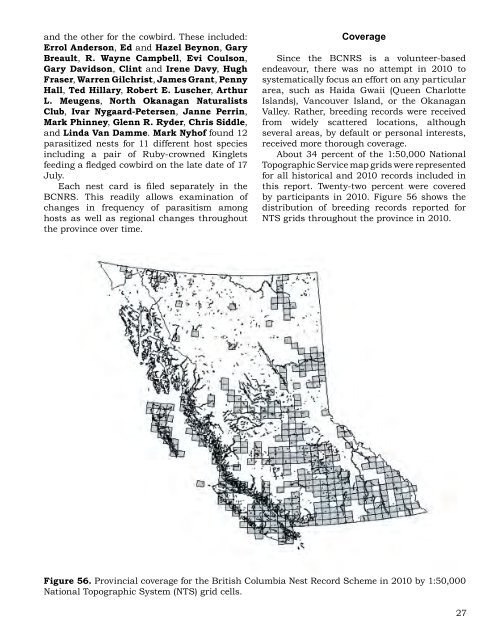
About 34 percent of the 1:50,000 National<br />
Topographic Service map grids were represented<br />
<strong>for</strong> all historical and <strong>2010</strong> records included in<br />
this report. Twenty-two percent were covered<br />
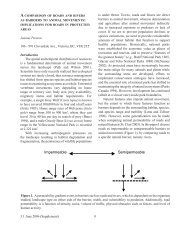
by participants in <strong>2010</strong>. Figure 56 shows the<br />
distribution of breeding records reported <strong>for</strong><br />
NTS grids throughout the province in <strong>2010</strong>.<br />
Figure 56. Provincial coverage <strong>for</strong> the British Columbia Nest Record Scheme in <strong>2010</strong> by 1:50,000<br />
National Topographic System (NTS) grid cells.<br />
27