Species richness of vascular plants, bryophytes ... - 192.38.112.111
Species richness of vascular plants, bryophytes ... - 192.38.112.111
Species richness of vascular plants, bryophytes ... - 192.38.112.111

Create successful ePaper yourself
Turn your PDF publications into a flip-book with our unique Google optimized e-Paper software.
ACTA OECOLOGICA 29 (2006) 241– 246<br />
available at www.sciencedirect.com<br />
journal homepage: www.elsevier.com/locate/actoec<br />
Original article<br />
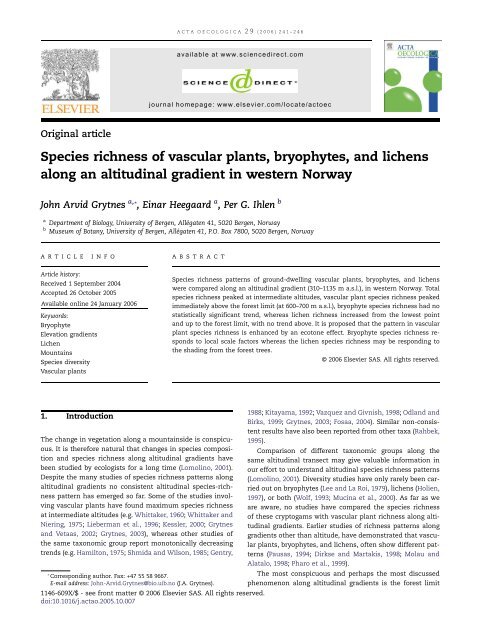
<strong>Species</strong> <strong>richness</strong> <strong>of</strong> <strong>vascular</strong> <strong>plants</strong>, <strong>bryophytes</strong>, and lichens<br />
along an altitudinal gradient in western Norway<br />
John Arvid Grytnes a, *, Einar Heegaard a , Per G. Ihlen b<br />
a Department <strong>of</strong> Biology, University <strong>of</strong> Bergen, Allégaten 41, 5020 Bergen, Norway<br />
b Museum <strong>of</strong> Botany, University <strong>of</strong> Bergen, Allégaten 41, P.O. Box 7800, 5020 Bergen, Norway<br />
A R T I C L E<br />
I N F O<br />
A B S T R A C T<br />
Article history:<br />
Received 1 September 2004<br />
Accepted 26 October 2005<br />
Available online 24 January 2006<br />
Keywords:<br />
Bryophyte<br />
Elevation gradients<br />
Lichen<br />
Mountains<br />
<strong>Species</strong> diversity<br />
Vascular <strong>plants</strong><br />
<strong>Species</strong> <strong>richness</strong> patterns <strong>of</strong> ground-dwelling <strong>vascular</strong> <strong>plants</strong>, <strong>bryophytes</strong>, and lichens<br />
were compared along an altitudinal gradient (310–1135 m a.s.l.), in western Norway. Total<br />
species <strong>richness</strong> peaked at intermediate altitudes, <strong>vascular</strong> plant species <strong>richness</strong> peaked<br />
immediately above the forest limit (at 600–700 m a.s.l.), bryophyte species <strong>richness</strong> had no<br />
statistically significant trend, whereas lichen <strong>richness</strong> increased from the lowest point<br />
and up to the forest limit, with no trend above. It is proposed that the pattern in <strong>vascular</strong><br />
plant species <strong>richness</strong> is enhanced by an ecotone effect. Bryophyte species <strong>richness</strong> responds<br />
to local scale factors whereas the lichen species <strong>richness</strong> may be responding to<br />
the shading from the forest trees.<br />
© 2006 Elsevier SAS. All rights reserved.<br />
1. Introduction<br />
The change in vegetation along a mountainside is conspicuous.<br />
It is therefore natural that changes in species composition<br />
and species <strong>richness</strong> along altitudinal gradients have<br />
been studied by ecologists for a long time (Lomolino, 2001).<br />
Despite the many studies <strong>of</strong> species <strong>richness</strong> patterns along<br />
altitudinal gradients no consistent altitudinal species-<strong>richness</strong><br />
pattern has emerged so far. Some <strong>of</strong> the studies involving<br />
<strong>vascular</strong> <strong>plants</strong> have found maximum species <strong>richness</strong><br />
at intermediate altitudes (e.g. Whittaker, 1960; Whittaker and<br />
Niering, 1975; Lieberman et al., 1996; Kessler, 2000; Grytnes<br />
and Vetaas, 2002; Grytnes, 2003), whereas other studies <strong>of</strong><br />
the same taxonomic group report monotonically decreasing<br />
trends (e.g. Hamilton, 1975; Shmida and Wilson, 1985; Gentry,<br />
* Corresponding author. Fax: +47 55 58 9667.<br />
E-mail address: John-Arvid.Grytnes@bio.uib.no (J.A. Grytnes).<br />
1146-609X/$ - see front matter © 2006 Elsevier SAS. All rights reserved.<br />
doi:10.1016/j.actao.2005.10.007<br />
1988; Kitayama, 1992; Vazquez and Givnish, 1998; Odland and<br />
Birks, 1999; Grytnes, 2003; Fosaa, 2004). Similar non-consistent<br />
results have also been reported from other taxa (Rahbek,<br />
1995).<br />
Comparison <strong>of</strong> different taxonomic groups along the<br />
same altitudinal transect may give valuable information in<br />
our effort to understand altitudinal species <strong>richness</strong> patterns<br />
(Lomolino, 2001). Diversity studies have only rarely been carried<br />
out on <strong>bryophytes</strong> (Lee and La Roi, 1979), lichens (Holien,<br />
1997), or both (Wolf, 1993; Mucina et al., 2000). As far as we<br />
are aware, no studies have compared the species <strong>richness</strong><br />
<strong>of</strong> these cryptogams with <strong>vascular</strong> plant <strong>richness</strong> along altitudinal<br />
gradients. Earlier studies <strong>of</strong> <strong>richness</strong> patterns along<br />
gradients other than altitude, have demonstrated that <strong>vascular</strong><br />
<strong>plants</strong>, <strong>bryophytes</strong>, and lichens, <strong>of</strong>ten show different patterns<br />
(Pausas, 1994; Dirkse and Martakis, 1998; Molau and<br />
Alatalo, 1998; Pharo et al., 1999).<br />
The most conspicuous and perhaps the most discussed<br />
phenomenon along altitudinal gradients is the forest limit
242 ACTA OECOLOGICA 29 (2006) 241– 246<br />
or treeline (Körner and Paulsen, 2004). Because this feature is<br />
so evident, it is <strong>of</strong>ten believed that this represents a critical<br />
altitude where species composition and diversity change<br />
abruptly, reflected in, for example, the division <strong>of</strong> vegetation<br />
zones or flora elements in boreal (below forest line) and alpine<br />
(above forest line) (Dahl, 1998; Moen, 1999). Such abrupt<br />
changes or ecotones may cause inflation <strong>of</strong> species <strong>richness</strong><br />
due to mass effects or source sink effects (Shmida and Wilson,<br />
1985; Pulliam, 1988). Mass effect is the establishment <strong>of</strong><br />
species in sites where a self-maintaining population cannot<br />
exist (Shmida and Wilson, 1985), and in areas like the forestalpine<br />
transition some species from the forest may establish<br />
short-lived populations (sinks) in the alpine area and viceversa<br />
resulting in inflated species <strong>richness</strong> around the ecotone.<br />
The aims <strong>of</strong> our paper are tw<strong>of</strong>old. First, describe and<br />
compare the altitudinal <strong>richness</strong> patterns <strong>of</strong> <strong>vascular</strong> <strong>plants</strong>,<br />
<strong>bryophytes</strong>, and lichens along one altitudinal transect, and<br />
second, examine the influence <strong>of</strong> the tree-line ecotone on<br />
these patterns.<br />
2. Study area and methods<br />
The study area (60°13′N and 6°15′E) is situated in the Jondalen<br />
municipality close to the Hardangerfjord in Hordaland<br />
province, western Norway. The area has an oceanic climate<br />
with a precipitation <strong>of</strong> 2200 mm/year (342 m above sea level<br />
(a.s.l.), Førland, 1993), and with relatively warm winters and<br />
cold summers. The selected altitudinal gradient is a northfacing<br />
hillside and starts at lake Torsnesvatnet at 310 m a.s.<br />
l. and ends on the summit <strong>of</strong> a local mountain, 1135 m a.s.l.<br />
To avoid possible biases due to different aspects we started<br />
the transect at 300 m. The hillside is steep (the 825 vertical<br />
metres <strong>of</strong> the transect is along approximately 1200 horizontal<br />
metres) but towards the local summit where the transect<br />
ended the slope becomes more gentle. The bedrock <strong>of</strong> the<br />
hillside is composed <strong>of</strong> acidic and hard granite (Holtedahl<br />
and Dons, 1960).<br />
The lower part <strong>of</strong> the gradient is a birch (Betula pubescens)<br />
forest interspersed with Sorbus aucuparia, and with Athyrium<br />
filix-femina, Linnaea borealis, Melampyrum pratense, and Vaccinium<br />
myrtillus as the most common species in the field layer.<br />
Here, lichens are almost absent, whereas the <strong>bryophytes</strong><br />
Mnium hornum, Plagiomnium undulatum, and Plagiochila asplenoides<br />
are quite common. At altitudes ranging from about<br />
350 to about 550 m, pine (Pinus sylvestris), interspersed with<br />
B. pubescens, is the dominant forest tree, with V. myrtillus,<br />
V. uliginosum, V. vitis-idaea, and Calluna vulgaris as the most<br />
common species in the field layer. Cladonia species are well<br />
represented but cover only small areas. Common <strong>bryophytes</strong><br />
include Dicranum majus, Ptilium crista-castrensis, Aulacomnium<br />
palustre, and Bazzania trilobata. Above the forest limit, which<br />
is at approximately 600 m (set to 615 m in this study because<br />
we had our last sample with trees at 610), the vegetation is a<br />
mosaic with mires, containing Eriophorum vaginatum, Rubus<br />
chamaemorus, Narthecium ossifragum, and various Sphagnum<br />
species in small depressions, and ericaceous shrubs like Empetrum<br />
nigrum, Loiseleuria procumbens, and Vaccinium species<br />
dominating in drier areas. Lichens become more abundant,<br />
and include, for example, Cetraria delisei, C. islandica, Cladonia<br />
arbuscula, C. coccifera, C. gracilis, and C. mitis. Bryophytes common<br />
at higher altitudes include Racomitrium lanuginosum, Ptilidium<br />
ciliare, Barbilophozia lycopodioides, Kiaeria starkei, and<br />
Conostomum tetragonum. Common throughout the altitudinal<br />
gradient are Hylocomium splendens, Pleurozium schreberi, Sphagnum<br />
spp., Polytrichum commune, and Rhytidiadelphus loreus.<br />
There were 42 quadrats, each 25 m 2 , placed along the<br />
transect at intervals <strong>of</strong> approximately 20 vertical metres.<br />
Wet or very dry places were avoided when placing the plots.<br />
The placement <strong>of</strong> the plots was constrained by topography<br />
(steepness and availability).<br />
In each plot all ground-dwelling <strong>vascular</strong> <strong>plants</strong>, <strong>bryophytes</strong><br />
and lichens were recorded, omitting all epiphytic<br />
and epilithic species. We omitted epiphytic and epilithic species<br />
because including these species would probably cause a<br />
major bias when comparing <strong>vascular</strong> plant pattern with<br />
bryophyte and lichen patterns as epiphytic or epilithic <strong>vascular</strong><br />
plant species are almost absent in the area. We found it<br />
therefore most meaningful to compare the three groups <strong>of</strong><br />
organisms by considering only specimens growing on soil.<br />
All identifications were done in the field, except for some<br />
Cladonia and bryophyte specimens that were brought to the<br />
laboratory for microscopical and chemical examination. A<br />
total <strong>of</strong> 63 lichen specimens was examined by thin-layer<br />
chromatography (TLC) according to the method <strong>of</strong> Culberson<br />
and Kristinsson (1970), with later modifications. Nomenclature<br />
<strong>of</strong> <strong>vascular</strong> <strong>plants</strong> follows Lid and Lid (1994), for <strong>bryophytes</strong><br />
Frisvoll et al. (1995), and lichens Santesson et al.<br />
(2004). Cladonia ecmocyna Leight. and C. maxima (Asahina)<br />
Ahti are here treated as the same species.<br />
Generalised linear models (GLM, McCullagh and Nelder,<br />
1989) were used to relate species <strong>richness</strong> <strong>of</strong> the three taxonomic<br />
groups and all groups combined to altitude. As the response<br />
variables are counts, we assume a Poisson distribution<br />
and a logarithmic link. An inspection <strong>of</strong> the diagnostic<br />
plots confirmed that this performed better than a normal<br />
distribution and identity link. Using a parametric GLM restricts<br />
the estimated pattern very much, and any abrupt<br />
changes around ecotones will in most cases not be detected<br />
by GLM. We therefore used a cubic smooth spline, within the<br />
framework <strong>of</strong> generalised additive models (GAM) (Hastie and<br />
Tibshirani, 1990), to evaluate whether any trends in the data<br />
that could not be captured by parametric regression were<br />
present. To describe the relationship between species <strong>richness</strong><br />
and altitude we constructed five different models, two<br />
with GLM (a linear and unimodal relationship), and three<br />
with GAM (using three to five degrees <strong>of</strong> freedom, respectively).<br />
An F-test was performed to choose the best <strong>of</strong> the five<br />
models. Even though the <strong>vascular</strong> plant species <strong>richness</strong> pattern<br />
is described earlier (Grytnes, 2003), the main findings for<br />
this group are described here as well to ease comparison<br />
with lichen and bryophyte <strong>richness</strong> patterns.<br />
In order to quantify the major changes in species composition,<br />
a correspondence analysis <strong>of</strong> the species data were<br />
performed, using Canoco for Windows 4.0 (ter Braak and<br />
Šmilauer, 1998). <strong>Species</strong> that could not be identified to species<br />
level and were found in several samples were made passive<br />
in the ordinations. Three separate ordinations were
ACTA OECOLOGICA 29 (2006) 241– 246<br />
243<br />
made for the taxonomic groups separately to evaluate if the<br />
three groups responded differently to altitude, and especially<br />
if there is a change in response to the forest limit. For this we<br />
considered only the first axes <strong>of</strong> the CA ordination, which is<br />
assumed to summarise the major trend in species composition.<br />
The sample scores <strong>of</strong> this axis were used as a response<br />
variable in a regression where altitude was used as a predictor<br />
variable. Since we are explicitly looking for abrupt<br />
changes in the relationship we used smoothing spline to describe<br />
the trend in species composition with altitude. We<br />
made nine different models using from one to nine degrees<br />
<strong>of</strong> freedom and chose the model with the lowest Mallows Cp<br />
(Hastie and Tibshirani, 1990). If the forest line is a critical altitude<br />
for the species composition there will be a steeper<br />
slope <strong>of</strong> the line describing the relationship between altitude<br />
and the first CA-axis around the forest line.<br />
3. Results<br />
Total species <strong>richness</strong> showed a unimodal relationship with<br />
altitude. The smooth spline did not significantly improve the<br />
fit. Maximum species number occurred at about 750 m above<br />
sea level (Fig. 1a).<br />
The altitudinal patterns <strong>of</strong> species <strong>richness</strong> clearly differed<br />
between taxonomic groups (Fig. 1). This was also indicated<br />
by the low correlations between species <strong>richness</strong> <strong>of</strong><br />
<strong>vascular</strong> <strong>plants</strong>, <strong>bryophytes</strong>, and lichens. The highest correlation<br />
coefficient was found between bryophyte and lichen<br />
species <strong>richness</strong> (r = 0.076), the <strong>vascular</strong> plant species <strong>richness</strong><br />
and bryophyte species <strong>richness</strong> correlation was slightly<br />
less r = 0.074), and the <strong>vascular</strong> plant and lichen <strong>richness</strong> correlation<br />
was 0.033. Vascular plant species <strong>richness</strong> showed a<br />
humped relationship with altitude. The second-order polynomial<br />
statistically explained about 50% <strong>of</strong> the null deviance<br />
(Table 1). A statistically significant improvement was<br />
achieved with smooth spline with five degrees <strong>of</strong> freedom<br />
and this model described a sharp hump between 600 and<br />
800 m (Fig. 1b). The number <strong>of</strong> <strong>bryophytes</strong> showed no statistically<br />
significant relationship with altitude (Fig. 1c). The<br />
polynomial model for lichen species <strong>richness</strong> indicates a<br />
humped relationship with a maximum slightly below the<br />
maximum altitude investigated. The smooth spline indicate<br />
a rather steep increase in species <strong>richness</strong> with altitude up to<br />
approximately 600 m (the forest limit) and a more moderately<br />
increasing species <strong>richness</strong> above this altitude (Fig. 1d).<br />
The first axis <strong>of</strong> the CA ordination is clearly related to altitude<br />
for all three taxonomical groups (Fig. 2). The best<br />
smoothing spline model found with our approach used three<br />
Fig. 1 – Scatterplots <strong>of</strong> the relationship between species <strong>richness</strong> and altitude. The unbroken line is the polynomial<br />
regression line, whereas the broken line is the fitted line using a cubic smooth spline (cf. Table 1). a) shows the unimodal<br />
relationship between total species <strong>richness</strong> and altitude, b) shows the mid-altitude hump in <strong>vascular</strong> plant species<br />
<strong>richness</strong>, c) shows the constant bryophyte species <strong>richness</strong> with altitude, and d) shows the steep increase in lichen species<br />
<strong>richness</strong> up to 600 m and that above this altitude only a weak trend with altitude is present.
244 ACTA OECOLOGICA 29 (2006) 241– 246<br />
Table 1 – Summary <strong>of</strong> the regression models between<br />
species <strong>richness</strong> as response variable and altitude as<br />
predictor variable. The statistically best model is in bold.<br />
The results are graphically displayed in Fig. 1. The<br />
models are either GLM with first- or second-order<br />
polynomial (p1 or p2, respectively), or GAM (with cubic<br />
smooth spline) using three to five, or six degrees <strong>of</strong><br />
freedom (s3, s4, s5, s6). The F and P-value refers to the<br />
test described in the test column. Res. dev = residual<br />
deviance<br />
Res. dev Test F P<br />
Total species <strong>richness</strong><br />
Null 56.93<br />
p1 56.67 Null vs. p1 0.18 0.67<br />
p2 42.87 Null vs. p2 6.63 0.0033<br />
s3 39.88 p2 vs. s3 2.9 0.097<br />
s4 38.33 p2 vs. s4 2.28 0.116<br />
s5 36.75 p2 vs. s5 2.03 0.127<br />
Vascular plant species <strong>richness</strong><br />
Null 67.5<br />
p1 66.85 Null vs. p1 0.38 0.54<br />
p2 33.75 Null vs. p2 19.73 0.0000012<br />
s3 24.57 p2 vs. s3 14.17 0.00054<br />
s4 20.96 s3 vs. s4 6.49 0.015<br />
s5 18.58 s4 vs. s5 4.65 0.038<br />
s6 16.82 s5 vs. s6 3.69 0.063<br />
Bryophyte species <strong>richness</strong><br />
Null 37.88<br />
p1 37.52 Null vs. p1 0.41 0.53<br />
p2 36.43 Null vs. p2 0.81 0.45<br />
s3 35.30 Null vs. s3 0.96 0.42<br />
s4 34.58 Null vs. s4 0.92 0.46<br />
s5 33.86 Null vs. s5 0.89 0.5<br />
Lichen species <strong>richness</strong><br />
Null 55.70<br />
p1 42.91 Null vs. p1 14.5 0.00047<br />
p2 36.60 p1 vs. p2 7.77 0.0081<br />
s3 32.53 p2 vs. s3 5.43 0.025<br />
s4 29.35 s3 vs. s4 4.02 0.049<br />
s5 27.35 s4 vs. s5 2.87 0.099<br />
degrees <strong>of</strong> freedom for <strong>bryophytes</strong> and lichens and five degrees<br />
<strong>of</strong> freedom for <strong>vascular</strong> <strong>plants</strong>. The explanatory power<br />
is high for the models (R 2 = 0.90 for <strong>vascular</strong> <strong>plants</strong>, 0.88 for<br />
<strong>bryophytes</strong>, and 0.67 for lichens). The similarity <strong>of</strong> species<br />
composition gradients are also demonstrated by the high<br />
Pearson correlation coefficients between the first CA axis<br />
sample score for the groups (r = 0.95 between <strong>vascular</strong> <strong>plants</strong><br />
and <strong>bryophytes</strong>, 0.75 between <strong>vascular</strong> <strong>plants</strong> and lichens,<br />
and 0.72 between <strong>bryophytes</strong> and lichens). It is clear that<br />
the change in species composition <strong>of</strong> <strong>vascular</strong> <strong>plants</strong> and<br />
<strong>bryophytes</strong> is less abrupt around the tree line than anywhere<br />
else along the gradient contrary to the expectation that there<br />
are abrupt changes in species composition around the tree<br />
line (Fig. 2a, b). For lichens the slope is steep from the lowlands<br />
and until after the tree line, and in the alpine zone species<br />
composition changes very little with altitude (Fig. 2c).<br />
4. Discussion<br />
The statistical analyses clearly demonstrate that the species<br />
<strong>richness</strong> <strong>of</strong> the three taxonomical groups respond very differently<br />
to altitude. This corresponds to observations from<br />
previous studies that species <strong>richness</strong> <strong>of</strong> different functional<br />
and taxonomic groups shows different patterns along environmental<br />
gradients (Pausas, 1994; Pharo et al., 1999). However,<br />
the relationship between the first axis <strong>of</strong> the CA for<br />
the three taxonomical groups and altitude shows that the<br />
species composition <strong>of</strong> all three groups respond similarly<br />
and very strongly to altitude. So although species <strong>richness</strong><br />
does not respond similarly to this gradient it is a strong environmental<br />
gradient for all three taxonomic groups.<br />
The change in species <strong>richness</strong> <strong>of</strong> <strong>vascular</strong> <strong>plants</strong> and lichens<br />
appears to occur approximately at the forest limit<br />
(about 600 m a.s.l.), although it is only <strong>vascular</strong> plant species<br />
<strong>richness</strong> that seems to respond as expected to an ecotone at<br />
the forest limit. According to the smoothing spline line, there<br />
is an evident hump in <strong>vascular</strong> plant species <strong>richness</strong> which<br />
starts immediately above the forest limit (Fig. 1b). In a previous<br />
paper using the same data as used here for <strong>vascular</strong><br />
<strong>plants</strong> plus data for <strong>vascular</strong> plant species <strong>richness</strong> along<br />
with six other hill sides, the source-sink effect are discussed<br />
as the most likely cause explaining the majority <strong>of</strong> these seven<br />
altitudinal patterns (Grytnes, 2003). The hump observed<br />
in this study above the forest line may be interpreted as the<br />
forest species having more sink populations (populations<br />
that cannot be sustained for long periods <strong>of</strong> time without input<br />
from source populations) above the forest limit than alpine<br />
species have sink populations below the forest line. The<br />
decrease in <strong>vascular</strong> plant species <strong>richness</strong> above 750 m may<br />
be explained by the more extreme and harsh conditions<br />
found towards the top <strong>of</strong> the mountain. A source-sink effect<br />
will dampen the change in species composition at an ecotone<br />
and may be at least partly responsible for the surprising<br />
lack <strong>of</strong> any sign <strong>of</strong> an abrupt change in species composition<br />
around the forest limit ecotone. However, if the lack <strong>of</strong><br />
change in CA sample scores for <strong>vascular</strong> <strong>plants</strong> around the<br />
forest line ecotone (Fig. 2a) reflects a real feature <strong>of</strong> beta-diversity<br />
around the forest line we doubt that the source-sink<br />
effect is sufficient to explain the pattern <strong>of</strong> species composition<br />
change around the forest line. An alternative to the<br />
source-sink explanation can be based on the notion that<br />
the climatic forest limit in this area is 100–200 m above the<br />
present boundary due to sheep grazing in the area which has<br />
made it difficult for a forest to establish on the steep hillside.<br />
Climatically, the forest species should therefore have no problems<br />
surviving above the observed forest limit also as<br />
source-populations. The combination <strong>of</strong> sheep grazing and<br />
disturbance due to soil movement on the steep hillside<br />
where the trees are absent means that many alpine species<br />
may be able to establish and grow in the zone where forest<br />
climatically could establish. This may actually cause a decrease<br />
in the species composition change as observed in<br />
Fig. 2a. Against this is that the lack <strong>of</strong> change in species composition<br />
seems to continue well below the forest line. It<br />
should also be noted that in two other Norwegian studies<br />
changes in <strong>richness</strong> and composition <strong>of</strong> <strong>vascular</strong> plant<br />
showed no consistent abrupt changes (H<strong>of</strong>gaard, 1997; Odland<br />
and Birks, 1999).<br />
The lack <strong>of</strong> any pattern in bryophyte <strong>richness</strong> with altitude<br />
is rather surprising. The species composition gradient<br />
in <strong>bryophytes</strong> is as strongly correlated to altitude as it is for<br />
<strong>vascular</strong> <strong>plants</strong> and lichens. Yet there is no evidence <strong>of</strong> any<br />
abrupt change for bryophyte species composition (Fig. 2b).<br />
Bryophytes are known to have the ability to respond to envir-
ACTA OECOLOGICA 29 (2006) 241– 246<br />
245<br />
Fig. 2 – Scatterplots <strong>of</strong> the relationship between sample score from CA and altitude. The line is the fitted line using a cubic<br />
smooth spline (see text for details on the models). The vertical line indicates the forest line at 615 m a.s.l.<br />
onmental variation at fine spatial scales (Alpert, 1985, 1991;<br />
Frego and Carleton, 1995). Hence, the bryophyte species <strong>richness</strong><br />
may be more dependent on the fine scale heterogeneity<br />
within each plot than the coarse scale between plot variations.<br />
Fine scale differences in moisture conditions probably<br />
have a major effect on the bryophyte community but do not<br />
affect <strong>vascular</strong> plant communities to the same extent. The<br />
large variance in species <strong>richness</strong> <strong>of</strong> <strong>bryophytes</strong> at similar altitudes<br />
may just reflect the random variation in types and<br />
number <strong>of</strong> microhabitats for <strong>bryophytes</strong> (Fig. 1c). The number<br />
<strong>of</strong> suitable microhabitats within a plot is probably independent<br />
<strong>of</strong> altitude (at least when excluding epiphytic and<br />
epilithic species) and therefore no relationship between species<br />
<strong>richness</strong> and altitude emerged in this study.<br />
The lichen species <strong>richness</strong> in the area is generally low as<br />
a total <strong>of</strong> 31 lichen species was found in our plots (compared<br />
to 97 species <strong>of</strong> <strong>bryophytes</strong> and 61 species <strong>of</strong> <strong>vascular</strong><br />
<strong>plants</strong>). The decrease in lichen <strong>richness</strong> below the forest limit<br />
may be explained by the low light availability at the ground<br />
level within the forest. As precipitation is generally high in<br />
this area throughout the year, ground-dwelling lichens in<br />
this area are probably not limited by moisture, but rather<br />
light may be limiting lichen growth (Palmquist, 2000), as the<br />
forest becomes denser from forest limit and downwards.<br />
During field work we observed that the cover <strong>of</strong> <strong>bryophytes</strong><br />
increased below the forest limit. Higher bryophyte cover<br />
may have a further negative impact on lichens through competition<br />
for light and space. No evidence for an abrupt<br />
change around the forest line ecotone was found for lichen<br />
species <strong>richness</strong> either. Below the forest line the species <strong>richness</strong><br />
is very low and randomness may be responsible for the<br />
high variance and steep increase in CA-sample scores.<br />
5. Conclusions<br />
Our study emphasises the different altitudinal patterns <strong>of</strong><br />
species <strong>richness</strong> <strong>of</strong> <strong>vascular</strong> <strong>plants</strong>, <strong>bryophytes</strong>, and lichens.<br />
Although the main changes in species composition vary<br />
monotonically with altitude, species <strong>richness</strong> has a more<br />
complex relationship with altitude. Vascular plant species<br />
<strong>richness</strong> peaks immediately above the forest limit, possibly<br />
because the species in the forest have sink populations<br />
above the forest limit co-existing with alpine species in these<br />
areas. For <strong>bryophytes</strong>, the altitudinal gradient in species<br />
composition does not affect the species-<strong>richness</strong> pattern,<br />
probably because <strong>bryophytes</strong> respond to fine-scale environmental<br />
changes. Ground-dwelling lichens thrive poorly in<br />
the light conditions below the forest limit and species <strong>richness</strong><br />
decreases towards the lowlands below the forest limit.<br />
Acknowledgements<br />
We thank H.J.B. Birks and Vigdis Vandvik for valuable<br />
comments on the manuscript. The study was financially<br />
supported by the Norwegian Research Council (NFR), grant<br />
no. 127 594/720.
246 ACTA OECOLOGICA 29 (2006) 241– 246<br />
REFERENCES<br />
Alpert, P., 1985. Distribution quantified by microtopography<br />
in an assemblage <strong>of</strong> saxicolous mosses. Vegetatio 64,<br />
131–139.<br />
Alpert, P., 1991. Microtopography as habitat structure for<br />
mosses on rocks. In: Bell, S.S., McCoy, E.D., Mushinsky, H.<br />
R. (Eds.), Habitat Structure—The Physical Arrangement <strong>of</strong><br />
Objects in Space. Chapman & Hall, London, pp. 120–140.<br />
Culberson, C.F., Kristinsson, H., 1970. A standardized method<br />
for the identification <strong>of</strong> lichen products. J. Chromatogr. 46,<br />
85–93.<br />
Dahl, E., 1998. The Phytogeography <strong>of</strong> Northern Europe (British<br />
Isles, Fennoscandia and Adjacent Areas). Cambridge<br />
University Press, Cambridge.<br />
Dirkse, G.M., Martakis, G.F.P., 1998. <strong>Species</strong> density <strong>of</strong> phanerogams<br />
and <strong>bryophytes</strong> in Dutch forests. Biodivers. Conserv.<br />
7, 147–157.<br />
Førland, E.J., 1993. Nedbørnormaler normalperiode 1961–<br />
1990, Det Norske Meteorologiske Institutt. Universitestforlaget,<br />
Oslo.<br />
Fosaa, A.M., 2004. Biodiversity patterns <strong>of</strong> <strong>vascular</strong> plant species<br />
in mountain vegetation in the Faroe Islands. Divers.<br />
Distrib. 10, 217–223.<br />
Frego, K.A., Carleton, T.J., 1995. Microsite tolerance <strong>of</strong> four<br />
<strong>bryophytes</strong> in a mature black spruce stand: reciprocal<br />
trans<strong>plants</strong>. Bryologist 98, 452–458.<br />
Frisvoll, A.A., Elvebakk, A., Flatberg, K.I., Økland, R.H., 1995.<br />
Sjekkliste over norske mosar. NINA Temahefte 4, 1–101.<br />
Gentry, A.H., 1988. Changes in plant community diversity<br />
and floristic composition on environmental and geographical<br />
gradients. Ann. Mo. Bot. Gard. 75, 1–34.<br />
Grytnes, J.A., 2003. <strong>Species</strong>-<strong>richness</strong> patterns <strong>of</strong> <strong>vascular</strong><br />
<strong>plants</strong> along seven altitudinal transects in Norway. Ecography<br />
26, 291–300.<br />
Grytnes, J.A., Vetaas, O.R., 2002. <strong>Species</strong> <strong>richness</strong> and altitude:<br />
a comparison between simulation models and interpolated<br />
plant species <strong>richness</strong> along the Himalayan altitude<br />
gradient, Nepal. Am. Nat. 159, 294–304.<br />
Hamilton, A.C., 1975. A quantitative analysis <strong>of</strong> altitudinal<br />
zonation in Uganda forests. Vegetatio 30, 99–106.<br />
Hastie, T.J., Tibshirani, R.J., 1990. Generalized Additive Models.<br />
Chapman & Hall, London.<br />
H<strong>of</strong>gaard, A., 1997. Inter-relationships between treeline position,<br />
species diversity, and use and climate in the central<br />
Scandes Mountains <strong>of</strong> Norway. Global Ecol. Biogeogr. 6,<br />
419–429.<br />
Holien, H., 1997. The lichen flora on Picea abies in a suboceanic<br />
spruce forest area in Central Norway with emphasis<br />
on the relationship to site and stand parameters. Nord. J.<br />
Bot. 17, 55–76.<br />
Holtedahl, O., Dons, J.A., 1960. Geological Map <strong>of</strong> Norway<br />
(Bedrock). Norges Geologiske Undersøkelse, Trondheim<br />
(No 208).<br />
Kessler, M., 2000. Elevational gradients in species <strong>richness</strong><br />
and endemism <strong>of</strong> selected plant groups in the central Bolivian<br />
Andes. Plant Ecology 149, 181–193.<br />
Kitayama, K., 1992. An altitudinal transect study <strong>of</strong> the vegetation<br />
on Mount Kinabalu, Borneo. Vegetatio 102, 149–171.<br />
Körner, C., Paulsen, J., 2004. A world-wide study <strong>of</strong> high altitude<br />
treeline temperatures. J. Biogeogr. 31, 713–732.<br />
Lee, T.D., La Roi, G.H., 1979. Gradient analysis <strong>of</strong> <strong>bryophytes</strong><br />
in Jasper National Park, Alberta. Can. J. Bot. 57, 914–925.<br />
Lid, J., Lid, D.T., 1994. Norsk Flora, sixth ed. Det Norske Samlaget,<br />
Oslo.<br />
Lieberman, D., Lieberman, M., Peralta, R., Hartshorn, G.S.,<br />
1996. Tropical forest structure and composition on a<br />
large-scale altitudinal gradient in Costa Rica. J. Ecol. 84,<br />
137–152.<br />
Lomolino, M.V., 2001. Elevational gradients <strong>of</strong> species-density:<br />
historical and prospective views. Global Ecol. Biogeogr.<br />
10, 3–13.<br />
McCullagh, P., Nelder, J.A., 1989. Generalized Linear Models,<br />
second ed. Chapman & Hall, London.<br />
Moen, A., 1999. National Atlas <strong>of</strong> Norway: Vegetation. Norwegian<br />
Mapping Authority, Hønefoss.<br />
Molau, U., Alatalo, J.M., 1998. Responses <strong>of</strong> subarctic-alpine<br />
plant communities to simulated environmental change:<br />
biodiversity <strong>of</strong> <strong>bryophytes</strong>, lichens and <strong>vascular</strong> <strong>plants</strong>.<br />
Ambio 27, 322–329.<br />
Mucina, L., Valachovic, M., Dimopoulos, P., Tribsch, A., Pisut,<br />
I., 2000. Epiphytic lichen and moss vegetation along an altitude<br />
gradient on Mount Aenos (Kefallinia, Greece). Biologia,<br />
Bratislava 55, 43–48.<br />
Odland, A., Birks, H.J.B., 1999. The altitudinal gradient <strong>of</strong> <strong>vascular</strong><br />
plant species <strong>richness</strong> in Aurland, western Norway.<br />
Ecography 22, 548–566.<br />
Palmquist, K., 2000. Carbon economy in lichens. New Phytol.<br />
148, 11–36.<br />
Pausas, J.G., 1994. <strong>Species</strong> <strong>richness</strong> patterns in the understory<br />
<strong>of</strong> Pyrenean Pinus sylvestris forest. J. Veg. Sci. 5, 517–524.<br />
Pharo, E.J., Beattie, A.J., Binns, D., 1999. Vascular plant diversity<br />
as a surrogate for bryophyte and lichen diversity. Conserv.<br />
Biol. 13, 282–292.<br />
Pulliam, H.R., 1988. Sources, sinks, and population regulation.<br />
Am. Nat. 132, 652–661.<br />
Rahbek, C., 1995. The elevational gradient <strong>of</strong> species <strong>richness</strong>:<br />
a uniform pattern? Ecography 18, 200–205.<br />
Santesson, R., Moberg, R., Nordin, A., Tønsberg, T., Vitikainen,<br />
O., 2004. Lichenforming and lichenicolous fungi <strong>of</strong> Fennoscandia.<br />
Museum <strong>of</strong> Evolution, Uppsala University, Uppsala.<br />
Shmida, A., Wilson, M.W., 1985. Biological determinants <strong>of</strong><br />
species diversity. J. Biogeogr. 12, 1–20.<br />
ter Braak, C.J.F., Šmilauer, P., 1998. CANOCO Reference Manual<br />
and User’s Guide to Canoco for Windows: S<strong>of</strong>tware<br />
for Canonical Community Ordination (Version 4). Microcomputer<br />
Power, Ithaca, NY, USA.<br />
Vazquez, J.A., Givnish, T.J., 1998. Altitudinal gradients in the<br />
tropical forest composition, structure, and diversity in the<br />
Sierra de Manantlán. J. Ecol. 86, 999–1020.<br />
Whittaker, R.H., 1960. Vegetation <strong>of</strong> the Siskiyou Mountains,<br />
Oregon and California. Ecol. Monogr. 30, 279–338.<br />
Whittaker, R.H., Niering, W.A., 1975. Vegetation <strong>of</strong> the Santa<br />
Carolina mountains, Arizona. V. Biomass production, and<br />
diversity along the elevational gradient. Ecology 56, 771–<br />
790.<br />
Wolf, J.H.D., 1993. Diversity patterns and biomass <strong>of</strong> epiphytic<br />
<strong>bryophytes</strong> and lichens along altitudinal gradient in the<br />
northern Andes. Ann. Mo. Bot. Gard. 80, 928–960.