NTV Annual Report 2011 - 日本テレビホールディングス株式会社
NTV Annual Report 2011 - 日本テレビホールディングス株式会社
NTV Annual Report 2011 - 日本テレビホールディングス株式会社
Create successful ePaper yourself
Turn your PDF publications into a flip-book with our unique Google optimized e-Paper software.
Message from Management<br />
Market Environment and Overview of Results for the Fiscal Year Ended March 31, <strong>2011</strong><br />
Overview of Results<br />
Although the Great East Japan Earthquake, which struck<br />
in March <strong>2011</strong>, had a major impact on operations for<br />
the fiscal year ended March 31, <strong>2011</strong>, spot revenue—a<br />
component of television advertising revenue—was up<br />
substantially. Consolidated subsidiaries, including Nippon<br />
Television Music Corporation, VAP Inc. and AX-ON Inc., also<br />
boosted revenues. As a result, net sales rose 0.3% during<br />
the year, to ¥297.9 billion. Furthermore, our thoroughgoing<br />
efforts to control costs in all categories bore fruit, and we<br />
posted operating income of ¥31,670 million, up 34.4%. Net<br />
income likewise rose 26.8%, to ¥21,049 million. This was the<br />
first time in 10 years for the Company to record sales and<br />
income increases across the board.<br />
Market Environment<br />
Japan’s total advertising expenditures in 2010 totaled<br />
¥5,842.7 billion (on a calendar basis, according to Dentsu<br />
Inc.), for a 1.3% decline from the previous year and the third<br />
consecutive year of decline—failing to achieve a full-fledged<br />
recovery despite a gradual economic recovery, improved<br />
corporate performance and such large-scale events as the<br />
2010 FIFA World Cup South Africa.<br />
Television advertising expenditures turned around,<br />
however, increasing for the first time in six years and rising<br />
1.1%, to ¥1,732.1 billion, on a recovery in the spot advertising<br />
market. Spot advertising revenues gradually increased from<br />
the beginning of the year, and by the July–September quarter<br />
they had recovered, outpacing the previous year’s level. For<br />
the full year, these revenues were up 6.8%, to ¥1,018.9 billion.<br />
Meanwhile, the unprecedented level of devastation<br />
wrought by the Great East Japan Earthquake in March<br />
<strong>2011</strong> led advertisers to voluntarily hold back on commercial<br />
advertising, which had a substantial impact on performance.<br />
As power shortages and other effects of the earthquake are<br />
likely in the fiscal year ending March 31, 2012, we will pay<br />
special attention to conditions in the market environment.<br />
Achievements in the Fiscal Year Ended March 31, <strong>2011</strong><br />
During the year, <strong>NTV</strong> formulated the 2010 Management<br />
Policy containing its annual objectives, one of which was to<br />
enhance earnings strength and regain the top share of viewer<br />
ratings. We aggressively developed our operations to this end.<br />
To improve viewer ratings, we restructured our timetable<br />
and worked steadily to enhance the content of individual<br />
programs. As a result, we came close to being the top station<br />
in terms of household viewer ratings and boosted our core<br />
target viewer ratings (for viewers between 13 and 49 years of<br />
age). This age group tends to have high purchasing power<br />
and be the most sought-after by advertisers. During the year,<br />
we ranked second across all four categories of viewer ratings:<br />
all day (6:00–24:00), prime time (19:00–23:00), golden time<br />
(19:00–22:00) and non-prime time (6:00–19:00 and 23:00–24:00).<br />
Although these efforts fell short of our goal to achieve the top<br />
level of viewer ratings, we believe that we made substantial<br />
progress in content. The disparity between us and the<br />
broadcaster with the top viewer ratings in the all-day category<br />
was only 0.1 percentage point. The difference was similarly<br />
small in other categories: 0.2 percentage point for prime time,<br />
0.3 percentage point for golden time, and 0.1 percentage<br />
point for non-prime time. Compared with the previous year,<br />
we are clearly closing the gap. Furthermore, we were top in<br />
viewer ratings during the fourth run (from January 3 to April<br />
3, <strong>2011</strong>), as well as on a monthly basis in March <strong>2011</strong>. We plan<br />
to leverage this positive momentum to achieve the top slot in<br />
viewer ratings in the fiscal year ending March 31, 2012.<br />
With this combination of improved ratings and a recovery<br />
in the spot advertising market, our television advertising<br />
revenue grew 1.9% during the year, to ¥209,264 million. Our<br />
growth in spot revenue was particularly robust, rising 11.6%, to<br />
¥103,338 million. This is the highest rate of growth among all<br />
key stations. Also noteworthy was that in the second half, our<br />
spot share exceeded 25% of the total. Meanwhile, our year-onyear<br />
decrease in time advertising revenue grew smaller. This<br />
revenue fell 6.1% as advertisers curtailed fixed expenses, to<br />
¥105,926 million.<br />
10<br />
NIPPON TELEVISION NETWORK<br />
ANNUAL REPORT <strong>2011</strong><br />
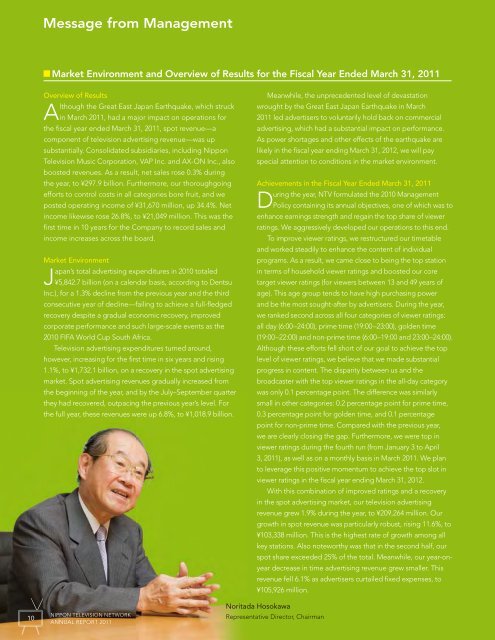
Noritada Hosokawa<br />
Representative Director, Chairman


