NTV Annual Report 2011 - 日本テレビホールディングス株式会社
NTV Annual Report 2011 - 日本テレビホールディングス株式会社
NTV Annual Report 2011 - 日本テレビホールディングス株式会社

You also want an ePaper? Increase the reach of your titles
YUMPU automatically turns print PDFs into web optimized ePapers that Google loves.
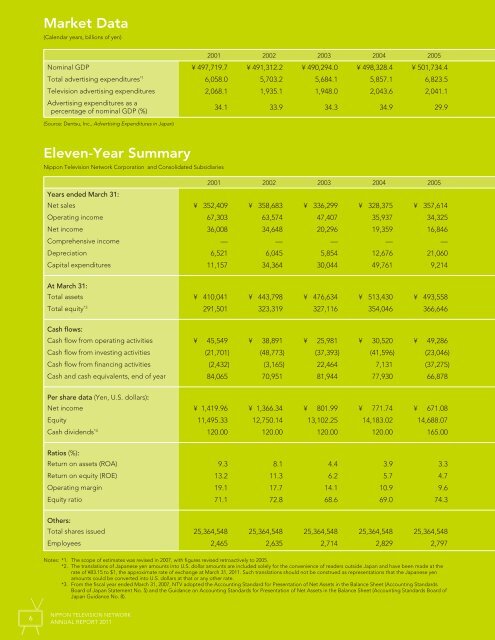
Market Data<br />
(Calendar years, billions of yen)<br />
2001 2002 2003 2004 2005<br />
Nominal GDP ¥ 497,719.7 ¥ 491,312.2 ¥ 490,294.0 ¥ 498,328.4 ¥ 501,734.4<br />
Total advertising expenditures *1 6,058.0 5,703.2 5,684.1 5,857.1 6,823.5<br />
Television advertising expenditures 2,068.1 1,935.1 1,948.0 2,043.6 2,041.1<br />
Advertising expenditures as a<br />
percentage of nominal GDP (%)<br />
34.1 33.9 34.3 34.9 29.9<br />
(Source: Dentsu, Inc., Advertising Expenditures in Japan)<br />
Eleven-Year Summary<br />
Nippon Television Network Corporation and Consolidated Subsidiaries<br />
2001 2002 2003 2004 2005<br />
Years ended March 31:<br />
Net sales ¥ 352,409 ¥ 358,683 ¥ 336,299 ¥ 328,375 ¥ 357,614<br />
Operating income 67,303 63,574 47,407 35,937 34,325<br />
Net income 36,008 34,648 20,296 19,359 16,846<br />
Comprehensive income — — — — —<br />
Depreciation 6,521 6,045 5,854 12,676 21,060<br />
Capital expenditures 11,157 34,364 30,044 49,761 9,214<br />
At March 31:<br />
Total assets ¥ 410,041 ¥ 443,798 ¥ 476,634 ¥ 513,430 ¥ 493,558<br />
Total equity *3 291,501 323,319 327,116 354,046 366,646<br />
Cash flows:<br />
Cash flow from operating activities ¥ 45,549 ¥ 38,891 ¥ 25,981 ¥ 30,520 ¥ 49,286<br />
Cash flow from investing activities (21,701) (48,773) (37,393) (41,596) (23,046)<br />
Cash flow from financing activities (2,432) (3,165) 22,464 7,131 (37,275)<br />
Cash and cash equivalents, end of year 84,065 70,951 81,944 77,930 66,878<br />
Per share data (Yen, U.S. dollars):<br />
Net income ¥ 1,419.96 ¥ 1,366.34 ¥ 801.99 ¥ 771.74 ¥ 671.08<br />
Equity 11,495.33 12,750.14 13,102.25 14,183.02 14,688.07<br />
Cash dividends *4 120.00 120.00 120.00 120.00 165.00<br />
Ratios (%):<br />
Return on assets (ROA) 9.3 8.1 4.4 3.9 3.3<br />
Return on equity (ROE) 13.2 11.3 6.2 5.7 4.7<br />
Operating margin 19.1 17.7 14.1 10.9 9.6<br />
Equity ratio 71.1 72.8 68.6 69.0 74.3<br />
Others:<br />
Total shares issued 25,364,548 25,364,548 25,364,548 25,364,548 25,364,548<br />
Employees 2,465 2,635 2,714 2,829 2,797<br />
Notes: *1. The scope of estimates was revised in 2007, with figures revised retroactively to 2005.<br />
*2. The translations of Japanese yen amounts into U.S. dollar amounts are included solely for the convenience of readers outside Japan and have been made at the<br />
rate of ¥83.15 to $1, the approximate rate of exchange at March 31, <strong>2011</strong>. Such translations should not be construed as representations that the Japanese yen<br />
amounts could be converted into U.S. dollars at that or any other rate.<br />
*3. From the fiscal year ended March 31, 2007, <strong>NTV</strong> adopted the Accounting Standard for Presentation of Net Assets in the Balance Sheet (Accounting Standards<br />
Board of Japan Statement No. 5) and the Guidance on Accounting Standards for Presentation of Net Assets in the Balance Sheet (Accounting Standards Board of<br />
Japan Guidance No. 8).<br />
6<br />
NIPPON TELEVISION NETWORK<br />
ANNUAL REPORT <strong>2011</strong>