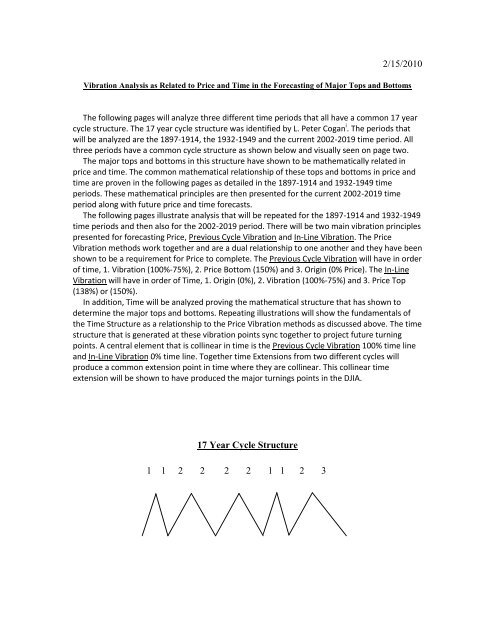
2/15/2010 17 Year Cycle Structure 1 1 2 2 2 2 1 1 2 3
Vibration Analysis as Related to Price and Time in the Forecasting of Major Tops and Bottoms
Vibration Analysis as Related to Price and Time in the Forecasting of Major Tops and Bottoms

You also want an ePaper? Increase the reach of your titles
YUMPU automatically turns print PDFs into web optimized ePapers that Google loves.
2/<strong>15</strong>/<strong>2010</strong><br />
Vibration Analysis as Related to Price and Time in the Forecasting of Major Tops and Bottoms<br />
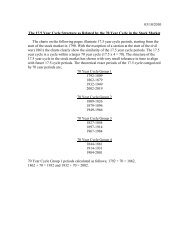
The following pages will analyze three different time periods that all have a common <strong>17</strong> year<br />
cycle structure. The <strong>17</strong> year cycle structure was identified by L. Peter Cogan i . The periods that<br />
will be analyzed are the 1897-1914, the 1932-1949 and the current 2002-2019 time period. All<br />
three periods have a common cycle structure as shown below and visually seen on page two.<br />
The major tops and bottoms in this structure have shown to be mathematically related in<br />
price and time. The common mathematical relationship of these tops and bottoms in price and<br />
time are proven in the following pages as detailed in the 1897-1914 and 1932-1949 time<br />
periods. These mathematical principles are then presented for the current 2002-2019 time<br />
period along with future price and time forecasts.<br />
The following pages illustrate analysis that will be repeated for the 1897-1914 and 1932-1949<br />
time periods and then also for the 2002-2019 period. There will be two main vibration principles<br />
presented for forecasting Price, Previous <strong>Cycle</strong> Vibration and In-Line Vibration. The Price<br />
Vibration methods work together and are a dual relationship to one another and they have been<br />
shown to be a requirement for Price to complete. The Previous <strong>Cycle</strong> Vibration will have in order<br />
of time, 1. Vibration (100%-75%), 2. Price Bottom (<strong>15</strong>0%) and 3. Origin (0% Price). The In-Line<br />
Vibration will have in order of Time, 1. Origin (0%), 2. Vibration (100%-75%) and 3. Price Top<br />
(138%) or (<strong>15</strong>0%).<br />
In addition, Time will be analyzed proving the mathematical structure that has shown to<br />
determine the major tops and bottoms. Repeating illustrations will show the fundamentals of<br />
the Time <strong>Structure</strong> as a relationship to the Price Vibration methods as discussed above. The time<br />
structure that is generated at these vibration points sync together to project future turning<br />
points. A central element that is collinear in time is the Previous <strong>Cycle</strong> Vibration 100% time line<br />
and In-Line Vibration 0% time line. Together time Extensions from two different cycles will<br />
produce a common extension point in time where they are collinear. This collinear time<br />
extension will be shown to have produced the major turnings points in the DJIA.<br />
<strong>17</strong> <strong>Year</strong> <strong>Cycle</strong> <strong>Structure</strong><br />
1 1 2 2 2 2 1 1 2 3
1897-1914 <strong>17</strong> <strong>Year</strong> <strong>Cycle</strong><br />
1932-1949 <strong>17</strong> <strong>Year</strong> <strong>Cycle</strong><br />
2002-2019 <strong>17</strong> <strong>Year</strong> <strong>Cycle</strong>
Determining in Time the 1907 Low Using the Previous <strong>Cycle</strong> Vibration<br />
Step 1: Set as 0% Time<br />
(Horizontal) at the<br />
100%-75% Price<br />
Vibration in the previous<br />
cycle.<br />
Step 2: Set the target of the<br />
present cycle which is the start<br />
of the next cycle, 0% for the<br />
Low in Price, but for now as<br />
100% in Time.<br />
Step 3: Project in Time<br />
(horizontal) 250%.<br />
The 1907 Low can be determined in part by finding the 100%-75% Price Vibration and setting this to 0%<br />
in Time, then find the 1903 low and setting this to 100% in Time and then projecting in time 250%. It will<br />
be shown why the 250% determines the 1907 low.
Step 1:<br />
Locate the<br />
100%-75%<br />
Price<br />
Vibration<br />
(vertical) in<br />
the previous<br />
cycle.<br />
Determining the 1906 High using the Previous <strong>Cycle</strong> Vibration<br />
Step 3: Locate the target, 0%<br />
for the High in Price.<br />
Step 2: Locate the start of the<br />
present cycle, <strong>15</strong>0% for the<br />
Low in Price.<br />
Determining the In-Line (Dual) Vibration with 138% Price Projection<br />
Step 3: Locate then the target<br />
of the present cycle which is<br />
the start of the next cycle,<br />
138% for the High in Price.<br />
Step 1: Locate the Origin of<br />
the cycle, 0% in Price Low.<br />
Step 2: Locate the 100%-75%<br />
vibration in Price.<br />
Determining in Time the 1907 Low Using the In-Line <strong>Cycle</strong> Vibration<br />
Step 3: Project in<br />
Time (horizontal)<br />
250%.<br />
Step 1: Set<br />
the 0% Time<br />
at the Origin<br />
of the In-Line<br />
Price <strong>Cycle</strong><br />
0%.<br />
Step 2: Set the 100% Time at the<br />
100%-75% vibration in Price.
Comparison of Both <strong>Cycle</strong> Charts and Determining in Time the 1907 Low<br />
Step 1: The 100%<br />
Time projection<br />
from the Previous<br />
<strong>Cycle</strong> vibration is<br />
collinear with the<br />
0% Time<br />
projection from<br />
the In-Line Time<br />
projection.<br />
Step 2: 250% Time Projections<br />
originating from different cycle<br />
vibration time periods (red is from<br />
Previous <strong>Cycle</strong> vibration, p.3 and<br />
blue is from In-Line <strong>Cycle</strong><br />
vibration, p. 4) are Collinear in<br />
Time both at the 1907 Low.<br />
There is a phenomena taking place for these time cycles as shown above, 100% and 0% alignment in Time<br />
will determine the 1907 Low at a common 250% extension in Time.
Determining in Time the 1942 Low Using the Previous <strong>Cycle</strong> Vibration<br />
Step 1: Set as 0% Time<br />
(Horizontal) at the 100%-75%<br />
Price Vibration in the previous<br />
cycle.<br />
Step 2: Set the target of the present cycle<br />
which is the start of the next cycle, 0% for the<br />
Low in Price, but for now as 100% in Time.<br />
Step 3:<br />
Project in<br />
Time<br />
(horizontal)<br />
300%.<br />
The 1942 Low can be determined in part by finding the 100%-75% Price Vibration and setting this to 0%<br />
in Time, then find the 1938 low and setting this to 100% in Time and then projecting in time 300%. It will<br />
be shown why the 300% determines the 1942 low
Step 1:<br />
Locate the<br />
100%-75%<br />
Price<br />
Vibration<br />
(vertical) in<br />
the previous<br />
cycle.<br />
. Determining the 1939 High Using the Previous <strong>Cycle</strong> Vibration<br />
Step 3: Locate then the target<br />
of the present cycle which is<br />
the start of the next cycle,<br />
0% for the High in Price.<br />
Step 2: Locate the start of the<br />
present cycle, <strong>15</strong>0% for the<br />
Low in Price.<br />
Determining the In-Line (Dual) Vibration with 138% Price Projection<br />
Step 3: Project in<br />
Price at the 138%<br />
Price Level.<br />
Step 1: Locate the start of<br />
the cycle, 0% in Price Low<br />
(vertical).<br />
Step 2: Locate the 100%-75%<br />
vibration in Price.<br />
Determining in Time the 1942 Low Using the In-Line <strong>Cycle</strong> Vibration<br />
Step 2: Set the<br />
100% Time at<br />
the 100%-75%<br />
vibration in<br />
Price.<br />
Step 1: Set<br />
the 0% Time<br />
at the Origin<br />
of the In-Line<br />
<strong>Cycle</strong> 0%.<br />
Step 3: Project in<br />
Time (horizontal)<br />
300%.
The 100%<br />
Time<br />
projection<br />
from the<br />
Previous<br />
<strong>Cycle</strong><br />
vibration is<br />
collinear with<br />
the 0% Time<br />
projection<br />
from the In-<br />
Line Time<br />
projection.<br />
Comparison of Both <strong>Cycle</strong> Charts and Determining in Time the 1942 Low<br />
300% Time Projections from<br />
originating from different cycle<br />
vibration time periods (red is from<br />
Previous <strong>Cycle</strong> vibration and blue<br />
is from In-Line <strong>Cycle</strong> vibration)<br />
are Collinear in Time both at the<br />
1942 Low.<br />
There is a phenomena taking place for these time cycles as shown above, the 100% and 0% alignment in<br />
Time will determine the 1942 Low at a common 300% extension in Time.
Forecasting in Time the June 2013 Low Using the Previous <strong>Cycle</strong> Vibration<br />
Step 3: Project in Time<br />
(horizontal) 250%.<br />
Step 1: Set as 0% Time<br />
(Horizontal) at the<br />
100%-75% Price<br />
Vibration in the previous<br />
cycle.<br />
Step 2: Set the target of the<br />
present cycle which is the start<br />
of the next cycle, 0% for the<br />
Low in Price, but for now as<br />
100% in Time.<br />
The 2013 Low can be determined in part by finding the 100%-75% Price Vibration and setting this to 0%<br />
in Time, then find the 2009 low and setting this to 100% in Time and then projecting in time 250%. It will<br />
be shown why the 250% should determine the June 2013 low on page 11.
Step 1:<br />
Locate the<br />
100%-<br />
75% Price<br />
Vibration<br />
(vertical)<br />
in the<br />
previous<br />
cycle.<br />
Forecasting the 2011 High Using the Previous <strong>Cycle</strong> Vibration<br />
Step 2: Locate the start of the<br />
present cycle, <strong>15</strong>0% for the<br />
Low in Price.<br />
Step 3: Locate then the target,<br />
0% for the High in Price,<br />
forecasted 2011 High of<br />
~11,640.<br />
Forecasting the In-Line (Dual) Vibration with 138% Price Projection<br />
Step 3: Project in<br />
Price at the 138%<br />
Price Level,<br />
forecasted 2011<br />
Price High of<br />
~12,100.<br />
Step 1: Locate the start of<br />
the cycle, 0% in Price Low<br />
(vertical), the March 2009<br />
Low.<br />
Step 2: Locate the 100%-75%<br />
vibration in Price, forecasted<br />
taking place ~11/<strong>2010</strong>.<br />
Forecasting in Time the 2013 Low Using the In-Line <strong>Cycle</strong> Vibration<br />
Step 3: Project in<br />
Time (horizontal)<br />
250%.<br />
Step 1: Set<br />
the 0% Time<br />
at the Origin<br />
of the In-Line<br />
<strong>Cycle</strong> 0%.<br />
Step 2: Set the 100% Time at the<br />
100%-75% vibration in Price.
The 100% Time projection from the<br />
Previous <strong>Cycle</strong> vibration is collinear with<br />
the 0% Time projection from the In-Line<br />
Time projection.<br />
Comparison of Both <strong>Cycle</strong> Charts and Forecasting in Time the 2013 Low<br />
250% Time Projections from<br />
originating from different cycle<br />
vibration time periods (red is from<br />
Previous <strong>Cycle</strong> vibration and blue<br />
is from In-Line <strong>Cycle</strong> vibration)<br />
are Collinear in Time both at the<br />
forecasted June 2013 Low.<br />
There is a phenomena taking place for these time cycles as shown above, the 100% and 0% alignment in<br />
Time should determine the 2013 Low at a common extension in Time, that being 250%.
The 100% Time projection from the<br />
Previous <strong>Cycle</strong> vibration is collinear with<br />
the 0% Time projection from the In-Line<br />
Time projection.<br />
Calculating in Time the 2011 High<br />
300% Time Projections originating<br />
from different cycle vibration time<br />
periods (red is from Previous <strong>Cycle</strong><br />
vibration and blue is from In-Line<br />
<strong>Cycle</strong> vibration) are both Collinear<br />
in Time at the Q3 2011 High.<br />
There is a phenomena taking place for these time cycles as shown above, the 100% and 0% alignment in<br />
Time should determine the Q3 2011 High at a common extension in Time, that being 300%.
Step 1: Set as 0% Time<br />
(Horizontal) at the 100%-75%<br />
Price Vibration in the previous<br />
cycle.<br />
Calculating in Time the 1946 High<br />
Step 2: Set the target, 0% for<br />
the Low in Price, but for now<br />
as 100% in Time.<br />
Step 3: Locate then the target<br />
of the present cycle which is<br />
the start of the next cycle, 0%<br />
for the Low in Price.<br />
Step 3: 250% Time Projections<br />
from originating from different<br />
cycle vibration time periods (red is<br />
from Previous <strong>Cycle</strong> vibration and<br />
blue is from In-Line <strong>Cycle</strong><br />
vibration) are Collinear in Time<br />
both at the June 1946 High.<br />
Step 1: Set<br />
the 0% Time<br />
at the Origin<br />
of the In-Line<br />
<strong>Cycle</strong> 0%.<br />
Step 2: Set the 100% Time at the<br />
100%-75% vibration in Price.
Step 1: Set as 0% Time<br />
(Horizontal) at the 100%-75%<br />
Price Vibration in the previous<br />
cycle, forecasted November<br />
<strong>2010</strong>.<br />
Calculating in Time the 20<strong>17</strong> High<br />
Step 2: Set the target of the<br />
present cycle which is the start<br />
of the next cycle, 0% for the<br />
Low in Price, but for now as<br />
100% in Time, this is the<br />
forecasted June 2013 Low.<br />
Step 3: 250% Time Projections<br />
from originating from different<br />
cycle vibration time periods (red is<br />
from Previous <strong>Cycle</strong> vibration and<br />
blue is from In-Line <strong>Cycle</strong><br />
vibration) are Collinear in Time<br />
both at the forecasted Q1 20<strong>17</strong><br />
High.<br />
Step 1: Set the<br />
0% Time at the<br />
Origin of the In-<br />
Line <strong>Cycle</strong> 0%.<br />
This is the for<br />
forecasted June<br />
2013 Low.<br />
Step 2: Set the 100% Time at the<br />
100%-75% vibration in Price.
DJIA Forecast <strong>2010</strong>-20<strong>17</strong><br />
Q3 2011 High<br />
~11,640-12,100<br />
DJIA Projection Line Forecast in<br />
Price & Time<br />
June/July <strong>2010</strong> High<br />
~10,600<br />
Q1 20<strong>17</strong> High<br />
June 2013 Low<br />
November <strong>2010</strong> Low<br />
~9500<br />
The chart above, based on previous illustrations, forecasts in Price & Time the DJIA. As<br />
time continues, using the mathematical relationships outlined, the Forecast can be<br />
updated to best match the actual Price & Time values.
8/10/11<br />
The current in-line cycle vibration is similar to that of the 1897-1914 cycle where the<br />
1906 high was at the <strong>15</strong>0% price vibration extension.<br />
3<strong>15</strong>% Time Projections from<br />
originating from different cycle<br />
vibration time periods (red is from<br />
Previous <strong>Cycle</strong> vibration and blue<br />
is from In-Line <strong>Cycle</strong> vibration)<br />
are Collinear in Time both at the<br />
forecasted August 2013 Low.
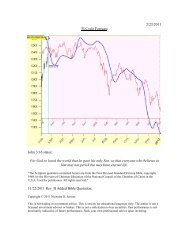
John 3:16 states;<br />
For God so loved the world that he gave his only Son, so that everyone who believes in<br />
him may not perish but may have eternal life.<br />
“The Scripture quotation contained herein are from the New Revised Standard Version bible, copyright,<br />
1989, by the Division of Christian Education of the National Council of the Churches of Christ in the<br />
U.S.A. Used by permission. All rights reserved.”<br />
Copyright © <strong>2010</strong> by Nicholas D. Savino<br />
Copyright © 2011 by Nicholas D. Savino<br />
Copyright © 2012 by Nicholas D. Savino<br />
Copyright © 2013 by Nicholas D. Savino<br />
This is not trading or investment advice. This is strictly for educational purposes only.<br />
The author is not a licensed investment advisor or broker. This is not a solicitation to buy<br />
securities. Past performance is not necessarily indicative of future performance. Seek<br />
your own professional advice upon investing.<br />
2/20/10 Rev_B. Modified charts on p. 13 and added quotations by W.D. Gann on p. <strong>17</strong>.<br />
3/14/10 Rev_C Modified .pdf.<br />
10/<strong>17</strong>/10 Rev_D Added The <strong>15</strong>5° Angle In the <strong>17</strong> <strong>Year</strong> <strong>Cycle</strong> <strong>Structure</strong>.<br />
8/10/11 Rev_E Removed The <strong>15</strong>5° Angle In the <strong>17</strong> <strong>Year</strong> <strong>Cycle</strong> <strong>Structure</strong> and added<br />
updated (8/10/11) chart.<br />
10/5/11 Rev_F Removed calculation of market lows.<br />
1/31/12 Rev_G Modified quotations.<br />
6/20/13 Rev_H Updated chart.<br />
i L. Peter Cogan, The Rhythmic <strong>Cycle</strong>s of Optimism and Pessimism, William-Frederick Press. New York,<br />
1969.