thermal performance of interface material in microelectronics - DigiKey
thermal performance of interface material in microelectronics - DigiKey
thermal performance of interface material in microelectronics - DigiKey

You also want an ePaper? Increase the reach of your titles
YUMPU automatically turns print PDFs into web optimized ePapers that Google loves.
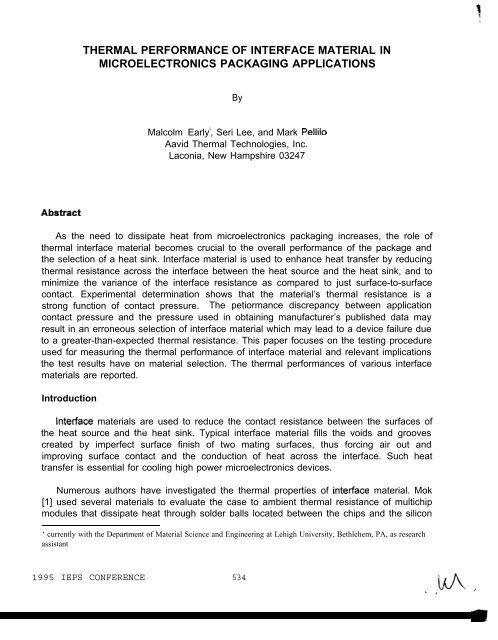
THERMAL PERFORMANCE OF INTERFACE MATERIAL IN<br />
MICROELECTRONICS PACKAGING APPLICATIONS<br />
By<br />
Malcolm Early l , Seri Lee, and Mark Pellilo<br />
Aavid Thermal Technologies, Inc.<br />
Laconia, New Hampshire 03247<br />
As the need to dissipate heat from <strong>microelectronics</strong> packag<strong>in</strong>g <strong>in</strong>creases, the role <strong>of</strong><br />
<strong>thermal</strong> <strong><strong>in</strong>terface</strong> <strong>material</strong> becomes crucial to the overall <strong>performance</strong> <strong>of</strong> the package and<br />
the selection <strong>of</strong> a heat s<strong>in</strong>k. Interface <strong>material</strong> is used to enhance heat transfer by reduc<strong>in</strong>g<br />
<strong>thermal</strong> resistance across the <strong><strong>in</strong>terface</strong> between the heat source and the heat s<strong>in</strong>k, and to<br />
m<strong>in</strong>imize the variance <strong>of</strong> the <strong><strong>in</strong>terface</strong> resistance as compared to just surface-to-surface<br />
contact. Experimental determ<strong>in</strong>ation shows that the <strong>material</strong>’s <strong>thermal</strong> resistance is a<br />
strong function <strong>of</strong> contact pressure. The petiormance discrepancy between application<br />
contact pressure and the pressure used <strong>in</strong> obta<strong>in</strong><strong>in</strong>g manufacturer’s published data may<br />
result <strong>in</strong> an erroneous selection <strong>of</strong> <strong><strong>in</strong>terface</strong> <strong>material</strong> which may lead to a device failure due<br />
to a greater-than-expected <strong>thermal</strong> resistance. This paper focuses on the test<strong>in</strong>g procedure<br />
used for measur<strong>in</strong>g the <strong>thermal</strong> <strong>performance</strong> <strong>of</strong> <strong><strong>in</strong>terface</strong> <strong>material</strong> and relevant implications<br />
the test results have on <strong>material</strong> selection. The <strong>thermal</strong> <strong>performance</strong>s <strong>of</strong> various <strong><strong>in</strong>terface</strong><br />
<strong>material</strong>s are reported.<br />
Introduction<br />
Intetiace <strong>material</strong>s are used to reduce the contact resistance between the surfaces <strong>of</strong><br />
the heat source and thb heat s<strong>in</strong>k. Typical <strong><strong>in</strong>terface</strong> <strong>material</strong> fills the voids and grooves<br />
created by imperfect surface f<strong>in</strong>ish <strong>of</strong> two mat<strong>in</strong>g surfaces, thus forc<strong>in</strong>g air out and<br />
improv<strong>in</strong>g surface contact and the conduction <strong>of</strong> heat across the <strong><strong>in</strong>terface</strong>. Such heat<br />
transfer is essential for cool<strong>in</strong>g high power <strong>microelectronics</strong> devices.<br />
Numerous authors have <strong>in</strong>vestigated the <strong>thermal</strong> properties <strong>of</strong> <strong>in</strong>tetiace <strong>material</strong>. Mok<br />
[1] used several <strong>material</strong>s to evaluate the case to ambient <strong>thermal</strong> resistance <strong>of</strong> multichip<br />
modules that dissipate heat through solder balls located between the chips and the silicon<br />
‘ currently with the Department <strong>of</strong> Material Science and Eng<strong>in</strong>eer<strong>in</strong>g at Lehigh University, Bethlehem, PA, as research<br />
assistant<br />
1995 IEPS CONFERENCE 534<br />
MA ,<br />
i<br />
S*
substrate. The best perform<strong>in</strong>g <strong>material</strong> was ZnO grease, while boron-nitride filled film and<br />
alum<strong>in</strong>a filled film produced unusually high resistance because the contact pressure was<br />
not large enough to force out all the trapped air at the <strong><strong>in</strong>terface</strong>. Ouellette and De Sorgo<br />
[2] analyzed <strong><strong>in</strong>terface</strong> <strong>material</strong> by evaluat<strong>in</strong>g actual operational <strong>thermal</strong> <strong>performance</strong>s<br />
us<strong>in</strong>g transistors mounted <strong>in</strong> TO-3, TO-218, and TO-220 packages. They concluded that<br />
the <strong><strong>in</strong>terface</strong> <strong>material</strong> “appeared” to be less effective than predicted by the <strong>material</strong>’s<br />
<strong>in</strong>tr<strong>in</strong>sic <strong>thermal</strong> properties. The <strong>performance</strong> difference was due to mount<strong>in</strong>g pressure<br />
gradients, heat density gradients, and variations <strong>in</strong> junction temperatures. De Sorgo [3]<br />
cont<strong>in</strong>ued with the transistor packag<strong>in</strong>g application analysis by study<strong>in</strong>g the long term<br />
effect <strong>of</strong> <strong>material</strong> compression. He concluded that <strong><strong>in</strong>terface</strong> <strong>material</strong> only requires contact<br />
pressure to conform to the mat<strong>in</strong>g surfaces and pressure losses over time do not affect the<br />
<strong>performance</strong> <strong>of</strong> the <strong>material</strong>.<br />
Understand<strong>in</strong>g the test methods used to determ<strong>in</strong>e the <strong>thermal</strong> properties <strong>of</strong> <strong><strong>in</strong>terface</strong><br />
<strong>material</strong>s is critical for <strong>material</strong> selection <strong>in</strong> <strong>microelectronics</strong> packag<strong>in</strong>g applications. The<br />
<strong>thermal</strong> properties can be measured by either ASTM test standard D5470-93 or military<br />
specification MIL-I-49456A. Both methods are recognized throughout the <strong>in</strong>dustry as<br />
standards. De Sorgo [4,5] presented a similar test device used to measure <strong>thermal</strong><br />
conductivity and <strong>thermal</strong> impedance (or resistance). High contact pressures (300 psi for<br />
ASTM and 500 psi for MIL SPEC) are used to reduce the effects <strong>of</strong> <strong><strong>in</strong>terface</strong> resistance<br />
generated by trapped air <strong>in</strong> the <strong><strong>in</strong>terface</strong>. The data gathered at high pressures is then<br />
used as the publish <strong>thermal</strong> <strong>performance</strong> characteristics.<br />
In typical <strong>microelectronics</strong> packag<strong>in</strong>g applications, the contact pressure varies between<br />
10 to 50 psi and data provided at 300 psi will be an underestimation <strong>of</strong> <strong>material</strong> <strong>thermal</strong><br />
resistance. Any pressure exceed<strong>in</strong>g 50 psi might damage the packag<strong>in</strong>g itself. To the<br />
best <strong>of</strong> authors’ knowledge, manufacturers do not publish low contact pressure data<br />
because <strong>of</strong> the case dependency <strong>of</strong> <strong><strong>in</strong>terface</strong> resistance. Therefore, to analyze the<br />
<strong>material</strong>’s <strong>performance</strong> at the application contact pressure, an <strong><strong>in</strong>terface</strong> test<strong>in</strong>g apparatus<br />
has been modeled after the aforementioned two standards, but with m<strong>in</strong>or modifications to<br />
measure <strong>thermal</strong> <strong>performance</strong> <strong>of</strong> <strong><strong>in</strong>terface</strong> <strong>material</strong> at low contact pressures. This paper<br />
discusses the method and the relevant implications the test results have on <strong>thermal</strong><br />
<strong><strong>in</strong>terface</strong> <strong>material</strong> selection. A surface contact analysis is also presented to further<br />
characterize the <strong><strong>in</strong>terface</strong> resistance.<br />
Experimental Procedure<br />
The concept beh<strong>in</strong>d measur<strong>in</strong>g the <strong>thermal</strong> <strong>performance</strong> <strong>of</strong> <strong><strong>in</strong>terface</strong> <strong>material</strong> is straight<br />
forward. A reference calorimeter is used to measure the heat through the <strong>material</strong>. Other<br />
calorimeters are used to create a l<strong>in</strong>ear extrapolation to f<strong>in</strong>d the temperature drop across<br />
the <strong>material</strong> surfaces. With this set <strong>of</strong> <strong>in</strong>formation, <strong>in</strong> addition to the cross sectional area,<br />
the <strong>thermal</strong> resistance can be calculated, us<strong>in</strong>g the equations summarized <strong>in</strong> Table 1.<br />
535<br />
1995 IEPS CONFERENCE
Heat (Watts)<br />
QCall,2 = kCO11,2<br />
AC.JW,2<br />
Average Heat (Watts)<br />
Q<br />
avg<br />
=<br />
Qcatl + Qca/2<br />
2<br />
Surface Temperature (“C)<br />
T ,,,slltf<br />
=<br />
T’I,, T<br />
(TJ T – ‘6,1O ~d6,7sud<br />
><br />
d 3-6,7-10<br />
Surface Temperature<br />
Difference (“C)<br />
A~ud =<br />
T 6surf<br />
– qud<br />
Cross Sectional Area (m*)<br />
AC. =<br />
~ (0.5~Ca,, + 0.5~ca,2 )2<br />
A<br />
4<br />
Thermal Impedance<br />
(“C m 2 /Watt)<br />
RIA4 =<br />
AT&Aa<br />
Qq<br />
Variables<br />
k~,,, = <strong>thermal</strong> conductivity <strong>of</strong> calorimeter materiai<br />
d. = longitud<strong>in</strong>al distance on calorimeter, see Fig. 2<br />
;~z = slope generated by l<strong>in</strong>ear regression <strong>of</strong><br />
temperature and longitud<strong>in</strong>al distance on<br />
calorimeter 1 or 2<br />
TX= temperature measured at location x<br />
DIIz = diameter <strong>of</strong> calorimeter 1 or 2<br />
Table 1: Analysis Equations<br />
Figure 1 shows a schematic <strong>of</strong> the test apparatus constructed for this <strong>in</strong>vestigation.<br />
The equipment used <strong>in</strong> the <strong><strong>in</strong>terface</strong> <strong>material</strong> test<strong>in</strong>g <strong>in</strong>clude calorimeters, heater block and<br />
guard heater, complete with heater cartridge, <strong>in</strong>sulation, chiller plate, and a pneumatic<br />
press. Start<strong>in</strong>g with the bottom <strong>of</strong> Figure 1, the guard heater has three cartridge heaters<br />
<strong>in</strong>side it which are connected <strong>in</strong> parallel. Between the guard heater and the heater block is<br />
a 5 millimeter thick circuit board with a FR-4 epoxy rat<strong>in</strong>g. This <strong>material</strong> <strong>thermal</strong>ly and<br />
electrically <strong>in</strong>sulates the guard heater and the heater block while provid<strong>in</strong>g an environment<br />
that allows the heat to flow from the heater block<br />
between the heater block at the lower calorimeter<br />
specimen is located between the upper and lower<br />
through the specimen. The surface<br />
is coated with <strong>thermal</strong> grease. The<br />
calorimeter. On the top side <strong>of</strong> the<br />
1995 IEPS CONFERENCE 536
upper calorimeter is the chiller plate; <strong>thermal</strong> grease is also at the <strong><strong>in</strong>terface</strong> <strong>of</strong> the<br />
calorimeter and the chiller plate, Located atop the chiller plate is the pneumatic press.<br />
Contact pressure is controlled by regulat<strong>in</strong>g the pressure <strong>of</strong> the compressed air to the<br />
pneumatic press. The entire column is wrapped with foam <strong>in</strong>sulation to prevent radial heat<br />
loss.<br />
The heater block and guard heater are made <strong>of</strong> copper while the calorimeters are<br />
Atum<strong>in</strong>um 6160 T6. The calorimeters are cyl<strong>in</strong>drical columns with a 1 <strong>in</strong> 2 cross sectional<br />
area and the surfaces at the specimen <strong><strong>in</strong>terface</strong> have a measured mean surface<br />
roughness value <strong>of</strong> 8.9 pm. The specimen surface is cleaned with alcohol swabs and<br />
<strong>in</strong>spected to check for scratches and divots that might trap air once the specimen comes <strong>in</strong><br />
contact with the surface. The <strong>thermal</strong> <strong>performance</strong> can be greatly deteriorated by the<br />
smallest amount <strong>of</strong> air between the <strong><strong>in</strong>terface</strong>. F<strong>in</strong>ally, Type-T thermocouples are calibrated<br />
before attachment to the calorimeters. Equilibrium temperature measurements are taken<br />
once the change <strong>in</strong> temperature is less than 1 ‘C per ten m<strong>in</strong>utes,<br />
The experimental apparatus varies from the methods described by ASTM test standard<br />
D5470-93 and military specification MIL-I-49456A <strong>in</strong> two ways. First, a reference<br />
calorimeter is not used to calculate heat flux through the specimen. A least square fit is<br />
done on the data recorded from the calorimeter thermocouples to determ<strong>in</strong>e the heat flow<br />
through each calorimeter us<strong>in</strong>g Fourier’s Law <strong>of</strong> Conduction. Figure 3 shows the<br />
temperature measurements <strong>of</strong> the upper and lower calorimeters. The fit reduces the<br />
effects <strong>of</strong> heat gradients at the thermocouple location. Then, the heat flow values are<br />
averaged to determ<strong>in</strong>e the net flow through the specimen. Second, while both methods<br />
test <strong><strong>in</strong>terface</strong> <strong>material</strong> at high contact pressure, the current test apparatus can vary contact<br />
pressure, enabl<strong>in</strong>g low pressure measurements, via a highly accurate and precise air<br />
regulator.<br />
Material Description<br />
Material A, named Kon-Dux TM , is a gray, non-woven fibrous compound consist<strong>in</strong>g <strong>of</strong><br />
graphite and oil. The <strong>material</strong> is pressed together and then rolled for delivery. It can be<br />
cut <strong>in</strong>to a variety <strong>of</strong> shapes by us<strong>in</strong>g a knife or punch die. This <strong>material</strong> is easy to work<br />
with, but has some problems associated with specimen preparation. First, the <strong>material</strong> is<br />
usually delivered <strong>in</strong> large rolls. This method <strong>of</strong> delivery caused defects like crease l<strong>in</strong>es<br />
and surface depressions which changes <strong>material</strong> microstructure and <strong>in</strong>creases <strong>thermal</strong><br />
resistance. Secondly, the <strong>material</strong> is also easy to rip. When cutt<strong>in</strong>g a specimen, special<br />
care must be taken to protect the cutt<strong>in</strong>g edge from fray<strong>in</strong>g. If the edge beg<strong>in</strong>s to fray, it<br />
can be cleared up by gently scrap<strong>in</strong>g <strong>of</strong>f the frayed edges. There is a possibility <strong>of</strong> the<br />
<strong>material</strong> ripp<strong>in</strong>g under the template if care is not taken.<br />
Material B, named A-Dux TM , is a white silicone based <strong>material</strong> used primarily to<br />
elim<strong>in</strong>ate problems associated with <strong>thermal</strong> grease such as contam<strong>in</strong>ation <strong>of</strong> reflow solder.<br />
537<br />
1995 IEPS CONFERENCE
It is highly compressible and compliant, mat<strong>in</strong>g closely with companion surfaces by fill<strong>in</strong>g<br />
voids created by uneven or warped surfaces. It provides a <strong>thermal</strong>ly conductive <strong>in</strong>tetiace<br />
where electrical isolation is not required. This <strong>material</strong> is available with an adhesive on one<br />
or both sides and <strong>in</strong> different sheet sizes. It can be cut <strong>in</strong>to a variety <strong>of</strong> shapes by us<strong>in</strong>g a<br />
knife or by us<strong>in</strong>g a punch die. When cutt<strong>in</strong>g with a knife a stiff clear plastic release paper<br />
on one side must be removed.<br />
Material C is a white <strong>material</strong> which uses a highly compressible, elastic carrier for<br />
floroether oil. The <strong>material</strong> is distributed <strong>in</strong> small sheets with release paper on front and<br />
back. Special care must be taken when us<strong>in</strong>g the <strong>material</strong>, because it is highly elastic. The<br />
<strong>material</strong> is likely to stretch when remov<strong>in</strong>g one piece <strong>of</strong> release paper. It is not easy to cut<br />
with a knife and cannot be cut with a punch die because <strong>of</strong> its elasticity. When cutt<strong>in</strong>g,<br />
score the <strong>material</strong> several times before attempt<strong>in</strong>g to cut through. Once the sample is cut,<br />
very special care must be taken for handl<strong>in</strong>g. Once removed from the release paper, the<br />
<strong>material</strong> loses its rigidity and will likely fold onto itself, render<strong>in</strong>g the sample unusable<br />
because it will stretch and deform. If the <strong>material</strong> is cut us<strong>in</strong>g a sample calorimeter as a<br />
template, the sample should be cut slightly larger that the template to compensate for<br />
<strong>material</strong> shr<strong>in</strong>kage. The <strong>material</strong> shr<strong>in</strong>ks when removed from either the template or the<br />
release paper.<br />
Results and Discussion<br />
To accurately acquire <strong>thermal</strong> resistance data from a variety <strong>of</strong> <strong><strong>in</strong>terface</strong> <strong>material</strong>s, tests<br />
were repeated us<strong>in</strong>g samples taken from different batch sheets to ensure manufacture<br />
consistency. Six samples <strong>of</strong> each <strong>material</strong> were analyzed. The results are plotted <strong>in</strong><br />
Figure 4 with range bars, and the average <strong>thermal</strong> <strong>performance</strong> <strong>of</strong> the four <strong>material</strong>s and<br />
the bare surface case appear <strong>in</strong> Table 2.<br />
Figure 4 shows the <strong>thermal</strong> resistance as a function <strong>of</strong> contact pressure. As expected,<br />
the resistance decreases as the pressure <strong>in</strong>creases. Generally, the resistance at low<br />
application pressure was three times the published manufacturer’s data. All the <strong>material</strong>s<br />
perform better than the bare surface contact except for Material B. This is a result <strong>of</strong><br />
thickness variation between manufacturer’s and measured data. The <strong>material</strong> tested was<br />
50% thicker than specified by the manufacturer. An assumption was made that the<br />
resistance would be 5040 greater based on the l<strong>in</strong>ear relationship between <strong>material</strong><br />
thickness and <strong>thermal</strong> conductivity.<br />
Materials A and C help to significantly reduce the <strong><strong>in</strong>terface</strong> resistance at low contact<br />
pressure compared to high pressures. Thermal grease shows the lowest resistance and its<br />
petiormance is virtually <strong>in</strong>dependent <strong>of</strong> the contact pressure. Interface <strong>material</strong> can be<br />
compared to see<br />
<strong>material</strong> handl<strong>in</strong>g,<br />
which provides the lowest resistance relative to application pressure,<br />
cost and availability.<br />
1995 IEPS CONFERENCE 538
.<br />
Interface Material<br />
Thickness<br />
. Type Description m<br />
A* graphite and oil sheet 0.005<br />
B 3 silicone sheet 0.006 4<br />
C 5 floroether oil sheet 0.007<br />
Grease 7 synthetic grease nfa<br />
Bare Calorimeter Surfaces nla<br />
Thermal Resistance (“C <strong>in</strong> 2 /W)<br />
Contact Pressure (psi)<br />
M9JMa Bx ZIIMMI. IZ5MQ<br />
0.17 0.62 0.58 0.38 0.29 0.28 0.25 0.20<br />
0.75 1.81 1.72 1.60 1.40 1.25 1.18 0.80<br />
nlae 1.10 0.98 0.84 0.71 0.67 0.65 0.44<br />
0.19 .274 .206 .2.20 .193 ,194 .193 .180<br />
nla 1.74 1.57 1.23 1.08 0.89 0.83 0.53<br />
Note: n/a means not available or not applicable.<br />
Table 2: Thermal Performance <strong>of</strong> Interface Material.<br />
The bare surface measurements serve as a basel<strong>in</strong>e for <strong><strong>in</strong>terface</strong> <strong>material</strong> comparison.<br />
The measurement is only valid for these two particular calorimeters because <strong>of</strong> uniqueness<br />
<strong>of</strong> their surface flatness and roughness. For conform<strong>in</strong>g rough surfaces, the surface-tosurface<br />
contact resistance can be estimated us<strong>in</strong>g the follow<strong>in</strong>g equation[6]:<br />
1 1 1<br />
— . —<br />
R, ‘Rc+Rg<br />
where Rj is the total jo<strong>in</strong>t contact resistance with the conduction resistance through the<br />
<strong>in</strong>timate solid contacts between mat<strong>in</strong>g surfaces R c<br />
and the gap resistance through the<br />
<strong>in</strong>terstitial fluid R g<br />
determ<strong>in</strong>ed from<br />
2<br />
Aavid Thermal Technologies product KON-DUX TM .<br />
3<br />
Aavid Thermal Technologies product A-DUXTM,<br />
4<br />
thickness quoted at 0.004 <strong>in</strong> by the manufacturer; it is assumed that the thicker sample has a proportional <strong>in</strong>crease <strong>in</strong><br />
<strong>thermal</strong> resistance.<br />
5<br />
commercially non-available <strong>material</strong>.<br />
6<br />
manufacturer’s data unavailable at time <strong>of</strong> pr<strong>in</strong>t<strong>in</strong>g.<br />
7<br />
Aavid Thermal Technologies product SIL-FREE TM .<br />
539 1995 IEPS CONFERENCE
1 k,A<br />
~= Y+OA4<br />
where k~ is the harmonic mean solid conductivity, kf the <strong>in</strong>terstitial fluid conductivity, P the<br />
apparent contact pressure, H the hardness <strong>of</strong> the s<strong>of</strong>ter solid, o the RMS surface<br />
roughness, m the mean asperity slope, and A is the apparent surface area. For air, the<br />
gas rarefaction parameter /M = 0.081, and the distance between mean planes <strong>of</strong> the<br />
contact<strong>in</strong>g surfaces, Y, is given as<br />
() P -0.097<br />
Y = 1.530 — H<br />
The resistances, & R g<br />
and R j<br />
are calculated us<strong>in</strong>g the above correlations and<br />
compared <strong>in</strong> Table 3 with R~xp measured for the bare surface case. As can be seen from<br />
the table, R *XP is an order <strong>of</strong> magmtude greater than the computed R j<br />
, but always less<br />
than the gap resistance R g<br />
, <strong>in</strong>dicat<strong>in</strong>g that the surfaces were not flat, and the <strong><strong>in</strong>terface</strong><br />
must had a substantial area be<strong>in</strong>g covered with air entrapments. This is further evidenced<br />
by the trend <strong>of</strong> Rexp which is typical <strong>of</strong> non-flat surface contacts. At a low pressure <strong>of</strong> 8<br />
psi, RexP is nearly equal to R g<br />
, <strong>in</strong>dicat<strong>in</strong>g that only a small portion <strong>of</strong> the surface area<br />
experienced <strong>in</strong>timate contact. As the applied pressure <strong>in</strong>creased, it is expected that a<br />
greater portion <strong>of</strong> the area will be <strong>in</strong> contact as the surfaces go through an elastic<br />
deformation. Consequently, the resistance will fall closer to that <strong>of</strong> the conform<strong>in</strong>g rough<br />
surfaces, as shown <strong>in</strong> Table 3.<br />
Applied Pressure<br />
(psi)<br />
.<br />
8<br />
36<br />
71 ~<br />
106<br />
141<br />
175<br />
350<br />
Thermal Resistance (“C <strong>in</strong>z/VV)<br />
R c<br />
Ra R j<br />
R,<br />
xD<br />
0.663 2.178 0.509 1.74<br />
0.159 1.888 0.147 1.57<br />
0.083 1.771 0.080 1.23<br />
0.057 1.705 0.055 1.08<br />
0.043 1.660 0.042 0.89<br />
0.035 1.626 0.035 0.83<br />
0.018 1.523 0.018 0.53<br />
., .<br />
Table 3: Computed and Measured Thermal Resistances<br />
for Bare Surface Contact<br />
1995 IEPS CONFERENCE 540
Materials A and C help to significantly reduce the <strong><strong>in</strong>terface</strong> resistance at low contact<br />
pressure compared to high pressures. Intetiace <strong>material</strong> can be compared to see which<br />
provides the lowest resistance relative to application pressure, <strong>material</strong> handl<strong>in</strong>g, cost and<br />
availability.<br />
The effects <strong>of</strong> <strong><strong>in</strong>terface</strong> resistance are large at low contact pressure, and they will be<br />
equivalently large <strong>in</strong> <strong>microelectronics</strong> packag<strong>in</strong>g applications where typical contact<br />
pressure ranges from 10 to 50 psi. The magnitude <strong>of</strong> the resistance will vary as a function<br />
<strong>of</strong> contact pressure, surface f<strong>in</strong>ish, and <strong><strong>in</strong>terface</strong> <strong>material</strong>. Also, the larger area <strong>of</strong> the<br />
<strong><strong>in</strong>terface</strong> <strong>material</strong>, the greater the chance <strong>of</strong> trapp<strong>in</strong>g air when apply<strong>in</strong>g the <strong>material</strong> to the<br />
surfaces. Any trapped air will result <strong>in</strong> an <strong>in</strong>crease <strong>of</strong> <strong><strong>in</strong>terface</strong> resistance.<br />
Conclusion<br />
The results show that data collected at high contact pressure does not provide an<br />
accurate representation <strong>of</strong> <strong><strong>in</strong>terface</strong> <strong>material</strong> resistance <strong>in</strong> the pressure range typically<br />
observed <strong>in</strong> <strong>microelectronics</strong> packag<strong>in</strong>g applications. The measured results at low<br />
pressures are approximately three times the published values. Material <strong>thermal</strong><br />
<strong>performance</strong> will be affected ‘ -<br />
by surface f<strong>in</strong>ish, contact pressure, and application properties.<br />
Any trapped air <strong>in</strong><br />
<strong>thermal</strong> resistance.<br />
the application <strong>of</strong> the <strong><strong>in</strong>terface</strong> <strong>material</strong> will result <strong>in</strong> an <strong>in</strong>crease <strong>in</strong><br />
Acknowledgment<br />
The authors would like to thank Miksa De Sorgo,<br />
his advice and multiple discussions perta<strong>in</strong><strong>in</strong>g to the<br />
test methods,<br />
References<br />
Technical Director at Chomerics, for<br />
fundamentals <strong>of</strong> <strong><strong>in</strong>terface</strong> <strong>material</strong> and<br />
1. Mok, L. S., “Thermal Management <strong>of</strong> Silicon-Based Multichip Modules,” Proceed<strong>in</strong>g<br />
<strong>of</strong> the Tenth Annual IEEE Semiconductor Thermal Measurement and Management<br />
Symposium, pp. 59-63, 1994.<br />
2. Ouellette, T., and De Sorgo, M., “Thermal Performance <strong>of</strong> Heat Transfer Interface<br />
Material,” Proceed<strong>in</strong>g <strong>of</strong> the Power Electronics Desian Conference, pp. 134-138,<br />
1985.<br />
541<br />
1995 IEPS CONFERENCE
3. De Sorgo, M., “Thermal Interface Material Applications: Long Term Performance <strong>of</strong><br />
Thermal InterFace Materials under Compression,” Proceed<strong>in</strong>g <strong>of</strong> the Power<br />
Electronics Show and Conference j<br />
pp. 78-81, 1987.<br />
4. De Sorgo, M., and Ouellette, M., “Determ<strong>in</strong>ation <strong>of</strong> Thermal Conductivity <strong>of</strong> Heat<br />
Transfer Interface Material,” Power Conversion and Intelligent Motion, pp. 61-71,<br />
vol. 13, no. 8, 1985.<br />
5. De Sorgo, M., “A Test Device for Measur<strong>in</strong>g Thermal Impedance <strong>of</strong> Heat Transfer<br />
Interface Material,” Power Conversion and I ntelliaent MotiorL pp. 59-62, vol. 13, no.<br />
9, 1985.<br />
6. Yovanovich, M. M., “New Contact and Gap Correlations for Conform<strong>in</strong>g Rough<br />
Surfaces,” AIAA-81-1164, presented at A1/Vl 16th Thermophysics Conference, Palo<br />
Alto, CA, 1981.<br />
.<br />
1995 IEPS CONFERENCE 542
1--1.<br />
El”<br />
. Y<br />
~ Upper Calorimeter<br />
SRecimen . “<br />
Lower Calorimeter<br />
@<br />
4 ● Heater Block<br />
+ Insulation<br />
@@@<br />
~ Guard Heater<br />
@= Heater Cartridge<br />
Figure 1: Experimental Apparatus Used to Measure<br />
Performance <strong>of</strong> Interface Material.<br />
Thermal<br />
Calorimeter 2<br />
Interface Material<br />
Calorimeter 1<br />
T, O<br />
o<br />
4<br />
+-- D2-- d 9-10<br />
T9 ●<br />
v<br />
d 8-9<br />
T 8<br />
●<br />
d<br />
T 7-8<br />
7<br />
●<br />
d7.~uti<br />
T 6<br />
●<br />
T 5<br />
●<br />
T 4<br />
●<br />
A<br />
dG ~uti<br />
d -<br />
d<br />
5-6<br />
4-5<br />
+D1- d 3-4<br />
T 3<br />
●<br />
t<br />
/<br />
d<br />
7-10<br />
d 3-6<br />
Figure 2: Calorimeter<br />
Design and Thermocouple Location.<br />
543 1995 IEPS CONFERENCE
.<br />
.<br />
1’” r<br />
100<br />
90<br />
I<br />
~ Lower Calorimeter_<br />
~ 80<br />
0<br />
E<br />
Specimen -~ !<br />
60<br />
F<br />
50 t ! I ! I I<br />
40w---”pp:rcarOr;meterter<br />
30 - P<br />
20 :<br />
10 -<br />
0.01 0.03 0.05 0.07 0.09 0.11<br />
Thermocouple Position (m)<br />
#<br />
Figure 3: Temperature Distribution across Upper and Lower<br />
Calorimeter and Through the SDecimen.<br />
,<br />
2.0<br />
1.8<br />
1.6<br />
1.4<br />
1.2<br />
1.0<br />
\<br />
Material Type<br />
--+-B<br />
+ Bare<br />
0.8<br />
0.6<br />
0.4<br />
0.2<br />
0.0<br />
\ -t-<br />
1 I<br />
L<br />
r 1 I 1 1 I 1 1 1 I I I I I 1 1 I 1 I t 1 1 I I 1 1 1 I 1 1 1 1 1 t 1 1 I<br />
1 1 I I<br />
0 50 100 150 200 250 300<br />
Contact Pressure (psi)<br />
350 400<br />
Figure 4: Thermal Performance <strong>of</strong> Various Interface<br />
Materials<br />
1995 IEPS CONFERENCE 544