<strong>Neural</strong> <strong>mechanisms</strong> <strong>for</strong> <strong>color</strong> <strong>perception</strong> <strong>in</strong> <strong>the</strong> <strong>primary</strong> <strong>visual</strong> <strong>cortex</strong> V1 Shapley and Hawken 427 Figure 1 Receptive field models <strong>for</strong> <strong>color</strong> responsive neurons. (a) S<strong>in</strong>gle-opponent red–green sensitive neurons receive <strong>in</strong>puts from L and M cones that are opposite <strong>in</strong> sign, but signals from each cone type are all <strong>the</strong> same sign. As an example an M+ L– neuron is depicted. Such neurons are found <strong>in</strong> <strong>the</strong> parvocellular layers of <strong>the</strong> LGN and <strong>in</strong> V1. (b) Hypo<strong>the</strong>tical double-opponent neurons that receive both excitation and <strong>in</strong>hibition from each s<strong>in</strong>gle cone <strong>in</strong>put. It was orig<strong>in</strong>ally thought that <strong>the</strong>se would be exactly balanced and arranged <strong>in</strong> a center-surround geometry as shown here. (c) Proposed sensitivity profile <strong>for</strong> a <strong>color</strong>lum<strong>in</strong>ance neuron that is double-opponent. Here, each cone sends signals that are opposite <strong>in</strong> sign, but are not precisely balanced <strong>in</strong> strength. In addition, <strong>the</strong> spatial symmetry is no longer <strong>the</strong> same as <strong>for</strong> a center-surround neuron but resembles <strong>the</strong> spatial receptive fields of o<strong>the</strong>r cortical cells <strong>for</strong> black–white stimuli. (a) S<strong>in</strong>gle-opponent cell (b) Hypo<strong>the</strong>tical (c) double-opponent cell L cone M cone L cone M cone Color-lum<strong>in</strong>ance double-opponent cell L cone M cone Current Op<strong>in</strong>ion <strong>in</strong> Neurobiology <strong>in</strong>duction of <strong>color</strong> <strong>in</strong>to a gray region by surround<strong>in</strong>g <strong>color</strong>, also require additional neuronal elements that respond preferentially to <strong>color</strong> boundaries and that send this signal around <strong>the</strong> <strong>cortex</strong> to propagate <strong>the</strong> boundary’s effect <strong>in</strong>to perceived regions. Color boundary effects have been thought previously to depend upon double-opponent <strong>color</strong>-sensitive neurons <strong>in</strong> V1 [17,18]. Such neurons were thought to be circularly symmetric, with center and surround <strong>mechanisms</strong> each <strong>color</strong>-opponent but opposite <strong>in</strong> sign one to ano<strong>the</strong>r. For <strong>in</strong>stance, <strong>the</strong> center might be M+L–, but <strong>the</strong> surround would be L+M–, as illustrated <strong>for</strong> a hypo<strong>the</strong>tical doubleopponent cell <strong>in</strong> Figure 1b. Such neurons were hypo<strong>the</strong>sized and <strong>the</strong>n reported <strong>in</strong> a number of earlier studies of macaque V1 [18,19], but more recent studies with large samples of V1 cells have found very few neurons that have a receptive field organization like that shown <strong>in</strong> Figure 1b [20 • ,21 • ]. V1: lum<strong>in</strong>ance, <strong>color</strong>-lum<strong>in</strong>ance and <strong>color</strong>-preferr<strong>in</strong>g cells In a recent study of a population of 167 macaque V1 neurons, done <strong>in</strong> collaboration with our graduate student Elizabeth Johnson, we looked <strong>for</strong> double-opponent neurons <strong>in</strong> V1 [22 •• ]. We used s<strong>in</strong>e grat<strong>in</strong>g patterns as stimuli, <strong>in</strong> part because <strong>the</strong>y were effective <strong>in</strong> excit<strong>in</strong>g most V1 neurons. We compared <strong>the</strong> responses to achromatic, black–white patterns with responses to red–green equilum<strong>in</strong>ant grat<strong>in</strong>gs, as a function of spatial frequency. The measurement of <strong>the</strong> spatial frequency response function allows one to test <strong>for</strong> s<strong>in</strong>gle-opponency versus Figure 2 Demonstration of <strong>the</strong> effect of boundaries on <strong>color</strong> <strong>perception</strong>. Three identical green circular regions are immediately surrounded by small square-shaped regions of low, medium and high brightness, that appear black, gray, and white, respectively. The appearance of <strong>the</strong> green changes substantially because of <strong>the</strong> brightness of <strong>the</strong> region around <strong>the</strong> boundary. Far from <strong>the</strong> boundary, <strong>the</strong> surround<strong>in</strong>g region is <strong>the</strong> same <strong>for</strong> all three, ano<strong>the</strong>r mid-gray. To most observers, <strong>the</strong> green circle on <strong>the</strong> gray background appears a more saturated green than <strong>the</strong> green circles on black or white backgrounds. This effect is best seen on a CRT screen from <strong>the</strong> .pdf file of this article. Current Op<strong>in</strong>ion <strong>in</strong> Neurobiology
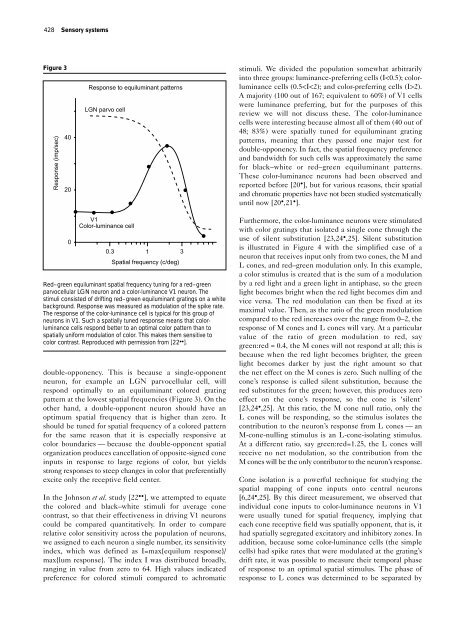
428 Sensory systems Figure 3 Response (imp/sec) 40 20 Response to equilum<strong>in</strong>ant patterns LGN parvo cell stimuli. We divided <strong>the</strong> population somewhat arbitrarily <strong>in</strong>to three groups: lum<strong>in</strong>ance-preferr<strong>in</strong>g cells (I