Neural mechanisms for color perception in the primary visual cortex
Neural mechanisms for color perception in the primary visual cortex
Neural mechanisms for color perception in the primary visual cortex

Create successful ePaper yourself
Turn your PDF publications into a flip-book with our unique Google optimized e-Paper software.
430 Sensory systems<br />
Figure 5<br />
Spatial maps of excitatory responses<br />
L +<br />
Mapp<strong>in</strong>g<br />
stimuli<br />
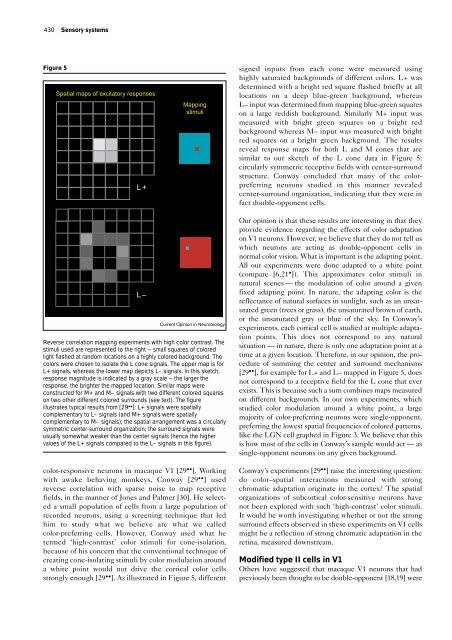
signed <strong>in</strong>puts from each cone were measured us<strong>in</strong>g<br />
highly saturated backgrounds of different <strong>color</strong>s. L+ was<br />
determ<strong>in</strong>ed with a bright red square flashed briefly at all<br />
locations on a deep blue-green background, whereas<br />
L– <strong>in</strong>put was determ<strong>in</strong>ed from mapp<strong>in</strong>g blue-green squares<br />
on a large reddish background. Similarly M+ <strong>in</strong>put was<br />
measured with bright green squares on a bright red<br />
background whereas M– <strong>in</strong>put was measured with bright<br />
red squares on a bright green background. The results<br />
reveal response maps <strong>for</strong> both L and M cones that are<br />
similar to our sketch of <strong>the</strong> L cone data <strong>in</strong> Figure 5:<br />
circularly symmetric receptive fields with center-surround<br />
structure. Conway concluded that many of <strong>the</strong> <strong>color</strong>preferr<strong>in</strong>g<br />
neurons studied <strong>in</strong> this manner revealed<br />
center-surround organization, <strong>in</strong>dicat<strong>in</strong>g that <strong>the</strong>y were <strong>in</strong><br />
fact double-opponent cells.<br />
L –<br />
Current Op<strong>in</strong>ion <strong>in</strong> Neurobiology<br />
Reverse correlation mapp<strong>in</strong>g experiments with high <strong>color</strong> contrast. The<br />
stimuli used are represented to <strong>the</strong> right — small squares of <strong>color</strong>ed<br />
light flashed at random locations on a highly <strong>color</strong>ed background. The<br />
<strong>color</strong>s were chosen to isolate <strong>the</strong> L cone signals. The upper map is <strong>for</strong><br />
L+ signals, whereas <strong>the</strong> lower map depicts L– signals. In this sketch,<br />
response magnitude is <strong>in</strong>dicated by a gray scale — <strong>the</strong> larger <strong>the</strong><br />
response, <strong>the</strong> brighter <strong>the</strong> mapped location. Similar maps were<br />
constructed <strong>for</strong> M+ and M– signals with two different <strong>color</strong>ed squares<br />
on two o<strong>the</strong>r different <strong>color</strong>ed surrounds (see text). The figure<br />
illustrates typical results from [29 •• ]: L+ signals were spatially<br />
complementary to L– signals (and M+ signals were spatially<br />
complementary to M– signals); <strong>the</strong> spatial arrangement was a circularly<br />
symmetric center-surround organization; <strong>the</strong> surround signals were<br />
usually somewhat weaker than <strong>the</strong> center signals (hence <strong>the</strong> higher<br />
values of <strong>the</strong> L+ signals compared to <strong>the</strong> L– signals <strong>in</strong> this figure).<br />
<strong>color</strong>-responsive neurons <strong>in</strong> macaque V1 [29 •• ]. Work<strong>in</strong>g<br />
with awake behav<strong>in</strong>g monkeys, Conway [29 •• ] used<br />
reverse correlation with sparse noise to map receptive<br />
fields, <strong>in</strong> <strong>the</strong> manner of Jones and Palmer [30]. He selected<br />
a small population of cells from a large population of<br />
recorded neurons, us<strong>in</strong>g a screen<strong>in</strong>g technique that led<br />
him to study what we believe are what we called<br />
<strong>color</strong>-preferr<strong>in</strong>g cells. However, Conway used what he<br />
termed ‘high-contrast’ <strong>color</strong> stimuli <strong>for</strong> cone-isolation,<br />
because of his concern that <strong>the</strong> conventional technique of<br />
creat<strong>in</strong>g cone-isolat<strong>in</strong>g stimuli by <strong>color</strong> modulation around<br />
a white po<strong>in</strong>t would not drive <strong>the</strong> cortical <strong>color</strong> cells<br />
strongly enough [29 •• ]. As illustrated <strong>in</strong> Figure 5, different<br />
Our op<strong>in</strong>ion is that <strong>the</strong>se results are <strong>in</strong>terest<strong>in</strong>g <strong>in</strong> that <strong>the</strong>y<br />
provide evidence regard<strong>in</strong>g <strong>the</strong> effects of <strong>color</strong> adaptation<br />
on V1 neurons. However, we believe that <strong>the</strong>y do not tell us<br />
which neurons are act<strong>in</strong>g as double-opponent cells <strong>in</strong><br />
normal <strong>color</strong> vision. What is important is <strong>the</strong> adapt<strong>in</strong>g po<strong>in</strong>t.<br />
All our experiments were done adapted to a white po<strong>in</strong>t<br />
(compare [6,21 • ]). This approximates <strong>color</strong> stimuli <strong>in</strong><br />
natural scenes — <strong>the</strong> modulation of <strong>color</strong> around a given<br />
fixed adapt<strong>in</strong>g po<strong>in</strong>t. In nature, <strong>the</strong> adapt<strong>in</strong>g <strong>color</strong> is <strong>the</strong><br />
reflectance of natural surfaces <strong>in</strong> sunlight, such as an unsaturated<br />
green (trees or grass), <strong>the</strong> unsaturated brown of earth,<br />
or <strong>the</strong> unsaturated gray or blue of <strong>the</strong> sky. In Conway’s<br />
experiments, each cortical cell is studied at multiple adaptation<br />
po<strong>in</strong>ts. This does not correspond to any natural<br />
situation — <strong>in</strong> nature, <strong>the</strong>re is only one adaptation po<strong>in</strong>t at a<br />
time at a given location. There<strong>for</strong>e, <strong>in</strong> our op<strong>in</strong>ion, <strong>the</strong> procedure<br />
of summ<strong>in</strong>g <strong>the</strong> center and surround <strong>mechanisms</strong><br />
[29 •• ], <strong>for</strong> example <strong>for</strong> L+ and L– mapped <strong>in</strong> Figure 5, does<br />
not correspond to a receptive field <strong>for</strong> <strong>the</strong> L cone that ever<br />
exists. This is because such a sum comb<strong>in</strong>es maps measured<br />
on different backgrounds. In our own experiments, which<br />
studied <strong>color</strong> modulation around a white po<strong>in</strong>t, a large<br />
majority of <strong>color</strong>-preferr<strong>in</strong>g neurons were s<strong>in</strong>gle-opponent,<br />
preferr<strong>in</strong>g <strong>the</strong> lowest spatial frequencies of <strong>color</strong>ed patterns,<br />
like <strong>the</strong> LGN cell graphed <strong>in</strong> Figure 3. We believe that this<br />
is how most of <strong>the</strong> cells <strong>in</strong> Conway’s sample would act — as<br />
s<strong>in</strong>gle-opponent neurons on any given background.<br />
Conway’s experiments [29 •• ] raise <strong>the</strong> <strong>in</strong>terest<strong>in</strong>g question:<br />
do <strong>color</strong>–spatial <strong>in</strong>teractions measured with strong<br />
chromatic adaptation orig<strong>in</strong>ate <strong>in</strong> <strong>the</strong> <strong>cortex</strong> The spatial<br />
organizations of subcortical <strong>color</strong>-sensitive neurons have<br />
not been explored with such ‘high-contrast’ <strong>color</strong> stimuli.<br />
It would be worth <strong>in</strong>vestigat<strong>in</strong>g whe<strong>the</strong>r or not <strong>the</strong> strong<br />
surround effects observed <strong>in</strong> <strong>the</strong>se experiments on V1 cells<br />
might be a reflection of strong chromatic adaptation <strong>in</strong> <strong>the</strong><br />
ret<strong>in</strong>a, measured downstream.<br />
Modified type II cells <strong>in</strong> V1<br />
O<strong>the</strong>rs have suggested that macaque V1 neurons that had<br />
previously been thought to be double-opponent [18,19] were