MQP â 014 EQA HANDBOOK EDITION 6 A participant ... - Thistle QA
MQP â 014 EQA HANDBOOK EDITION 6 A participant ... - Thistle QA
MQP â 014 EQA HANDBOOK EDITION 6 A participant ... - Thistle QA

You also want an ePaper? Increase the reach of your titles
YUMPU automatically turns print PDFs into web optimized ePapers that Google loves.
P.O. Box 131375, Bryanston, 2074<br />
Ground Floor, Block 5<br />
Bryanston Gate, 170 Curzon Road<br />
Bryanston, Johannesburg, South Africa<br />
804 Flatrock, Buiten Street, Cape Town, 8001<br />
www.thistle.co.za<br />
Tel: +27 (011) 463 3260<br />
Fax: +27 (011) 463 3036<br />
Fax to Email: + 27 (0) 86-557-2232<br />
e-‐mail : service@thistle.co.za<br />
<strong>MQP</strong>-‐<strong>014</strong><br />
Edition 10<br />
How are results statistically treated<br />
We have three sets of statistical approaches when grouping results in a<br />
database, namely:<br />
Stats Level 1: All results are grouped in the same method group, when the<br />
results are the same regardless of which method is used. This was our historical<br />
default group, and has been changed based on new information from suppliers,<br />
poor distribution of results (high SDs), bimodal distribution of results,<br />
customer comments/ criticisms and AdCom recommendations.<br />
Stats Level 2: Most methods give results within one modal distribution except<br />
for one method, e.g. dry chemistry.<br />
Stats Level 3: Each method is statistically considered separately as none of the<br />
methods available for that test can be compared to any other, e.g. HDL on the<br />
Chemistry <strong>E<strong>QA</strong></strong><br />
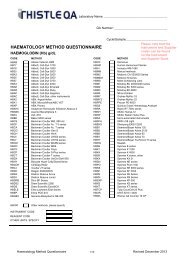
a) Participants are permitted to use a method of their choice in analysing<br />
PT/ <strong>E<strong>QA</strong></strong> samples. We use the information supplied to us by <strong>participant</strong>s<br />
on our Method Questionnaire to allocate method groups to <strong>participant</strong>s on<br />
our database, based on the methodology of their chosen method. In<br />
addition, we receive information on the instrument used and this allows us<br />
to allocate the <strong>participant</strong> to an instrument group, comprising labs using<br />
the same methodology on the same instrument. Labs are thus able to look<br />
at both aspects on our reports.<br />
b) This aspect is assessed on an ongoing basis based on continued monitoring<br />
of SDs and information supplied by instrument and reagent suppliers.<br />
We use two different, but complementary systems of performance evaluation.<br />
Firstly, we produce the usual statistical comparisons of mean and Standard<br />
Deviation (SD), sometimes called Standard Deviation Index (SDI). This can only<br />
take place after a data clean up procedure.<br />
We also use robust mean and SD calculations along with Chauvenet's criterion to<br />
exclude outliers, followed by a 95% trim. Chauvenet's criterion is a unidirectional<br />
and highly sensitive system that identifies outliers from the mean<br />
based on the expected SDI for the number of data points. Consecutive passes<br />
are made until the data satisfies the Criterion. At this point, the mean and SD<br />
Page 7 of 12