A. Vanags, M. Hansen, 2005 - BICEPS
A. Vanags, M. Hansen, 2005 - BICEPS
A. Vanags, M. Hansen, 2005 - BICEPS

Create successful ePaper yourself
Turn your PDF publications into a flip-book with our unique Google optimized e-Paper software.
from around 17% in 1995-6 to nearly 53% in 2004-5. Lithuania is more generous with<br />
only about 40% of university students paying tuition. In Belarus the state universities also<br />
charge fees but, in contrast to the Baltic states, where state sector fees tend to be lower<br />
than in the private sector, the state sector in Belarus charges the highest fees – especially<br />
in the highly demanded subjects.<br />
Thus a stylized picture of the education system in all four countries is one where the state<br />
sector dominates, especially in terms of a select number of key institutions and where the<br />
state sector to a large degree charges fees especially in the most demanded subjects. The<br />
most demanded subjects are also those which tend to be offered in the private sector.<br />
Thus, we appear to have a model in which public and private sectors compete – as in the<br />
model described by De Fraja (2001) pp 20-24. In this model there are two possible<br />
equilibria, in which there is one equilibrium where the private sector ends up with the<br />
weakest students and lower fees than the public sector. This seems to correspond rather<br />
well to the Belarus case.<br />
3.3 Size and dynamics of the private sector<br />
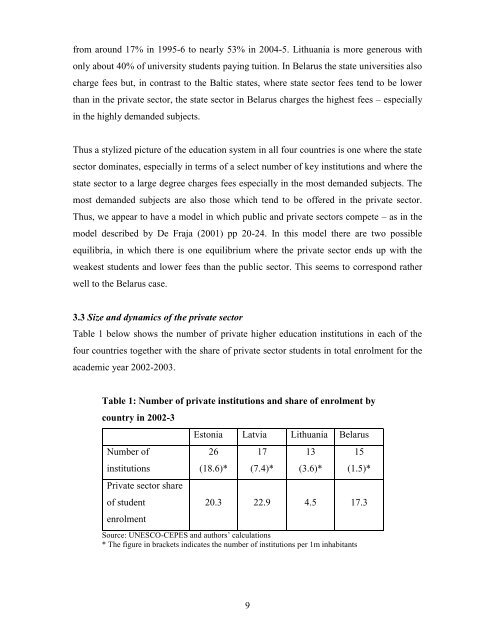
Table 1 below shows the number of private higher education institutions in each of the<br />
four countries together with the share of private sector students in total enrolment for the<br />
academic year 2002-2003.<br />
Table 1: Number of private institutions and share of enrolment by<br />
country in 2002-3<br />
Number of<br />
institutions<br />
Private sector share<br />
of student<br />
enrolment<br />
Estonia Latvia Lithuania Belarus<br />
26<br />
(18.6)*<br />
17<br />
(7.4)*<br />
13<br />
(3.6)*<br />
15<br />
(1.5)*<br />
20.3 22.9 4.5 17.3<br />
Source: UNESCO-CEPES and authors’ calculations<br />
* The figure in brackets indicates the number of institutions per 1m inhabitants<br />
9