BASF Report 2009 - BASF Report 2012
BASF Report 2009 - BASF Report 2012
BASF Report 2009 - BASF Report 2012

You also want an ePaper? Increase the reach of your titles
YUMPU automatically turns print PDFs into web optimized ePapers that Google loves.
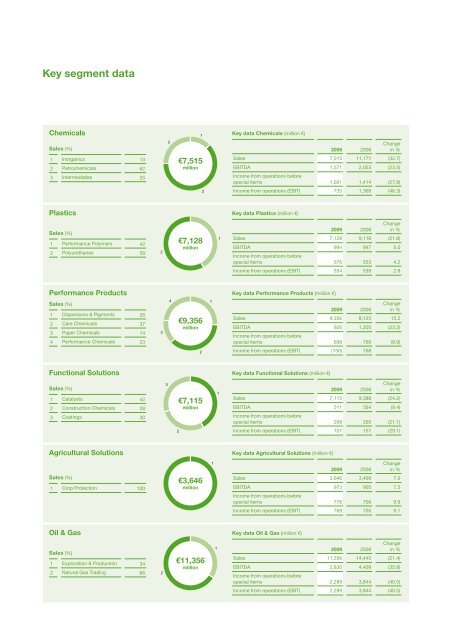
Key segment data<br />
Chemicals<br />
1<br />
Key data Chemicals (million €)<br />
Sales (%)<br />
3<br />
<strong>2009</strong> 2008<br />
Change<br />
in %<br />
1 Inorganics 13<br />
2 Petrochemicals 62<br />
3 Intermediates 25<br />
€7,515<br />
million<br />
Sales 7,515 11,171 (32.7)<br />
EBITDA 1,571 2,053 (23.5)<br />
Income from operations before<br />
special items 1,021 1,414 (27.8)<br />
2<br />
Income from operations (EBIT) 735 1,369 (46.3)<br />
Plastics<br />
Key data Plastics (million €)<br />
Sales (%)<br />
1 Performance Polymers 42<br />
2 Polyurethanes 58<br />
2<br />
€7,128<br />
million<br />
1<br />
<strong>2009</strong> 2008<br />
Change<br />
in %<br />
Sales 7,128 9,116 (21.8)<br />
EBITDA 994 947 5.0<br />
Income from operations before<br />
special items 576 553 4.2<br />
Income from operations (EBIT) 554 539 2.8<br />
Performance Products<br />
Key data Performance Products (million €)<br />
Sales (%)<br />
1 Dispersions & Pigments 26<br />
2 Care Chemicals 37<br />
3 Paper Chemicals 14<br />
4 Performance Chemicals 23<br />
3<br />
4<br />
€9,356<br />
million<br />
1<br />
<strong>2009</strong> 2008<br />
Change<br />
in %<br />
Sales 9,356 8,125 15.2<br />
EBITDA 926 1,205 (23.2)<br />
Income from operations before<br />
special items 698 766 (8.9)<br />
2<br />
Income from operations (EBIT) (150) 768 .<br />
Functional Solutions<br />
Key data Functional Solutions (million €)<br />
Sales (%)<br />
1 Catalysts 42<br />
2 Construction Chemicals 28<br />
3 Coatings 30<br />
3<br />
€7,115<br />
million<br />
1<br />
<strong>2009</strong> 2008<br />
Change<br />
in %<br />
Sales 7,115 9,388 (24.2)<br />
EBITDA 511 564 (9.4)<br />
Income from operations before<br />
special items 209 265 (21.1)<br />
2<br />
Income from operations (EBIT) 107 151 (29.1)<br />
Agricultural Solutions<br />
Key data Agricultural Solutions (million €)<br />
Sales (%)<br />
1 Crop Protection 100<br />
€3,646<br />
million<br />
1<br />
<strong>2009</strong> 2008<br />
Change<br />
in %<br />
Sales 3,646 3,409 7.0<br />
EBITDA 973 905 7.5<br />
Income from operations before<br />
special items 776 706 9.9<br />
Income from operations (EBIT) 769 705 9.1<br />
Oil & Gas<br />
Key data Oil & Gas (million €)<br />
Sales (%)<br />
1 Exploration & Production 34<br />
2 Natural Gas Trading 66<br />
2<br />
€11,356<br />
million<br />
1<br />
<strong>2009</strong> 2008<br />
Change<br />
in %<br />
Sales 11,356 14,445 (21.4)<br />
EBITDA 2,830 4,409 (35.8)<br />
Income from operations before<br />
special items 2,289 3,844 (40.5)<br />
Income from operations (EBIT) 2,289 3,844 (40.5)