Management's Analysis - BASF Report 2012
Management's Analysis - BASF Report 2012
Management's Analysis - BASF Report 2012

You also want an ePaper? Increase the reach of your titles
YUMPU automatically turns print PDFs into web optimized ePapers that Google loves.
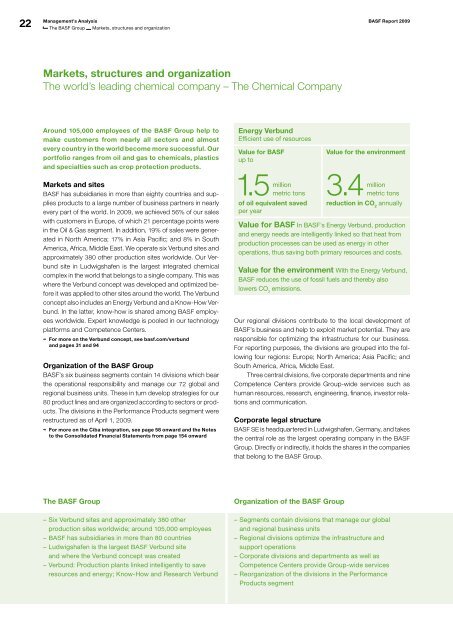
22Management’s <strong>Analysis</strong> <strong>BASF</strong> <strong>Report</strong> 2009The <strong>BASF</strong> GroupMarkets, structures and organizationMarkets, structures and organizationThe world’s leading chemical company – The Chemical CompanyAround 105,000 employees of the <strong>BASF</strong> Group help tomake customers from nearly all sectors and almostevery country in the world become more successful. Ourportfolio ranges from oil and gas to chemicals, plasticsand specialties such as crop protection products.Markets and sites<strong>BASF</strong> has subsidiaries in more than eighty countries and suppliesproducts to a large number of business partners in nearlyevery part of the world. In 2009, we achieved 56% of our saleswith customers in Europe, of which 21 percentage points werein the Oil & Gas segment. In addition, 19% of sales were generatedin North America; 17% in Asia Pacific; and 8% in SouthAmerica, Africa, Middle East. We operate six Verbund sites andapproximately 380 other production sites worldwide. Our Verbundsite in Ludwigshafen is the largest integrated chemicalcomplex in the world that belongs to a single company. This waswhere the Verbund concept was developed and optimized beforeit was applied to other sites around the world. The Verbundconcept also includes an Energy Verbund and a Know-How Verbund.In the latter, know-how is shared among <strong>BASF</strong> employeesworldwide. Expert knowledge is pooled in our technologyplatforms and Competence Centers.For more on the Verbund concept, see basf.com/verbundand pages 31 and 94Organization of the <strong>BASF</strong> Group<strong>BASF</strong>’s six business segments contain 14 divisions which bearthe operational responsibility and manage our 72 global andregional business units. These in turn develop strategies for our80 product lines and are organized according to sectors or products.The divisions in the Performance Products segment wererestructured as of April 1, 2009.For more on the Ciba integration, see page 58 onward and the Notesto the Consolidated Financial Statements from page 154 onwardEnergy VerbundEfficient use of resourcesValue for <strong>BASF</strong>up to1.5millionmetric tonsof oil equivalent savedper yearValue for the environment3.4millionmetric tonsreduction in CO 2annuallyValue for <strong>BASF</strong> In <strong>BASF</strong>’s Energy Verbund, productionand energy needs are intelligently linked so that heat fromproduction processes can be used as energy in otheroperations, thus saving both primary resources and costs.Value for the environment With the Energy Verbund,<strong>BASF</strong> reduces the use of fossil fuels and thereby alsolowers CO 2emissions.Our regional divisions contribute to the local development of<strong>BASF</strong>’s business and help to exploit market potential. They areresponsible for optimizing the infrastructure for our business.For reporting purposes, the divisions are grouped into the followingfour regions: Europe; North America; Asia Pacific; andSouth America, Africa, Middle East.Three central divisions, five corporate departments and nineCompetence Centers provide Group-wide services such ashuman resources, research, engineering, finance, investor relationsand communication.Corporate legal structure<strong>BASF</strong> SE is headquartered in Ludwigshafen, Germany, and takesthe central role as the largest operating company in the <strong>BASF</strong>Group. Directly or indirectly, it holds the shares in the companiesthat belong to the <strong>BASF</strong> Group.The <strong>BASF</strong> Group– Six Verbund sites and approximately 380 otherproduction sites worldwide; around 105,000 employees– <strong>BASF</strong> has subsidiaries in more than 80 countries– Ludwigshafen is the largest <strong>BASF</strong> Verbund siteand where the Verbund concept was created– Verbund: Production plants linked intelligently to saveresources and energy; Know-How and Research VerbundOrganization of the <strong>BASF</strong> Group– Segments contain divisions that manage our globaland regional business units– Regional divisions optimize the infrastructure andsupport operations– Corporate divisions and departments as well asCompetence Centers provide Group-wide services– Reorganization of the divisions in the PerformanceProducts segment
<strong>BASF</strong> <strong>Report</strong> 2009The <strong>BASF</strong> GroupManagement’s <strong>Analysis</strong>Markets, structures and organization23The majority of <strong>BASF</strong> Group companies cover a broad spectrumof our business. Some concentrate on specific business areas,such as <strong>BASF</strong>’s subsidiary Wintershall. In the <strong>BASF</strong> GroupCon solidated Financial Statements, 326 companies including<strong>BASF</strong> SE are fully consolidated. We consolidate 19 joint ventureswith one or more partners on a proportional basis. We alsoinclude 17 companies using the equity method.For more on the scope of consolidation, see the Notes to theCon solidated Financial Statements from page 151 onwardCompensation report and disclosures inaccordance with section 315 (4) GermanCommercial CodeThe compensation report can be found from page 126 onward, and thedisclosures required by takeover law from page 121 onward. They formpart of the Management’s <strong>Analysis</strong> audited by the external auditor.<strong>BASF</strong> SitesLudwigshafenAntwerpFlorham ParkFreeportGeismarHong KongKuantanSingaporeRegional centers Selected production sites Verbund sitesMost important research sitesCorporate legal structure– <strong>BASF</strong> SE, headquartered in Ludwigshafen, is thelargest operating company– 326 companies consolidated in the ConsolidatedFinancial Statements; 19 joint ventures included ona proportional basis– 17 additional companies included using theequity methodMost important research sites– Europe: Ludwigshafen, Basel, Münster, Trostberg,Lemförde– North America: Research Triangle Park, Iselin,Wyandotte, Tarrytown– Asia Pacific: Shanghai, Singapore, Chandivali– South America, Africa, Middle East: Guaratinguetá
24Management’s <strong>Analysis</strong> <strong>BASF</strong> <strong>Report</strong> 2009The <strong>BASF</strong> GroupValue-based managementValue-based managementWe earn a premium on our cost of capital“We earn a premium on our cost of capital” is one of thefour pillars of our strategy. To create value and survivein the long term, a company’s earnings must exceed thecosts of stockholders’ equity and debt capital. To secure<strong>BASF</strong>’s sustainable success, we encourage all employeesto think and act entrepreneurially within the frameworkof our value-based management concept. Our goal:to create awareness about how every employee can findvalue-oriented solutions and implement these in anefficient and effective manner in day-to-day business.EBIT after cost of capitalEarnings before interest and taxes (EBIT) after cost of capital isthe key performance and management indicator for our operatingdivisions and business units. With this figure, we determinewhether <strong>BASF</strong>’s shareholders and creditors receive asuitable return on the capital they provide. The <strong>BASF</strong> Groupcreates added value only when EBIT at least covers the costof capital.Calculation of the cost of capital percentageThe cost of capital percentage depends primarily on threefactors:– the capital structure of the <strong>BASF</strong> Group– the level of interest rates on debt, and– the return expected by shareholders.Borrowing costs comprise interest payments for bank loans andliabilities to the capital markets. The cost of equity correspondsto the returns expected by providers of equity. This is determinedby the market value of <strong>BASF</strong> shares and with the help ofthe Capital Asset Pricing Model (CAPM).An EBIT threshold is determined based on the cost of capitaland income taxes. The <strong>BASF</strong> Group’s operating units need toreach this threshold in order to earn the cost of capital. The costof capital percentage is the relationship between this minimumEBIT level and the <strong>BASF</strong> Group’s operating assets. In 2009, thecost of capital percentage was 9%; in 2010, we expect it will beat the same level.Value-based management throughout the companyValue-based management is only successful if it is firmly rootedin the company and rigorously applied. For us, value-basedmanagement is therefore the daily value-based actions of all ouremployees. In accordance with our four strategic guidelines, wehave identified value drivers – factors that show how eachindividual business unit can create value. We develop keyfigures for the individual value drivers that help us to plan andpursue changes.An important factor in ensuring the successful implementationof value-based management is achieved by linking thegoals of <strong>BASF</strong> to the individual target agreements of employees.In the operating units, EBIT after cost of capital is the mostimportant performance indicator. In contrast, the highestpriority in the functional units is placed on value contribution,evaluated on the basis of effectiveness and efficiency.On the basis of our value-based management concept, allemployees can make a contribution in their business to helpensure that we earn a premium on our cost of capital. Aroundthe world, we raise awareness of this topic among our teamthrough numerous training programs, thereby promoting moreentrepreneurial thinking at all levels within <strong>BASF</strong>.EBIT after cost of capital (million €)Five-year summary 1Calculation of EBIT after cost of capital (million €)2009 20082009 (226)2008 1,6212007 2,8952006 2,1262005 2,354EBIT <strong>BASF</strong> Group 3,677 6,463less EBIT for activities not assigned to the segments 1 (627) (930)less noncompensable foreign income taxes for oilproduction 870 1,851less cost of capital 2 3,660 3,921EBIT after cost of capital (226) 1,6211Since January 1, 2008, Group corporate costs are no longer allocated to thesegments, but rather reported under “Other”. The previous years’ figures werenot adjusted.1The projected net expense is already provided for by an increase in the cost of capital percentage.The previous year’s value was not adjusted to reflect the changes to the segment structure.2In 2009, the cost of capital percentage was 9% compared with 10% in the previous year.
<strong>BASF</strong> <strong>Report</strong> 2009The <strong>BASF</strong> GroupManagement’s <strong>Analysis</strong>Sustainability management25Sustainability managementMinimizing risks, creating new business opportunitiesSustainability is firmly rooted in our company, bothstrategically and organizationally, and is therefore aresponsibility that cuts across the entire structure of<strong>BASF</strong>. As an integral part of our value-based management,sustainable development helps us minimize risks,enhance the existing business and create new businessopportunities.With sustainability management, <strong>BASF</strong> is implementing itsstrategic guideline “We ensure sustainable development.” Aspart of this, we:– identify and develop sustainability topics that are relevantto the future,– implement and monitor environmental, safety and socialstandards,– nurture good long-term relationships with customers andsuppliers, and– conduct open dialogue with relevant stakeholders.To take advantage of business opportunities, we offer productsthat have economic and ecological benefits and providesustainability services to customers. In this way, we use sustainabilityto create value – for <strong>BASF</strong> and for society.Sustainability organizationOur globally responsible Sustainability Council ensures that the<strong>BASF</strong> Group acts in accordance with the principles of sustainabledevelopment. The Council comprises nine heads of functional,operating and regional divisions. The Chairman of theCouncil is Board member Dr. Harald Schwager. The SustainabilityCouncil advises the Board of Executive Directors ondecisions concerning sustainability. It also issues globally validGroup directives and is the central decision-making body for allrelevant sustainability topics. For example, in 2009, it advisedon the establishment of the social business <strong>BASF</strong> Grameen Ltd.in Bangladesh, and defined criteria for environmental protectionand social responsibility in the innovation process. The SustainabilityCouncil is supported by regional steering committees inEurope, North and South America and Asia. They identify keyregional topics, initiate the corresponding projects, and implementglobal decisions locally. The steering committees areassisted by task-specific project teams, which can be made upof employees from operating units. Our Sustainability Centercoordinates between the Sustainability Council, regional networksand operating units regarding the implementation of thestrategy in day-to-day business. In addition, the Center servesas a point of contact for external stakeholders. The worldwideSustainability management structuresSustainability CouncilChairman: Dr. Harald Schwager (Member of the Board of Executive Directors)Heads of operating, functional and regional divisionsEnvironment,Health & SafetyHumanResourcesStrategicPlanning &ControllingPerformancePolymersIntermediatesDispersions &PigmentsRegion EuropeRegionNorth AmericaRegionAsia PacificClimate ProtectionOfficerSustainability CenterRegional steering committeesEurope South America North America Asia PacificSustainability strategy– Implementation of the strategic guideline “We ensuresustainable development”– Responsibility that cuts across the entire structure of<strong>BASF</strong> and a component of value-based management– Minimize risks and create new business opportunities– Open dialogue with stakeholdersFor information on value-based management, see page 24Sustainability organization– Global Sustainability Council issues worldwide guidelinesand advises the Board of Executive Directors onimportant decisions regarding sustainability– Regional steering committees for sustainability– Issues in 2009 included criteria for environmental protectionand social responsibility in the innovation process aswell as the establishment of a social business
26Management’s <strong>Analysis</strong> <strong>BASF</strong> <strong>Report</strong> 2009The <strong>BASF</strong> GroupSustainability management<strong>BASF</strong> Responsible Care network implements requirements inthe areas of environment, health and safety.For more on social business, see basf.com/socialbusinessIdentifying future topicsWe endeavor to identify and consider important topics relatedto sustainable development at an early stage. We regularlyanalyze sustainability issues with regard to their relevance forsociety and their significance for <strong>BASF</strong>. We aim to identifytopics that could, currently or in the future, present a risk oropportunity for our business. We use the results of this issuemanagement to initiate long-term change processes within thecompany, to define goals for developing our portfolio and tospecify focus points for reporting.One example is the topic of water: Water availability andquality are global challenges of the future. We are currently evaluatingthe significance of this issue for <strong>BASF</strong> and examining thesustainability of the water supply at our sites. In 2009, weexpanded our portfolio of water treatment products.For more on our process for identifying sustainability topics, seebasf.com/materiality and page 2; for more on water, see page 95onwardMonitoring toolsA range of systems help us to monitor whether our sites are incompliance with our environmental, safety and social standards.For example, for over 20 years, <strong>BASF</strong> has been conductinginternal audits around the world according to standardizedcriteria on process safety, occupational health and safety, andenvironmental protection.Likewise, we monitor adherence to internationally recognizedlabor and social standards as well as legal requirements.We also conduct risk-based assessments of our suppliersworldwide through on-site visits.For more on audits on environment, health and safety, see page 98;for more on compliance, see page 120 onwardAdherence to labor and social standardsWe introduced a three-part monitoring system to evaluatewhether we adhere to internationally recognized labor and socialstandards within the <strong>BASF</strong> Group. This includes:– close dialogue with employee representatives and internationalorganizations in order to recognize new developmentsand challenges early on,– a compliance hotline that all employees can use anonymouslyand confidentially to obtain information about valid labor andsocial standards or to report grievances, and– an annual survey in our Group companies to ensure adherenceto voluntary commitments in day-to-day business.If the evaluation and comparison of the monitoring tools indicatedeficits at any of our Group companies, we investigate theseand take appropriate action. This ranges from a verbal warningto dismissal.In 2009, our compliance hotline received 48 calls relatingto labor and social standards, of which 37 related to grievances.The 2009 survey covered 100% of the employees in our Groupcompanies. In this, we ask about existing processes for adheringto standards. We also query the effectiveness of these processes,for example for the implementation of the InternationalLabor Organization’s core labor standards.As a member of the Global Compact, our responsibilitydoes not end with adherence to minimum standards. We striveto continuously improve working conditions at our companiesand to support internationally recognized labor and social standardswithin our sphere of influence. For example, we areinvolved in a project in Pakistan, together with the nationalemployers’ association EFP and the ILO, to promote equal rightsfor women in the workplace. The project aims to increasethe involvement of women in decision-making processes incompanies. In 2009, as part of leadership training, we workedwith our partners to train over 400 female managers in all ofPakistan’s larger cities.For more on labor and social standards, see page 16Identification of important topicsInternal monitoring– Identify important issues pertaining to sustainabledevelopment that could pose opportunities or risks to<strong>BASF</strong>’s business– Regularly analyze and discuss sustainability topics– Initiate change processes– Audits on environmental, safety and social standards– Three-part system to monitor adherence to labor andsocial standards– Survey whether processes for adherence to standardsexist and how effective these areFor more on monitoring systems for labor and social standards, seebasf.com/monitoring_e; for more on audits of environmental, safetyand social standards, see basf.com/audits_e
<strong>BASF</strong> <strong>Report</strong> 2009The <strong>BASF</strong> GroupManagement’s <strong>Analysis</strong>Sustainability management27Survey of ILO Core Labor Standards 2009Process implementedEffectiveness of the processPrevention of child labor 100% Verification of age of employee when hired 100% Employees are over 15 years of age when hiredPrevention of forced labor 100%Employment contract based on employee’svoluntary agreement100%Employees have a right to unilateral terminationof employment contractPrevention of discrimination 100%Personnel policies based on objectivecriteriaIn 2009, we received 33 calls relating to discrimination.In 10 cases, there was evidence ofmisconduct.Employees’ right to freedom of association 100% 1 No company measures to fundamentallyrestrict freedom of association91%Employees are working at a company, in whichemployee representation existsEmployees’ right to collective bargaining 100% 1 No company measures that fundamentallyrestrict freedom of collective bargaining87%Employees are working at a company in whichworking conditions are based on a collectivecontract and employee representation exists1A very small percentage of our employees are working for companies in countries that have legal restrictions with respect to freedom of association and organization aswell as collective bargaining.Supply chain managementWhen choosing suppliers, our decisions are not based solelyon economic criteria. Both new and existing suppliers are alsoevaluated on the basis of environmental protection, occupationalsafety and social standards, and these standards are incorporatedin our procurement conditions.In 2009, <strong>BASF</strong> procured raw materials from more than6,000 suppliers worldwide. Risk matrices help us to identifypotential high-risk suppliers. The assessment is based on country,product and sector risks. We visit suppliers on site accordingto their risk potential. If we establish that they do not meetour standards or only meet them partially, we agree on correctivemeasures and provide help with implementing these. Wecontinued with the evaluation of our suppliers’ social standardsin 2009. In recent years, we have informed our suppliers in writingabout expected standards. In 2009, over 260 suppliers filledout a self-assessment questionnaire, which aims to increasetheir awareness of these issues. We paid on-site visits to around140 raw materials suppliers in 2009 relating to environmental,health and safety aspects. Furthermore, we inspected around380 suppliers of technical goods and services as well as logisticsservices providers. After holding “Supplier Days” in Indiaand China in 2008, we are planning further training sessions onsustainability issues for suppliers in 2010 as well as supplier supportvisits related to the implementation of labor and socialstandards.In 2009, <strong>BASF</strong> purchased approximately 500,000 differentraw materials and technical goods as well as plant constructionand maintenance services and logistics. <strong>BASF</strong> Group’s purchasingvolume in 2009 amounted to €21.2 billion. Raw materialsaccounted for €14.4 billion and technical goods and servicesfor €6.8 billion. Purchasing volumes of trading businesses – withnatural gas, metals and other raw materials and merchandise –are not included in these figures. The most important rawmaterials for <strong>BASF</strong> are naphtha, natural gas, methanol, ammoniaand benzene.For more, see basf.com/supplychain; for more on the safety oflogistics providers, see page 99Monitoring of suppliers– Information sent to suppliers about expected standards; self-assessment of suppliers– On-site visits to inspect suppliers– More than 260 suppliers answered self-assessment questionnaire on labor and social standards– Inspection of around 140 raw materials suppliers and 380 suppliers of technical goods and services,as well as logistics service providersFor more on supply chain compliance, see page 120 onward
28Management’s <strong>Analysis</strong> <strong>BASF</strong> <strong>Report</strong> 2009The <strong>BASF</strong> GroupSustainability managementCustomer satisfactionGood relationships with our customers and their satisfactionwith our performance are prerequisites for long-term businesssuccess. We established our “perspectives” initiative in 2005 toincrease customer orientation across all units. With the help of“perspectives,” customers and <strong>BASF</strong> employees analyze existingbusiness relationships and new business opportunities. In2009, for example, new projects with automotive customers inAsia resulted from this dialogue. Using annual surveys, we evaluatewhether our customers are aware of improvements in customerservice. In 2009, more than 1,800 employees across allregions participated in “perspectives” training courses andworkshops on marketing and sales topics.We were again honored by many satisfied customers in2009. Our honors included Procter & Gamble’s “Supplier of theYear” award, making <strong>BASF</strong> one of seven prize winners selectedby the company from over 80,000 suppliers. In South America,<strong>BASF</strong> won an award from the Suzano Group as best supplier,for example.Using our global Non Conformance Management System(NCM), we record and investigate customers’ problems with ourproducts and processes. This helps us to learn from mistakesand continuously improve our performance. We are currentlyfurther integrating the NCM system in supply chain processessuch as inspections of material quality.Success – sustainability expertise for customersSustainability allows <strong>BASF</strong> to set itself apart from competitors.We bring our expertise into customer relationships through theinitiative “Success – Added Value through Sustainability”. Here,our business units investigate how they can expand or strengthencustomer relationships through sustainability, and in doing socreate new business models. We carried out 157 sustainabilityprojects as part of the Success initiative in 2009. The servicesoffered range from product analysis to the development of strategicconcepts.A Success project with the raw materials purchasing departmentwon the <strong>BASF</strong> Business Excellence Award in 2009: Tostand out from buyer competition for fertilizer raw materials,<strong>BASF</strong> supported selected suppliers with technical knowledgerelating to the European chemicals regulation REACH, energysecurity and climate protection. In return, <strong>BASF</strong> was able to agreeon long-term, cost-effective supply contracts.For more on this topic, see basf.com/success_eNew HPPO technology from <strong>BASF</strong> and DowGreater energy efficiency, less wastewaterValue for <strong>BASF</strong>requires up to25%less capitalto build new plants incomparison to traditionaltechnologiesValue for the environmentup to40 metric tonsless wastewater per tonof sales product comparedto conventional processesPlants using the HPPO technology jointly developed by<strong>BASF</strong> and DOW to produce propylene oxide are significantlymore economical than those using existing processes.The use of the new technology not only reduceswastewater, it also lowers energy consumption by upto 35%. For more, see page 29Customer satisfaction– “perspectives” initiative to strengthen customer focus– More than 1,800 participants in “perspectives” trainingcourses in 2009– Awards recognize <strong>BASF</strong> as a good supplier– Non Conformance Management System records customers’problems with products and processes to help uslearn from mistakesSustainability services for customers– Initiative “Success – Added Value through Sustainability”helps <strong>BASF</strong> to expand and strengthen customerrelationships through sustainability– 157 sustainability projects in 2009– Success project helps <strong>BASF</strong> to stand out from competitionin buying raw materials and wins the <strong>BASF</strong> BusinessExcellence Award
<strong>BASF</strong> <strong>Report</strong> 2009The <strong>BASF</strong> GroupManagement’s <strong>Analysis</strong>Sustainability management29Eco-Efficiency <strong>Analysis</strong> and SEEBALANCE<strong>BASF</strong> developed the Eco-Efficiency <strong>Analysis</strong> as a strategic toolfor the evaluation of products and processes. It provides informationabout the relationship between the economic benefits ofa product and its impact on the environment. This tool helps usand our customers decide which products and processes aremost suitable, both in economic and ecological terms. The entirelife cycle of a product or process is examined in relation to allimportant environmental categories, including resource andenergy consumption, emissions and risk potential.In 2009, <strong>BASF</strong> carried out its 400th Eco-Efficiency <strong>Analysis</strong>.In cooperation with the German supermarket chain REWE,<strong>BASF</strong> conducted an Eco-Efficiency <strong>Analysis</strong> of apples grown inEurope and overseas. Important influential factors were yield,transport and cooling. An Eco-Efficiency <strong>Analysis</strong> carried outwith The Dow Chemical Company for the jointly developed HPPOtechnology (hydrogen peroxide-propylene oxide technology)revealed significant savings for capital, energy consumption andwastewater quantities compared with conventional technologies.The new technology won the 2009 Innovation and ExcellenceAward in Core Engineering from the U.K.-based Institution ofChemical Engineers.The Socio-Eco-Efficiency <strong>Analysis</strong> SEEBALANCE ® is anextension of the Eco-Efficiency <strong>Analysis</strong> that includes socialimpact. This incorporates additional social criteria such as accidentsat work, vocational training and spending on research anddevelopment. In 2009, we enhanced the methodology onceagain: We now incorporate additional economic evaluationparameters such as taxes and subsidies.<strong>BASF</strong>’s method for Eco-Efficiency <strong>Analysis</strong> is certified bythe German Association for Technical Inspection (TÜV Berlin).The Eco-Efficiency <strong>Analysis</strong> received certification in the UnitedStates in 2009 from the non-profit organization National SanitationFoundation (NSF). The goal of the NSF Protocol 352 is toensure that sustainability analyses are logical, objective andtransparent.For more on this topic, see basf.com/eco_efficiencyDialogue with stakeholdersOpen and respectful treatment of stakeholders is anchored inour basic values. Employees, employee representatives, neighbors,policy makers, non-governmental organizations, shareholders,customers and other business partners are our mostimportant stakeholders. Our exchange with these stakeholdergroups helps us to identify important issues and the ensuingopportunities and risks for <strong>BASF</strong>. The results of stakeholderdialogue are incorporated into our issue management forsustainability.As a company in the chemical industry, we are aware of theparticular responsibility we have towards our neighbors. Currentissues are discussed in Community Advisory Panels (CAPs) in<strong>BASF</strong>’s host communities. There are 75 CAPs at present, mostlyat our larger production sites.The trust of consumers, non-governmental organizations,policy makers and the general public is essential for thesuccessful introduction of products based on new technologies.We enter the political and public debate at an early stage of technologicaldevelopment. Our involvement in national and internationaldialogue forums on nanotechnology dates back to2004. In dialogue with stakeholders, we answer questions andprovide information about the opportunities and risks of technologies.We aim to confront skepticism in the public debate,for example regarding green biotechnology in Europe, by providingtransparency about our activities. To do this, we rely onmodern media, among other things: For instance, in 2009, weused a blog to provide information on a field experiment withgenetically optimized potatoes at our site in Limburgerhof,Germany.Transparency is also important in our political communication.That is why our communication includes providing informationonline about temporary exchanges of staff with publicadministration and we are listed in the European Commission’sregister of interest representatives.For more on dialogue with labor representatives, see page 88; formore on nanotechnology dialogue, see page 102; for more on plantbiotechnology, see basf.com/dialogue_plantbiotechnology and formore on stakeholder dialogue in general, see basf.com/dialogueEco-Efficiency <strong>Analysis</strong>– Strategic tool for evaluating products and processes– Provides information about the relationship betweeneconomic benefits and impact on the environment– More than 400 Eco-Efficiency Analyses conducted– Methodology certified by TÜV Berlin– Certification from National Sanitation Foundation inthe United StatesDialogue with stakeholders– Helps recognize important issues and ensuing opportunitiesand risks– Stakeholders are employees, shareholders, businesspartners, employee representatives, neighbors, policymakers and non-governmental organizations– 75 Community Advisory Panels– Dialogue relating to new technologies
30Management’s <strong>Analysis</strong> <strong>BASF</strong> <strong>Report</strong> 2009The <strong>BASF</strong> GroupValue added statementValue added statementThe value added statement explains the <strong>BASF</strong> Group’scontribution to private and public income and shows how<strong>BASF</strong>’s economic activities provide value to society.Value added results from the company’s business performanceminus goods and services purchased as well as depreciationand amortization. In contrast to the income statement, which isbased on the owner’s perspective, the distribution statementtakes into account the stakeholders in this value-adding process,such as employees, shareholders or the state.<strong>BASF</strong> Group’s value added amounted to €11,158 million in2009. This was a reduction of 15.6% in comparison with theprevious year, which resulted primarily from a decrease in thecompany’s business performance.The greatest share of value added was distributed to ouremployees, who received €7,107 million in the form of wages,salaries and social benefits. In addition, a significant share ofvalue added was distributed to the state in the form of taxes.This amounted to €1,662 million in 2009 compared with€2,940 million in the previous year.In 2009, <strong>BASF</strong> spent a total of €48 million on donations,sponsoring and funding for our own projects, comparedwith €65 million in 2008. This amount is reported in “otherexpenses”.The remaining value added of €1,410 million was availableto be paid out as a dividend or retained.For more on wages and salaries, see pages 85 and 168; for more ontaxes, see page 165 onward; and for more on donations and sponsoring,see page 90Value added statementCreation of value added(million €, previous year’s figures in brackets)Use of value added(previous year’s figures in brackets)1 Value added 11,158 (13,210)2 Amortization 3,746 (3,179)and depreciation3 Services purchased, 10,867 (11,516)energy costs andother expenses4 Cost of raw 26,413 (35,883)materials andmerchandise41Businessperformance52,184 (63,788)32Employees63.7% (48.2%)Taxes14.9% (22.3%)Minority interests2.2% (3.0%)Creditors6.5% (4.4%)12.7%Remaining value added(dividend and retention)(22.1%)Value addedUse of value added– <strong>BASF</strong> Group’s financial contribution to private andpublic income– Decline of 15.6% compared with 2008 to €11.2 billion,due to decreased business performance– Largest share distributed to employees– €7,107 million for employees– €1,662 million for taxes– €48 million for social commitment– €1,410 million available for dividend or retention
<strong>BASF</strong> <strong>Report</strong> 2009The <strong>BASF</strong> GroupManagement’s <strong>Analysis</strong>Research and development31Research and developmentMeeting challenges, developing solutions, shaping the futureOur international and interdisciplinary research teamswork on solutions for the challenges of the future. Especiallyin times of crisis, our commitment to research anddevelopment strengthens our position as an innovativecompany. Our know-how, products and processesare driving forces of innovation in almost all industrysectors. They promote the long-term success of ourcustomers, which in turn ensures our profitable growthand sustainable commercial success.The rapidly growing and aging global population, increasingurbanization, rising demand for energy and climate protectionrepresent global challenges which we address with innovativesolutions and future-oriented projects. These global megatrendsare the driving force behind our innovations, even in times ofeconomic volatility.Our team of highly qualified employees of various nationalitiesand specializations is the cornerstone of our innovativestrength. In 2009, the number of employees involved in researchand development rose to more than 9,300.Our four central technology platforms Polymer Research,Specialty Chemicals Research, Chemicals Research and Engineering,and Plant Biotechnology Research are, in addition tothe development units in our operating divisions, our researchand competence centers. Thanks to our close cooperation withnumerous partners from science and business worldwide, wehave created an international and interdisciplinary Know-howVerbund – an important factor in the success of efficient andfuture-oriented research and development. This networkincludes around 1,900 collaborative partnerships with universities,research institutes, startup companies and industrypartners.For more, see basf.com/research-organizationMany of the projects that we undertake in research cooperationsare publicly funded. We are currently involved in approximately80 such projects, which are co-financed by national andinternational organizations, including the European Union andthe U.S. Department of Energy. One example is the “OrganicElectronics Forum” cluster of excellence, supported by the GermanFederal Ministry of Education and Research, through which<strong>BASF</strong> and partners are involved in the further development oforganic electronics.With a view to global challenges and opening up new markets,we have continued to internationalize our research. Theacquisition of Ciba Holding AG also contributed to this. Togetherwith scientists at our new sites, including our second largestresearch center in Basel, Switzerland, we aim to implementforward-looking projects. Materials for displays and electronicapplications, for example, or the merging of Ciba’s and <strong>BASF</strong>’sactivities in the area of fire-retardant additives represent newmarket opportunities. Overall, we expanded our project portfolioto 3,300 projects in 2009.Expenditures on research and development amounted to€1,398 million in 2009, compared with €1,355 million in 2008.Of these expenditures, 76% fell under the responsibility of theoperating divisions, with around 23% being allocated to crossdivisional,strategic corporate research. Despite the current difficulteconomic environment, we want to maintain the same highlevel of expenditures in 2010 as in the past few years. Varioussuccessfully completed projects, such as the startup of a newplant for intermediates, show us we are on the right track. Usinga tailor-made technology, this facility is the first to use the greenhousegas nitrous oxide – a by-product of another productionprocess – to produce the intermediates cyclododecanone(CDon) and cyclopentanone (CPon) in a manner which is bothcost-effective and environmentally friendly. CDon is usedto produce a precursor for the high-performance plastic polyamide12, and CPon can be used as a building block in thesynthesis of active ingredients for pharmaceuticals andfragrances.Around one third of our research and development expendituresare invested in products and technologies for increasedenergy efficiency, as well as climate protection, resource conservationand alternative raw materials. In 2010, we aim to generatesales of up to €6 billion with product innovations – new– More than 9,300 employees working in researchand development– Know-how Verbund established with around 1,900collaborative partnerships– Expansion of project portfolio to 3,300 projects– Research and development expenditures of€1,398 million in 2009– Sales of product innovations expected to be upto €6 billion in 2010 and between €6 billion and€8 billion in 2015Expenditure on research and development by segment1 Chemicals 9%2 Plastics 9%3 Performance Products 20%4 Functional Solutions 12%5 Agricultural Solutions 25%6 Oil & Gas 1%7 Other 1%8 Corporate research 23%76581€1,398million423
32Management’s <strong>Analysis</strong> <strong>BASF</strong> <strong>Report</strong> 2009The <strong>BASF</strong> GroupResearch and developmentand improved products or applications that have been on themarket for a maximum of five years. In 2015, we expect sales ofbetween €6 billion and €8 billion from product innovations.For a multi-year overview of research and developmentexpenditures, see the Ten-year summary on page 213Patents are also often used as a measure of the success ofresearch. They are an important foundation for long-term competitivenessand, in the chemical industry, an indication of sustainableinnovative strength. In 2009, <strong>BASF</strong> filed around 1,300patents worldwide (2008: 1,265). The Patent Asset Index,developed at the Otto Beisheim School of Management (WHU)near Koblenz, Germany, allows a precise comparison of thepatent portfolios of global companies. According to this index,<strong>BASF</strong> ranks first in 2009, making it one of the most innovativecompanies in the international chemical industry.<strong>BASF</strong>’s growth clustersHow can we feed a growing world population and provideenough clean water for everyone? How do we meet increasingdemands for energy? We address these and other questionsrelated to global megatrends in five growth clusters: plant biotechnology,white biotechnology, raw materials change, energymanagement, and nanotechnology. In these clusters, the focusis on markets and technologies of the future.Environmental factors like heat and cold often determinehow good a harvest is. As a result of climate change, expertsexpect that drought will occur more frequently and last longerin the future. In the plant biotechnology growth cluster,together with our partner Monsanto we have developed adrought-tolerant corn. Farmers in the United States will likelybe able to cultivate this corn as of <strong>2012</strong>. Other cooperationpartners in the development of important crops are Embrapa(herbicide-tolerant soybeans), CTC (sugarcane) and KWS(sugar beet).Enzymes make an important contribution to animal nutrition, anarea in which we are conducting research in our white biotechnologygrowth cluster. For example, the animal feed additiveNatugrain ® TS helps improve the nutritive value of feed used inpig and poultry farming. With the help of this additive, animalscan utilize the otherwise nearly indigestible carbohydrates inplant-based foods and convert them into energy.Limited resources are a global challenge – particularly forthe chemical industry. In the raw materials change growthcluster, we are conducting research into a range of starting materialsas alternatives to crude oil for our value-adding chains;examples include renewable raw materials and natural gas.<strong>BASF</strong> develops dehydration technologies for the production ofC3 and C4 olefins, which are basic chemicals for the productionof many important products including superabsorbents,plasticizers, polymers, surfactants and solvents.Due to globalization, the desire for mobility and availabilityis increasing. In our energy management growth cluster, weare involved in the field of technology for energy storage, amongother things. Together with partners from industry and sciencein the consortium “HE-Lion,” <strong>BASF</strong> Future Business GmbH –and in the future, the Catalysts division – plan, for example, todevelop and bring to market cathode materials for more efficient,higher-performing and safer lithium-ion batteries.In the nanotechnology growth cluster, materials for printableelectronics are contributing to new information technologies.These enable the efficient production of numerousnew electronic applications, including memory tags, cost-efficientradio frequency identification tags and flexible displays.Our successes encourage us to continue into the secondphase of our growth cluster initiative “We innovate for growth”from 2009 to 2011 with investments of up to €1 billion. With this,we aim to create profitable growth for <strong>BASF</strong> and contribute toa better future.For more on research and development in the segments,see page 47 onward<strong>BASF</strong>’s growth clusters– Five growth clusters focus on technologies andmarkets of the future– Addressing megatrends such as the growing worldpopulation, increasing energy demand and globalization– Second phase of the growth cluster initiative from2009 to 2011; expenditures of up to €1 billion<strong>BASF</strong> the leader in Patent Asset IndexPatent Asset Index (standardized, as of December 31, 2009)An indicator of companies’ innovative strength 1<strong>BASF</strong> 100Bayer 72Du Pont 63Dow Chemical 59Evonik 31Source: WHU Prof. Ernst1Based on the portfolio size (number of patent families) and the competitiveimpact (number of citations in other patents and market coverage)
<strong>BASF</strong> <strong>Report</strong> 2009The business year at <strong>BASF</strong> GroupManagement’s <strong>Analysis</strong>Trends in the global economy33Trends in the global economyIn 2009, the global economy was shaped by the worstrecession since the end of the Second World War. As aresult of the global financial and economic crisis, realgross domestic product declined in almost every region –particularly in industrialized countries (–3.6%). Globalgross domestic product contracted markedly in comparisonwith the previous year (–2.3%) and was significantlylower than we had originally forecast for 2009 (–0.3%).Following the economic slump at the end of 2008, theglobal economic downturn bottomed out in the secondhalf of 2009, primarily driven by the revival of economicgrowth in Asia.In 2009, the global economy was characterized by a drop ininternational trade and a sharp decline in demand for goods.The recession affected emerging markets as well as all theindustrialized countries. Export-dependent economies, such asGermany and Japan, were particularly affected. Concertedaction on the part of national central banks and governmentshelped to partially stabilize the global financial markets. Over thecourse of the year, intensified fiscal policy measures in the formof economic stimulus packages helped to mitigate the economicdownturn. However, this could not prevent global gross domesticproduct from declining for the first time since the end of theSecond World War (–2.3%).Development by regionIn 2009, Europe was in a deep recession that had alreadystarted in the second half of 2008. The downturn was a resultof low consumer spending and investing activity, inventorydestocking and a marked decline in exports. In contrast to theprevious year, the gross domestic product of the EuropeanUnion contracted (2008: +0.8%; 2009: –4.1%). It was not untilthe second half of 2009 that many companies began to restockinventories that had been depleted in the first half of the year.This caused capacity utilization in industry, which had been verylow until then, to rise again in some areas. Government stimulusprograms proved effective; they supported private and stateconsumption.Economic output in the United States was also significantlylower in 2009 (–2.4%). Decreasing employment and a negativewealth effect due to declining real estate and share prices ledto a drop in private consumption. Investments also declinedconsiderably. At the end of 2009, the unemployment rate was9.7%, around twice as high as in 2007.Compared with the figures from the previous year and theexpected long-term growth trend, Asia (excluding Japan) sawlow growth in 2009 as a result of weak demand from industrializedcountries. Gross domestic product growth in this regiononce again weakened considerably compared with the previousyear (2009: +4.0%; 2008: +5.9%). Only China was able toalmost fully compensate the decline in demand for export goodsthanks to massive national economic stimulus packages, thecreation of domestic consumer incentives and further expansionof its infrastructure. Growth in the Chinese economy (+8.7%)was only slightly below the level of the previous years. Inthe ASEAN region, South Korea and Taiwan, the steep declinein foreign trade caused a downturn in industrial production,which continued until well into the second half of the year insome areas.Japan was particularly affected by the recession due toits significant trade with North America and Europe. In 2009,the country experienced a further decline in gross domesticproduct (–5.4%).In South America, where regional economic growth waspreviously strong, the economy contracted slightly in 2009(–1.0%). This was caused by the globally weak demand for rawmaterials as well as low raw materials prices.Forecast for the economic environment in 2010, see page112 onwardTrends in the global economy in 2009– Global gross domestic product contracted considerablyin 2009 (–2.3%) and was significantly below ourforecast (–0.3%)– Recession particularly affected industrialized countriesand emerging markets– Government stimulus programs mitigated the economicdownturn over the course of the year– Downturn bottomed out in the second half of 2009;growth impetus from AsiaGross domestic product 2009Real change compared with the previous yearWorld –2.3%E.U. –4.1%United States –2.4%Asia (excl. Japan) +4.0%Japan –5.4%South America –1.0%
34Management’s <strong>Analysis</strong> <strong>BASF</strong> <strong>Report</strong> 2009The business year at <strong>BASF</strong> GroupTrends in key customer industriesTrends in key customer industriesAfter stagnating in the previous year (+0.2%), globalindustrial production fell sharply in 2009 (–8.3%); thedecline was significantly steeper than we had forecast atthe beginning of the year (–2.9%). This development wasprimarily due to considerably weaker demand both fromindustry and from private consumers in the OECD industrializedcountries. The decline in industrial productionwas particularly significant in these countries (–13.0%).Development of industrial production in 2009Activity in the construction industry worldwide decreased in2009 (–5.2%). In the United States (–16.2%) and in Europe(–7.3%), the construction sector once again contracted significantlycompared with the previous year, with private housingconstruction decreasing substantially. In the emerging marketsof Asia, on the other hand, construction activity continued tosee robust growth (+7.5%).Thanks to state-sponsored purchase incentives, such ascar scrappage schemes, demand in the automotive industrywas temporarily revived in many countries in Europe, NorthAmerica and Asia. Nevertheless, the number of automobilesproduced worldwide once again fell sharply compared with theprevious year (–11.6%). The decline in automobile productionwas particularly dramatic in the United States (–34.6%). In contrast,production growth in Asia (excluding Japan) was unexpectedlystrong (2008: +3.3%; 2009: +22.6%).The electrical industry also experienced a global downturn(–9.8%). In the industrialized countries, production levels decreasedfurther as a result of weak demand from industry and consumers(–15.0%). In Japan, production levels fell significantly (–22.0%), whilein Asia (excluding Japan) the decline was only slight (–0.3%).In contrast to previous years, the information and communicationtechnology industry (ICT) declined worldwide(–7.3%). A lack of demand from the financial sector, in particular,had a negative impact on this industry. Production levels fellespecially in Japan (–24.4%) owing to its dependence on exportsto the United States and Europe.The relocation of production to emerging economies in Asiahas caused changes in the structure of the global textiles industryover the past few years. During the economic crisis of 2009,production in the textiles industry once again declined considerablyin the industrialized countries (–16.3%). In Asia (excludingJapan), production levels also decreased as a result of lower demand(–5.4%). Globally, the reduction was substantial (–10.0%).The paper industry contracted worldwide in 2009 (–6.2%).Only the emerging economies in Asia recorded positive growth(+2.3%). In the industrialized countries, on the other hand, productionlevels declined noticeably (–10.6%). The resulting overcapacitiescontinue to exist.The food and nutrition industry only experienced moderategrowth in 2009 as a result of the economic crisis (+0.2%).Both industrialized countries (–0.6%) and emerging economies(+1.5%) saw lower growth compared with previous years.Growth in agriculture worldwide was not as strong (+0.2%)as in the previous year (+3.3%). In the industrialized countries,production in 2009 (–1.5%) was lower than in 2008 (+3.6%).Growth also slowed in the emerging economies (2008: +3.2%;2009: +1.1%).Forecast for the economic environment in 2010, seepage 112 onwardGrowth in key customer industries in 2009Real change compared with previous yearIndustries total OECD –13.0%World –8.3%Construction OECD –10.2%World –5.2%Automotive OECD –26.9%(per-unit basis) World –11.6%Electrical OECD –15.0%Industry World –9.8%Information and OECD –14.3%communication World –7.3%Textiles OECD –16.3%World –10.0%Paper OECD –10.6%World –6.2%Nutrition OECD –0.6%World +0.2%Agriculture OECD –1.5%World +0.2%– Drop in global industrial production (–8.3%)– Construction sector contracted compared withprevious year, particularly in the United States (–16.2%)and Europe (–7.3%)– Sharp fall in global automotive production (–11.6%)– Some steep production declines in the electrical, ICT,textiles and paper industries– Moderate growth in production in the food and nutritionindustry and agriculture<strong>BASF</strong> sales by industryDirect customers>15% Chemicals10 – 15% Automotive | Construction | Utilities5 – 10% Agriculture | Plastics industry | Oil industry
<strong>BASF</strong> <strong>Report</strong> 2009The business year at <strong>BASF</strong> GroupManagement’s <strong>Analysis</strong>Trends in the chemical industry35Trends in the chemical industryDemand for chemical products has fallen globally duringthe current economic crisis. The chemical industrywas particularly affected by the weak industrial demandin the second half of 2008 and the first half of 2009. Globalchemical production (excluding pharmaceuticals)decreased considerably in 2009 (–5.4%).Following a decrease in 2008 (–1.8%), worldwide chemical production(excluding pharmaceuticals) declined in 2009 for thesecond year in a row. The drop in production in the chemicalindustry occurred almost in parallel with lower production in thekey customer industries of construction, automotive, electrical,furniture and paper.The drop in chemical production (excluding pharmaceuticals)was particularly dramatic in the European Union (–12.5%),in Japan (–10.9%) and in the United States (–6.1%). Within theEuropean Union, it fell especially in Germany (–14.4%). Thedecline in South America (–1.8%) was not as pronounced. Incontrast, after experiencing weak growth in 2008 (+0.5%),chemical production recovered in Asia (excluding Japan)(+5.7%).Chemical production (excluding pharmaceuticals) in 2009Real change compared with previous yearWorld –5.4%E.U. –12.5%United States –6.1%Asia (excl. Japan) +5.7%Japan –10.9 %South America –1.8 %Trends in the raw materials marketsFollowing volatility over the course of 2008, raw materials priceswere at a low level at the beginning of 2009. Despite the globaleconomic and financial crisis and the resulting low demandfor raw materials, prices increased again over the course ofthe year.Over the course of 2009, the oil price rose from approximately$40 per barrel to more than $75 per barrel, reaching thesame level as in October 2007. Several times during the year,the average monthly price for a barrel of Brent crude exceededthe price of the usually more expensive U.S. oil type WTI –a result of the severe decline in demand on the Americanenergy market.Prices for the chemical raw material naphtha developed inalmost exactly the same way as the oil price: they rose throughoutthe course of the year from an average level of $340 permetric ton in January to well over $600 per metric ton fromOctober. The average annual price of oil fell by approximately37% to $62 per barrel and the average price for naphtha declinedby around 33% to $526 per metric ton.In both the United States and Europe, the natural gas priceinitially continued to fall during the course of 2009 beforeincreasing again in the fourth quarter. The average annual gasprice in the United States was around $4/mbtu, less than halfthe cost in the previous year. In Europe, the average gas pricewas well over $8/mbtu due to the link with oil prices.Forecast for the economic environment in 2010, seepage 112 onwardTrends in the chemical industry in 2009– Chemical production (excluding pharmaceuticals)decreased considerably as a result of globally weakindustrial demand (–5.4%)– The drop in chemical production (excluding pharmaceuticals)was particularly dramatic in Germany (–14.4%),in Japan (–10.9%) and in the United States (–6.1%)– Rise in raw materials prices over the course of 2009,starting from a low levelPrice trends for crude oil (Brent) and naphtha (US$/barrel, US$/metric ton)US$/-US$/metric tonbbl1,2001351,050120105900907507560060450453003015020072008200915Oil spot price (Brent blend) in US$/barrelNaphtha spot price in US$/metric ton
36Management’s <strong>Analysis</strong> <strong>BASF</strong> <strong>Report</strong> 2009The business year at <strong>BASF</strong> GroupBusiness review <strong>BASF</strong> GroupBusiness review <strong>BASF</strong> GroupSales and earnings (million €)2009 2008 Change in %Sales 50,693 62,304 (18.6)Income from operations before depreciation and amortization (EBITDA) 7,388 9,562 (22.7)EBITDA as a percentage of sales 14.6 15.3 –Income from operations (EBIT) before special items 4,852 6,856 (29.2)Income from operations (EBIT) 3,677 6,463 (43.1)Financial result (598) (487) (22.8)Income before taxes and minority interests 3,079 5,976 (48.5)Income before minority interests 1,655 3,305 (49.9)Income before minority interests as a percentage of sales 3.3 5.3 –Net income 1,410 2,912 (51.6)Earnings per share (€) 1 1.54 3.13 (50.8)Adjusted earnings per share (€) 1 3.01 3.85 (21.8)Sales and earnings by quarter 2009 (million €)1st quarter 2nd quarter 3rd quarter 4th quarter 2009Sales 12,219 12,502 12,798 13,174 50,693Income from operations before depreciation and amortization (EBITDA) 1,587 1,576 1,993 2,232 7,388Income from operations (EBIT) before special items 985 1,140 1,248 1,479 4,852Income from operations (EBIT) 928 772 971 1,006 3,677Financial result (202) (59) (173) (164) (598)Income before taxes and minority interests 726 713 798 842 3,079Net income 375 343 237 455 1,410Earnings per share (€) 0.41 0.37 0.26 0.50 1.54Adjusted earnings per share (€) 0.55 0.79 0.61 1.06 3.01Sales and earnings by quarter 2008 (million €)1st quarter 2nd quarter 3rd quarter 4th quarter 2008Sales 15,921 16,305 15,772 14,306 62,304Income from operations before depreciation and amortization (EBITDA) 2,955 3,033 2,171 1,403 9,562Income from operations (EBIT) before special items 2,354 2,408 1,568 526 6,856Income from operations (EBIT) 2,303 2,359 1,509 292 6,463Financial result (122) (38) (39) (288) (487)Income before taxes and minority interests 2,181 2,321 1,470 4 5,976Net income 1,170 1,297 758 (313) 2,912Earnings per share (€) 1 1.24 1.39 0.82 (0.34) 3.13Adjusted earnings per share (€) 1 1.38 1.54 0.96 (0.05) 3.851In the second quarter of 2008, we conducted a two-for-one stock split.Sales (million €)Income from operations (million €)2009 50,6932008 62,3042007 57,9512006 52,6102005 42,7452009 3,6772008 6,4632007 7,3162006 6,7502005 5,830
<strong>BASF</strong> <strong>Report</strong> 2009The business year at <strong>BASF</strong> GroupManagement’s <strong>Analysis</strong>Business review <strong>BASF</strong> Group37In 2009, our business was shaped by the economic crisisand the integration of Ciba. As forecast at the beginningof the year, sales and earnings were significantlybelow the previous year’s levels. Sales declined by 19%to €50,693 million, while income from operationsdecreased by 43% to €3,677 million. Despite the difficultbusiness environment and the charges related to theCiba acquisition, we only narrowly missed our goal ofearning our cost of capital.The capacity utilization of our plants was at a historiclow in large parts of our business. However, demandrecovered over the course of the year, especially inAsia. Thanks to quick and decisive measures to adjustcapacities and increase efficiency, we were able to stabilizeearnings and increase cash flow to a record high.Forecast for the economic environment in 2010, see pages 112 to 116year’s level. In addition, there was pressure on margins in theInorganics and Petrochemicals divisions. Rigorous measures toadjust capacity, reduce costs and increase efficiency helped tomitigate the decline in earnings.Factors influencing sales (million €)Influence on2009 sales (%)Volumes (5,913) (9.4)Prices (8,505) (13.7)Currencies 389 0.6Acquisitions and changes in the scopeof consolidation 2,453 4.0Divestitures (35) (0.1)(11,611) (18.6)Sales and earningsSales volumes in the first half of 2009 were significantly belowthe level achieved in the same period of 2008, but demandrecovered in the second half of the year. The fourth quarter of2009 was the first in which volumes exceeded the same periodof the previous year; however, volumes in the fourth quarterof 2008 had already been severely impacted by the onset ofthe economic crisis. Prices declined significantly in nearly alldivisions.Currency effects had a positive impact on sales. The averageeuro/dollar exchange rate in 2009 was $1.39 per euro, comparedwith $1.47 per euro in 2008. Acquisitions contributed€2,451 million to sales. This was primarily due to the acquisitionof Ciba Holding AG on April 9, 2009. Divestitures reduced salesby €35 million.Sales in the Chemicals segment declined considerably as aresult of lower prices and significantly lower volumes. This trendbegan in the fourth quarter of 2008 and continued into the firstquarter of 2009. The Petrochemicals division, in particular, wasadversely impacted by this development. The segment’s incomefrom operations was therefore significantly below the previousLower volumes and prices also led to a decline in sales in thePlastics segment. Both divisions in the segment were negativelyimpacted by lower prices for basic and standard products in particular.Earnings in the segment were slightly above the previousyear’s level. In 2009, the Performance Polymers division made apositive contribution to earnings after a loss in 2008. This wasprimarily due to higher demand from the second quarter onwardand cost-cutting measures. The contribution to earnings from thePolyurethanes division declined, however.In the Performance Products segment, sales increased as aresult of the Ciba acquisition. Volumes and prices declined, however,in all the divisions of the segment. Income from operationswas negative due to the crisis in nearly all customer industriesand the special charges associated with the Ciba integration.SalesIncome from operationsSales decline significantly; lower prices and volumes dueto crisis in key customer industriesDecline in earnings due to weak demand;measures to increase efficiency nevertheless effective;high one-time expenses for Ciba integration– 19%– 43%
38Management’s <strong>Analysis</strong> <strong>BASF</strong> <strong>Report</strong> 2009The business year at <strong>BASF</strong> GroupBusiness review <strong>BASF</strong> GroupSales fell sharply in the Functional Solutions segment as aresult of a dramatic decline in demand from the key customerindustries – construction and automotive. In the Catalysts division,lower precious metal prices led to a decrease in sales inprecious metals trading. The segment’s earnings were belowthe previous year’s level. The Catalysts division was particularlyimpacted by the drop in automotive and chemical productionand therefore posted significantly lower earnings. The ConstructionChemicals and Coatings divisions, however, increased earningsas a result of better margins and cost-cutting measures.Sales in the Agricultural Solutions segment increased furtherin 2009, and earnings reached a record high. This was primarilyattributable to higher prices and positive currency effects,which more than offset the planned increase in spending forresearch and development as well as for marketing and sales.Sales in the Oil & Gas segment declined significantlycompared with the previous year. This was mainly due to lowerprices for crude oil and natural gas. In 2009, earnings were lowerthan in 2008 as a result of the smaller contribution from theExploration & Production business sector due to the decline inoil prices.At €4,577 million, sales in “Other” fell by €2,073 million comparedwith the previous year. The decline was mainly due to lowersales in the Styrenics and fertilizers businesses and in the tradewith raw materials. Income from operations in Other was minus€627 million in 2009, an improvement of €286 million comparedwith the previous year. This was due primarily to higher earningsin Styrenics and the fact that the previous year included expensesrelated to the hedging of raw material price risks. In 2009, earningswere negatively impacted by higher expenses for the <strong>BASF</strong>options program (BOP) and currency losses.Earnings after cost of capital amounted to minus €226 millioncompared with €1,621 million in 2008.Special itemsIncome from operations was negatively impacted by specialcharges of €1,175 million in 2009 compared with €393 millionin 2008.The integration of Ciba resulted in special charges of€718 million, primarily for the restructuring of sites, the impairmentof Ciba’s IT system and the step-up of inventory.Restructuring measures resulted in special charges of€366 million from write-downs on closed plants as well as severancepayments related to the reduction in personnel as partof the restructuring measures.Other gains and charges totaled minus €85 million. Thisamount primarily comprises impairment losses on goodwill inthe Inorganics and Care Chemicals divisions and a fine imposedon Ciba by the European Commission.Net incomeThe financial result was minus €598 million in 2009, comparedwith minus €487 million in 2008.Earnings of companies accounted for using the equitymethod increased compared with the previous year. In particular,this was the result of exchange rate gains from foreign currencyloans at the production company for the Yuzhno Russkoyenatural gas field (OAO Severneftegazprom). Other income fromparticipations increased due to higher dividend income.The financing of the Ciba acquisition led to an increase ininterest expenses. Interest income declined, primarily due to therepayment of loans by OAO Severneftegazprom (which isaccounted for using the equity method) and the lower level ofinterest rates.Other financial expenses increased as a result of higherexpenses for pension benefits compared with the previous year.Income from operations– Income from operations down 43% compared with2008 to €3,677 million– High special charges due to integration of Ciba and otherrestructuring measures– Cost of capital goal narrowly missed (minus €226 million)Special items (million €)2009 2008Integration costs (Ciba and other) (723) .Restructuring measures (366) (257)Divestitures (1) (5)Other charges and income (85) (131)(1,175) (393)
<strong>BASF</strong> <strong>Report</strong> 2009The business year at <strong>BASF</strong> GroupManagement’s <strong>Analysis</strong>Business review <strong>BASF</strong> Group39Income before taxes and minority interests amounted to€3,079 million compared with €5,976 million in 2008. The returnon assets declined to 7.5% (2008: 13.5%).The tax rate of 46.2% was 1.5 percentage points higherthan in 2008 due to one-time effects related to the integrationof Ciba. In 2008, the tax rate was lower as a result of higherprofits from companies in countries with lower tax burdens.The rise in the tax rate would have been even higherwithout the decline in non-compensable income taxes on oilproduction, which decreased from €1,851 million in 2008 to€870 million in 2009 as a result of lower oil prices.For more on the tax rate, see the Notes on page 165Net income declined by €1,502 million, or 51.6%, to €1,410 million.Minority interests were mainly related to Gazprom’s stakesin natural gas trading companies as well as in a GermanWintershall subsidiary that holds production and explorationrights to onshore concessions in Libya.Earnings per share were €1.54 compared with €3.13in 2008. Adjusted for special items and the amortization ofintangible assets, earnings per share amounted to €3.01 in 2009(2008: €3.85).For more on the accounting methods, see the Notesfrom page 143 onwardCash flowDespite the economic crisis, we generated cash from operatingactivities of €6,270 million compared with €5,023 million inthe previous year. This record high was reached thanks to a significantreduction in net working capital and rigorous measuresto increase efficiency. At €3,763 million, free cash flow was alsohigh (2008: €2,502 million).Adjusted earnings per shareEarnings per share adjusted for special items and the amortizationand impairment of intangible assets is a key ratio that offerslong-term comparability and is particularly suitable for predictingfuture profitability. This key ratio was first published in ourreporting for the first half of 2009 and has been a part of ourquarterly and annual financial reporting since then.Adjusted earnings per shareMillion € 2009 2008Income before taxes and minority interests 3,079 5,976Special items 1,175 393Amortization of intangible assets 1,097 618Amortization of intangible assets contained in thespecial items (500) (37)Adjusted income before taxes and minority interests 4,851 6,950Adjusted income taxes 1,837 2,951Adjusted income before minority interests 3,014 3,999Adjusted minority interests 253 416Adjusted net income 2,761 3,583Weighted average number ofoutstanding shares (in thousands) 918,479 930,103Adjusted earnings per share (€) 3.01 3.85Adjusted income before taxes and minority interests, adjustednet income and adjusted earnings per share are key ratios thatare not defined according to International Financial <strong>Report</strong>ingStandards (IFRS). They should therefore be viewed primarily assupplementary information.For more information on the earnings per share according to IFRS,see the Notes on page 157Net income– Interest expenses increase due to financing ofCiba acquisition– Expenses for pension benefits higher than in 2008– Income taxes rise due to one-time effects from theintegration of CibaEarnings per share/cash flow– Earnings per share €1.54, a decrease of 50.8%compared with 2008– Adjusted earnings per share decrease by 22% to€3.01 compared with previous year– Cash provided by operating activities at record high of€6,270 million, an increase of €1,247 million comparedwith previous year
40Management’s <strong>Analysis</strong> <strong>BASF</strong> <strong>Report</strong> 2009The business year at <strong>BASF</strong> GroupConsolidated balance sheetsConsolidated balance sheetsAssetsDecember 31, 2009 December 31, 2008Million € % Million € %Intangible assets 10,449 20.4 9,889 19.4Property, plant and equipment 16,285 31.8 15,032 29.6Investments accounted for using the equity method 1,340 2.6 1,146 2.3Other financial assets 1,619 3.2 1,947 3.8Deferred taxes 1,042 2.0 930 1.8Other receivables and miscellaneous long-term assets 946 1.8 642 1.3Long-term assets 31,681 61.8 29,586 58.2Inventories 6,776 13.2 6,763 13.3Accounts receivable, trade 7,738 15.1 7,752 15.2Other receivables and miscellaneous short-term assets 3,223 6.3 3,948 7.8Marketable securities 15 . 35 0.1Cash and cash equivalents 1,835 3.6 2,776 5.4Short-term assets 19,587 38.2 21,274 41.8Total assets 51,268 100.0 50,860 100.0Stockholders’ equity and liabilitiesDecember 31, 2009 December 31, 2008Million € % Million € %Subscribed capital 4,405 8.6 4,417 8.7Retained earnings 12,916 25.2 13,250 26.0Other comprehensive income 156 0.3 (96) (0.2)Minority interests 1,132 2.2 1,151 2.3Stockholders’ equity 18,609 36.3 18,722 36.8Provisions for pensions and similar obligations 2,255 4.4 1,712 3.4Other provisions 3,289 6.4 2,757 5.4Deferred taxes 2,093 4.1 2,167 4.3Financial indebtedness 12,444 24.3 8,290 16.3Other liabilities 898 1.7 917 1.8Long-term liabilities 20,979 40.9 15,843 31.2Accounts payable, trade 2,786 5.4 2,734 5.4Provisions 3,276 6.4 3,043 6.0Tax liabilities 1,003 2.0 860 1.7Financial indebtedness 2,375 4.6 6,224 12.2Other liabilities 2,240 4.4 3,434 6.7Short-term liabilities 11,680 22.8 16,295 32.0Total stockholders’ equity and liabilities 51,268 100.0 50,860 100.0
<strong>BASF</strong> <strong>Report</strong> 2009The business year at <strong>BASF</strong> GroupManagement’s <strong>Analysis</strong>Consolidated balance sheets41Long-term assets rose by €2,095 million to €31,681 million, primarilydue to the acquisition of Ciba Holding AG. <strong>BASF</strong> obtainedcontrol over Ciba on April 9, 2009. The purchase price amountedto €2,178 million. The acquisition resulted in an increase in goodwillof €571 million, in other intangible assets of €1,095 millionand in tangible fixed assets of €1,766 million. Without adjustingfor the acquisition of Ciba, capital expenditures were below thelevel of depreciation and amortization.The increase in the value of investments accounted for usingthe equity method was due to the addition of an associatedcompany in the course of the Ciba acquisition and a capitalincrease at Nord Stream AG. Other financial assets declined in2009 because the 15.2% stake in Ciba acquired up to the endof 2008 – valued at €344 million – had previously been reportedin this item. Higher market values for pension assets led to anincrease in other long-term assets.The acquisition of Ciba resulted in an addition to inventoriesof €1,091 million and an addition to trade accounts receivableof €391 million. Nevertheless, due to plant shutdowns andour measures to adjust capacities, inventories at the end of 2009were at the same level as at the end of 2008. Trade accountsreceivable also remained unchanged compared with the previousyear. Taking into account the acquisition of Ciba, we significantlyreduced net working capital and increased cash flow toa record high.Other receivables and miscellaneous assets declined by€725 million to €3,223 million compared with the previous year.In 2008, this item included higher market values from currencyderivatives as well as sums deposited as securities for commodityderivatives with negative fair values.Stockholders’ equity declined by €113 million to €18,609 millionat the end of 2009. This was primarily due to dividendpayments of €2,089 million and lower net income comparedwith 2008. The decline was partially offset by actuarial gains onpension plan assets.Long-term liabilities rose by €5,136 million to €20,979 million.Provisions for pension obligations rose due to additions associatedwith the Ciba acquisition. This was partially offset by theincrease in the market value of pension plan assets. Other longtermprovisions also rose compared with 2008, primarily due toCiba. This related mainly to provisions for measures for environmentalsite remediation. To finance the Ciba acquisition and toextend the maturity profile of our financial liabilities, we issuedseveral bonds in 2009 with a total carrying amount of €4,440 millionas of the balance sheet date.More on the fair value of our financial indebtedness in the Notes tothe Consolidated Financial Statements on page 191Net debt (million €)Dec. 31, 2009 Dec. 31, 2008Cash and cash equivalents 1,835 2,776Financial indebtedness 14,819 14,514Net debt 12,984 11,738Short-term liabilities declined by €4,615 million to €11,680 million,primarily due to the lower volume of outstanding commercialpaper. Short-term provisions rose, in particular due to therecognition of provisions for severance payments that are to bemade as part of the integration of Ciba and further restructuringmeasures.More on the composition and development of provisions can befound in the Notes to the Consolidated Financial Statements onpage 182More on the development of the balance sheet can be found in theten-year summary on page 213AssetsStockholders’ equity and liabilities– Ciba acquisition: Purchase price of €2,178 million,contribution to sales of €2,310 million in 2009– Additions of €571 million to goodwill and €1,095 millionto other intangible assets due to Ciba– Inventories and receivables match previous year’s level;additions resulting from the Ciba acquisition offsetthanks to rigorous management of net working capital– Stockholders’ equity decreases slightly, due primarilyto dividend and lower net income– Long-term liabilities increase due to issuance of bonds– Short-term liabilities decline due to decrease in volumeof commercial paper
42Management’s <strong>Analysis</strong> <strong>BASF</strong> <strong>Report</strong> 2009The business year at <strong>BASF</strong> GroupLiquidity and capital resourcesLiquidity and capital resourcesValue-based financial management, high cash flowWith our value-based financial management, we aim tosecure the financial flexibility needed to continuouslydevelop our business portfolio and take advantage ofstrategic options. Priority is placed on an appropriatecapital structure while maintaining liquidity and limitingfinancial risks. We aim for a solid A rating which is supportedby sustainably good cash flow.Financing policyThe objectives of our financing policy are to ensure liquidity, limitfinancial risks and optimize the cost of capital. Our financialactivities are conducted in line with the needs of the operationalbusiness and the company’s strategic direction. We will maintainour financing policy in 2010. Even in very difficult economictimes, we aim to offer our shareholders an attractive dividendyield. We aim to increase our dividend each year, or at leastmaintain it at the previous year’s level.Consolidated statements of cash flows (million €)2009 2008Net income 1,410 2,912Depreciation and amortization of intangible assets, property, plant and equipment and financial assets 3,740 3,180Changes in working capital 1,567 (1,339)Miscellaneous items (447) 270Cash provided by operating activities 6,270 5,023Payments related to property, plant and equipment and intangible assets (2,507) (2,521)Acquisitions/divestitures (1,447) (564)Financial investments and other items (128) (375)Cash used in investing activities (4,082) (3,460)Capital increases/repayments, share repurchases (134) (1,573)Changes in financial liabilities (910) 4,189Dividends (2,089) (2,157)Cash provided by (used in) financing activities (3,133) 459Net changes in cash and cash equivalents (945) 2,022Cash and cash equivalents as of beginning of year and other changes 2,780 754Cash and cash equivalents as of end of year 1,835 2,776Cash flow (billion €)6543Cash provided by operating activitiesPayments related to property, plant and equipmentand intangible assetsFree cash flow 1210200520062007200820091Cash provided by operating activities minus payments related to property,plant and equipment and intangible assets, in 2005 excluding externalfinancing of pension obligations (CTA)
<strong>BASF</strong> <strong>Report</strong> 2009The business year at <strong>BASF</strong> GroupManagement’s <strong>Analysis</strong>Liquidity and capital resources43Cash provided by operating activitiesIn 2009, cash provided by operating activities amounted to€6,270 million. We thus exceeded the previous year’s figuredespite the difficult economic environment and significantlylower net income. Funds of almost €1.6 billion were releasedthanks to a significant reduction in net working capital. Adjustedfor the acquisition of Ciba Holding AG and currency effects, receivablesdeclined by around €2.1 billion and inventories by approximately€1.1 billion. Depreciation and amortization increasedby €0.6 billion to €3.7 billion, in particular as a result of the acquisitionand integration of Ciba. Cash contributions of €220 millionwere made into the German <strong>BASF</strong> Pensionskasse (pensionfund). Miscellaneous items included the adjustment of variousnon-cash income items and reclassification of equity incomeand minority interests.Cash used in investing activitiesIn 2009, cash used in investing activities amounted to €4,082 millioncompared with €3,460 million in 2008. In 2009, paymentsrelated to property, plant and equipment and intangible assetswere again clearly below depreciation and amortization.The completion of the Ciba acquisition on April 9, 2009, ledto an outflow of liquid funds of €1,746 million and an addition ofcash and cash equivalents from Ciba of €241 million.A cash inflow of €62 million resulted from the divestiture ofnumerous smaller activities.In 2009, free cash flow, defined as the difference betweencash provided by operating activities and payments related toproperty, plant and equipment and intangible assets, amountedto €3,763 million (2008: €2,502 million).For more on additions to property, plant and equipment, see page 47onwardFinancial assets and other items resulted in a net cash outflowof €128 million, compared with an outflow of €375 million in2008. Payments were primarily due to a shareholder loan forthe financing of Nord Stream AG and, to a lesser extent, a capitalcontribution. In addition, we participated in the capital increaseof K+S Aktiengesellschaft in proportion to our 10.3%stake. Before obtaining control on April 9, 2009, <strong>BASF</strong> had purchasedCiba shares for €88 million. This amount and a further€344 million used for the purchase of Ciba shares in the secondhalf of 2008 were reported as payments for financial investmentsand other items.In 2009, cash inflows resulted from the repayment of loans,mainly from ZAO Achimgaz. This company is proportionally consolidated.Cash provided by (used in) financing activitiesFinancing activities led to a cash outflow of €3,133 million.Dividends of €1,791 million, or €1.95 per share, were paid tothe shareholders of <strong>BASF</strong> SE and €298 million to minorityshareholders in Group companies.The purchase of the remaining outstanding shares in Cibafollowing the change of control on April 9, 2009 led to a cashoutflow of €95 million, which was handled as an equity transactionbetween shareholders.The net result of raising and repaying financial liabilities wasa cash outflow of €910 million, following an inflow of €4,189 millionin the previous year. Additional short-term financial indebtednessincurred in the second quarter to finance the acquisitionof Ciba was largely repaid over the course of the rest of theyear. Net debt amounted to €12,984 million at the end of 2009,compared with €11,738 million at the end of 2008. At the end of2009, cash and cash equivalents amounted to €1,835 million,compared with €2,776 million at the end of 2008.Consolidated statements of cash flowsCapital expenditures by region (%)2009 2008Europe 70 77North America 19 15Asia Pacific 9 5South America, Africa, Middle East 2 3100 100– Cash provided by operating activities reaches record highof €6,270 million– Free cash flow rises to €3,763 million in 2009, comparedwith €2,502 million in 2008– Net working capital reduced by €1,567 million– Payments related to property, plant and equipment andintangible assets of €2,507 million, significantly belowdepreciation and amortization– Financial liabilities decline by €910 million, despiteacquisition of Ciba
44Management’s <strong>Analysis</strong> <strong>BASF</strong> <strong>Report</strong> 2009The business year at <strong>BASF</strong> GroupLiquidity and capital resourcesCredit ratings and financingWe aim to maintain a solid A rating. This goal is the basis for<strong>BASF</strong>’s capital structure and financing. We manage the capitalstructure of <strong>BASF</strong> by taking into account selected financialratios.Our (A+/A1) ratings have allowed us, and continue to allowus, to access the capital markets to issue bonds. Corporatebonds form the basis of our mid- to long-term debt financing.These are issued in euro and other currencies with differentmaturities to ensure a diverse range of investors and a balancedmaturity profile.Short-term debt financing is primarily secured by our commercialpaper program, which has an issuing volume of up to$12.5 billion. <strong>BASF</strong> always enjoyed full access to the commercialpaper market on attractive terms, also during the financialcrisis. <strong>BASF</strong>’s external financing is therefore largely independentof short-term fluctuations in the credit markets.As back-up for the commercial paper program, there are committed,broadly syndicated credit lines of $6 billion available. Asa result of successful capital market transactions and good cashflow, the committed short-term credit lines of CHF3.5 billion forfinancing the purchase price of Ciba were terminated earlier thanexpected in December 2009. None of the back-up lines were,or are being tapped.For more on the use of financial instruments, see the Notes to theConsolidated Financial Statements on page 189 onwardLiquidity and debt ratio2009 2008Net debt-to-EBITDA ratio =Dynamic debt level (%) =Net debtIncome from operations before depreciation and amortization (EBITDA) 1.8 1.2Cash flow provided by operating activitiesFinancial indebtedness 42 35Leverage (%) = LiabilitiesStockholders’ equity + liabilities 64 63Maturities of financial liabilities (million €)200920102011<strong>2012</strong>201320142015 114,8192,3751,3633,0672,0751,3294,6102008200920102011<strong>2012</strong>20132014 114,5146,2241,0271,4011,4181,9992,4451and thereafterPrinciples and objectives of our financial managementFinancial management in the <strong>BASF</strong> Group is centralized and is supported by regional treasury units. Our financing andinvestment policy is value-based. A suitable capital structure has a higher priority than return aspects. The risks associatedwith currencies, interest rate changes and creditworthiness are analyzed and limited using modern processes and financialinstruments. We manage the capital structure of <strong>BASF</strong> by taking into account selected financial ratios. We aim to maintaina solid A rating.
<strong>BASF</strong> <strong>Report</strong> 2009The business year at <strong>BASF</strong> GroupManagement’s <strong>Analysis</strong>Business review by segment45Business review by segmentSegment overview (million €)Income from operations beforeSalesdepreciation and amortization(EBITDA)Income from operations (EBIT)before special items2009 2008 2009 2008 2009 2008Chemicals 7,515 11,171 1,571 2,053 1,021 1,414Plastics 7,128 9,116 994 947 576 553Performance Products 9,356 8,125 926 1,205 698 766Functional Solutions 7,115 9,388 511 564 209 265Agricultural Solutions 3,646 3,409 973 905 776 706Oil & Gas 11,356 14,445 2,830 4,409 2,289 3,844Other 1 4,577 6,650 (417) (521) (717) (692)50,693 62,304 7,388 9,562 4,852 6,856Segment overview (million €)Income fromoperations(EBIT) Assets Capital expenditures 22009 2008 2009 2008 2009 2008Chemicals 735 1,369 5,688 6,121 482 601Plastics 554 539 4,530 4,826 249 470Performance Products (150) 768 9,242 5,769 3,753 360Functional Solutions 107 151 8,265 8,693 174 234Agricultural Solutions 769 705 4,681 4,352 183 196Oil & Gas 2,289 3,844 8,301 8,356 1,012 1,651Other 1 (627) (913) 10,561 12,743 119 1223,677 6,463 51,268 50,860 5,972 3,6341Information on the composition of “Other” can be found in the Consolidated Financial Statements from page 158 onward.2Additions to property, plant and equipment (thereof from acquisitions: €1,766 million in 2009 and €363 million in 2008) and intangible assets (thereof from acquisitions:€1,670 in 2009 and €745 million in 2008)Sales by segmentContributions to EBITDA by segment1 Chemicals 15%711 Chemicals 21%2 Plastics 14%2 Plastics 13%3 Performance Products 18%4 Functional Solutions 14%5 Agricultural Solutions 7%6€50,693million23 Performance Products 13%4 Functional Solutions 7%5 Agricultural Solutions 13%6 Oil & Gas 22%7 Other 10%5436 Oil & Gas 38%7 Other (5%)
46Management’s <strong>Analysis</strong> <strong>BASF</strong> <strong>Report</strong> 2009The business year at <strong>BASF</strong> GroupBusiness review by segmentSales (million €)1st quarter 2nd quarter 3rd quarter 4th quarter2009 2008 2009 2008 2009 2008 2009 2008Chemicals 1,556 2,763 1,809 3,081 2,000 3,033 2,150 2,294Plastics 1,463 2,390 1,750 2,495 1,967 2,452 1,948 1,779Performance Products 1,677 2,004 2,443 2,081 2,651 2,126 2,585 1,914Functional Solutions 1,568 2,394 1,755 2,490 1,888 2,479 1,904 2,025Agricultural Solutions 1,145 946 1,175 1,159 623 636 703 668Oil & Gas 3,894 3,744 2,452 3,201 2,389 3,182 2,621 4,318Other 1 916 1,680 1,118 1,798 1,280 1,864 1,263 1,30812,219 15,921 12,502 16,305 12,798 15,772 13,174 14,306Income from operations (EBIT) before special items (million €)1st quarter 2nd quarter 3rd quarter 4th quarter2009 2008 2009 2008 2009 2008 2009 2008Chemicals 84 532 258 377 364 401 315 104Plastics (29) 352 138 285 216 198 251 (282)Performance Products 123 209 80 221 286 221 209 115Functional Solutions (46) 140 48 111 106 117 101 (103)Agricultural Solutions 344 259 367 363 21 31 44 53Oil & Gas 725 984 506 1,026 550 870 508 964Other 1 (216) (122) (257) 25 (295) (270) 51 (325)985 2,354 1,140 2,408 1,248 1,568 1,479 526Income from operations (EBIT) (million €)1st quarter 2nd quarter 3rd quarter 4th quarter2009 2008 2009 2008 2009 2008 2009 2008Chemicals 83 532 258 377 364 401 30 59Plastics (30) 351 139 285 216 194 229 (291)Performance Products 123 217 (214) 244 125 221 (184) 86Functional Solutions (45) 137 29 108 86 112 37 (206)Agricultural Solutions 340 259 366 363 21 31 42 52Oil & Gas 725 984 506 1,026 550 870 508 964Other 1 (268) (177) (312) (44) (391) (320) 344 (372)928 2,303 772 2,359 971 1,509 1,006 2921Information on the composition of “Other” can be found in the Consolidated Financial Statements from page 158 onward.Contributions to EBIT by segment (million €)EBIT <strong>BASF</strong> Group by quarter (million €)Chemicals 735Plastics 554Performance Products (150)Functional Solutions 107Agricultural Solutions 769Oil & Gas 2,289Other (627)1st quarter 20091st quarter 20082nd quarter 20092nd quarter 20083rd quarter 20093rd quarter 20084th quarter 20094th quarter 20089282,3037722,3599711,5091,006292
<strong>BASF</strong> <strong>Report</strong> 2009The business year at <strong>BASF</strong> GroupManagement’s <strong>Analysis</strong><strong>BASF</strong>’s segments/Chemicals47ChemicalsExcellence in the Verbund, technology and cost leadershipThe Chemicals segment consists of the Inorganics,Petrochemicals and Intermediates divisions. In our integratedproduction facilities – our Verbund – we producea broad range of basic chemicals and higher value productsin Europe, Asia and North America for our internaland external customers.Segment strategyWe create value by driving growth with an attractive portfolio,investments in future markets and process and product innovationsas well as by the competitive and flexible integration ofour production into the <strong>BASF</strong> Verbund structures. We supplythe <strong>BASF</strong> segments with basic chemicals for the production ofhigher value products. As a reliable supplier, we market ourproducts to customers in downstream industries; primarily inthe chemical, electronics, construction, textile, automotive,pharmaceutical and agrochemical industries. We continuallydevelop our value-adding chains with innovations, capitalexpenditures and acquisitions in future markets.Technology and cost leadership are some of our mostimportant success factors. We achieve them by improving processes,implementing market-oriented business models, andefficiently using the synergy potentials of our Verbund. We constantlyoptimize our portfolio and production structures and alignthem with regional market requirements.Our productsThe success of the Inorganics division is based on a productrange comprising basic products and specialties for use in ourVerbund and our business with third parties. Our most importantbasic products are ammonia, methanol, sodium hydroxide,chlorine as well as sulfuric and nitric acid. Our specialties areparticularly geared toward the electronics and pharmaceuticalindustries. We benefit from the knowledge of our customers’technological requirements and demands. For example, wedevelop special additives for the semiconductor industry whichallow copper to be integrated into even the smallest structuresof a chip, thus increasing its electrical conductivity and thereforeits computational speed. We are the market leader in electronicchemicals in Asia and Europe.The Petrochemicals division, with its broad range of basicchemicals, is the foundation of <strong>BASF</strong>’s value-adding chains.Products such as ethylene, propylene, butadiene and benzeneare produced in steam crackers from naphtha or natural gas.Using these, we produce alcohols, solvents and plasticizersfor the chemical and plastics industries. Alkylene oxides andglycols are starting materials for the detergents, automotive,packaging and textile industries. Our acrylic monomers are keycomponents in the production of coatings and cosmetics aswell as oil field, paper and construction chemicals. To meetspecific customer demands, we have a number of specialtymonomers that can be ideally incorporated into the valueaddingchain for acrylates and methacrylates.With more than 600 products, our Intermediates divisiondevelops, produces and markets the world’s most comprehensiverange of intermediates. Our product lines include amines,diols, polyalcohols, acids and specialties. They serve as startingmaterials for products such as coatings, plastics, pharmaceuticals,textile fibers, crop protection products as well asdetergents and cleaners. Our intermediates also help to improvethe properties of the products they are used in and the efficiencyof production processes. Worldwide, <strong>BASF</strong> is among the threelargest suppliers of all significant intermediates.Research and developmentOur research activities are focused on the development ofinnovative production processes that will make us even morecompetitive. We continuously improve existing products andapplications. In developing new products, we look at the needsof our internal and external customers as well as the opportunitiesoffered by the markets and the Verbund’s valueaddingchains.Strategy– Supplying the value-adding chains in the <strong>BASF</strong> Verbundand marketing our products to external customers– Most important success factors are technology and costleadership– Product portfolio and regional production structures arecontinuously optimizedProducts– Inorganics: basic products for our Verbund andspecialties with a clear industry focus– Petrochemicals: broad range of basic chemicals for<strong>BASF</strong>’s value-adding chains as well as for externalcustomers– Intermediates: with more than 600 products, the mostcomprehensive range of intermediates worldwide; leaderin multiple markets
48Management’s <strong>Analysis</strong> <strong>BASF</strong> <strong>Report</strong> 2009The business year at <strong>BASF</strong> Group<strong>BASF</strong>’s segments/ChemicalsCO 2scrubbingCapturing CO 2from power station flue gasesValue for <strong>BASF</strong>No.1preferred partnerof our customers for gaspurification technologyValue for the environment90%less CO 2in combustiongases in coal-fired powerstationsValue for <strong>BASF</strong> We are strengthening our leadingposition in the field of gas scrubbing technology with thedevelopment of an innovative process for carbon capturefrom combustion gases in coal-fired power plants.Value for the environment In the future, carboncapture should allow more than 90% of the CO 2from acoal-fired power plant’s combustion gases to be removed,making this an efficient process for better climateprotection.Our Seluris product range offers, for example, tailor-madeprocess chemicals for the solar industry. These products forcutting, etching, texturing and doping mono- and polycrystallinesolar cells help optimize the production processes andincrease the efficiency of the cells.Under the brand name Basonetic ® , we market a new rangeof magnetorheological fluids (MRF) with a remarkable, adjustableflow behavior. The Basonetic range of MRF consist of verysmall iron particles that are dispersed in oil. Using an externalmagnetic field, the flow properties of MRF can be varied fromsolid to liquid in milliseconds. They are particularly suitable forapplications in which power has to be controlled and transmittedon a continuous, variable basis, such as shock absorbersor electronically adjustable absorbers like those used in suspensionbridges.Together with RWE Power AG and the Linde Group, we areadvancing the development of a new process for carbon capturefrom combustion gases in coal-fired power plants. In 2009,a pilot facility started operations at RWE Power AG’s lignite-firedpower plant in Niederaussem, Germany, which tests new carboncapture technologies and solvents from <strong>BASF</strong>. The goal isto apply carbon capture in lignite-fired power plants by 2015.On the basis of this technology, it should be possible to captureand subsequently store more than 90% of the CO 2from thepower plant’s combustion gases.Marketing and customer relationsFor standard products, it is our primary objective to supply customersreliably and cost-efficiently. Internally, we supply ourproducts to almost all <strong>BASF</strong> divisions. Our products for externalcustomers are mainly marketed via e-commerce. We offerorganic and inorganic specialties with the corresponding technicalapplications know-how. In these areas, our developmentlaboratories work particularly closely with our customers andpartners.For example, together with the machinery manufacturerSchmid, we developed a new, contactless digital laser transferprinting process which can be used to print wafers for the solarcell industry. We developed the paste system for this processand Schmid provided the corresponding printers. The new systemimproves the efficiency of cell production: the contactlessprinting process reduces the breakage rate of the wafers.In 2009, DSM Powder Coating Resins, a <strong>BASF</strong> customerfor many years and the global leader in the powder coating resinindustry, awarded us its “Supplier of the year 2008” distinction.Our contributions to DSM’s success include not only high productquality and reliable deliveries, but also jointly-developedindividual logistics and IT solutions. The company uses our intermediateneopentylglycol to manufacture specialty resins forpowder coatings.For more on customer satisfaction, see page 28Research and development– Focus on innovative production processes to strengthenour competitiveness– Seluris product range offers tailor-made processchemicals to the solar industry– Basonetic: new range of magnetorheological fluids– New technologies and solvents for carbon captureMarketing and customer relations– Reliable and cost-efficient marketing of standardproducts, mainly via e-commerce– Marketing of organic and inorganic specialties with thecorresponding technical applications know-how– Our development laboratories collaborate closely withcustomers and partners– Received award from our customer DSM: “Supplier ofthe year 2008”
<strong>BASF</strong> <strong>Report</strong> 2009The business year at <strong>BASF</strong> GroupManagement’s <strong>Analysis</strong><strong>BASF</strong>’s segments/Chemicals49Capital expendituresLocationProjectAdditional annualcapacity through expansion(metric tons)Total annualcapacity(metric tons)StartupAntwerp, Belgium Construction oleum plant 420,000 2011Guaratinguetá, Brazil Construction sodium methylate plant 60,000 2011Ludwigshafen, Germany Construction cyclododecanone/cyclopentanone 30,000 2009Expansion hydrogen 50,000 Nm 3 /h n/a 2009Expansion higher oxo alcohols 80,000 390,000 2009Construction ethylene/propylene pipeline n/a 2009/2010Nanjing, China 1 Expansion steam cracker 140,000 740,000 2011Construction 2-propylheptanol 80,000 2011Expansion ethylene oxide 80,000 330,000 2011Construction butadiene 130,000 2011Construction isobutene 60,000 2011Construction amines complex 130,000 2011/<strong>2012</strong>1Operated by a joint venture company in which <strong>BASF</strong> has a 50% stake and which is proportionally consolidated in the Group Consolidated Financial StatementsProduction capacities of significant products 1AsiaSouth America, Annual capacityProductEuropeNorth AmericaPacific Africa, Middle East (metric tons)Acrylic acid X X X 1,175,000Alkyl amines X X X 220,000SitesFormic andpropionic acid X X255,000150,000Ammonia X 1,525,000Benzene X X X 820,000Butadiene X X 515,000Butanediol-equivalents X X X 535,000Chlorine X 385,000Ethanolamines and derivatives X 285,000Ethylene X X X 3,235,000Ethylene oxide X X X 1,315,000Formaldehyde condensates X 750,000Neopentyl glycol X X X 165,000Oxo-C 4-alcohols (calculated as butyraldehyde) X X X 1,415,000Polytetrahydrofuran X X X 185,000Propylene X X X 2,480,000Plasticizers X X X 660,0001All capacities included at 100%, including plants belonging to joint ventures.Sales Chemicals(million €)Income from operations Chemicals(million €)2009 7,5152008 11,1712007 10,1332009 7352008 1,3692007 1,918
50Management’s <strong>Analysis</strong> <strong>BASF</strong> <strong>Report</strong> 2009The business year at <strong>BASF</strong> Group<strong>BASF</strong>’s segments/ChemicalsSegment data Chemicals (million €)2009 2008 Change in %Sales to third parties 7,515 11,171 (32.7)Thereof Inorganics 983 1,388 (29.2)Petrochemicals 4,664 7,271 (35.9)Intermediates 1,868 2,512 (25.6)Intersegmental transfers 3,564 5,182 (31.2)Sales including intersegmental transfers 11,079 16,353 (32.3)Income from operations before depreciation and amortization (EBITDA) 1,571 2,053 (23.5)EBITDA as a percentage of sales 20.9 18.4 –Income from operations (EBIT) before special items 1,021 1,414 (27.8)Income from operations (EBIT) 735 1,369 (46.3)Income from operations (EBIT) after cost of capital 185 696 (73.4)Assets 5,688 6,121 (7.1)Research and development expenses 129 146 (11.6)Additions to property, plant and equipment and intangible assets 482 601 (19.8)In 2009, sales to third parties fell sharply to €7,515 million,a decline of €3,656 million compared with theprevious year (volumes –12%, prices –22%, portfolio 0%,currencies 1%). Income from operations also declinedby €634 million to €735 million. In particular, sales andearnings were negatively affected by the dramatic dropin demand at the end of 2008 and in the first quarter of2009, which led us to adjust production and reduce ourinventories. Over the course of the year, our businessrecovered slowly but steadily. We accelerated our activitiesto lower costs and increase efficiency.In 2010, we expect a slight recovery in demand.However, there will be increased pressure on marginsdue to additional capacities, especially for cracker products.As sales increase, earnings are expected to risesignificantly.InorganicsOur sales to third parties in 2009 decreased by €405 million to€983 million (volumes –14%, prices –16%, portfolio 0%, currencies1%). We posted declines in all market segments. The sharpdecrease in sales and volumes that affected all business areasin the fourth quarter of 2008 continued into the first half of 2009.Our businesses recovered in the second half of 2009, but wecould not match the high level achieved in the previous year.Income from operations was significantly below the previousyear’s level and was negative due to a decline in volumesas well as lower prices and margins for basic products, particularlyfor ammonia and methanol. Furthermore, special chargesresulted from the restructuring of <strong>BASF</strong> Fuel Cell GmbH andimpairment losses on intangible assets in the electronic chemicalsbusiness.Factors influencing sales – ChemicalsSales by divisionVolumes –12%Prices –22%Portfolio 0%Currencies 1%Sales –33%1 Inorganics 13%2 Petrochemicals 62%3 Intermediates 25%31€7,515million2
<strong>BASF</strong> <strong>Report</strong> 2009The business year at <strong>BASF</strong> GroupManagement’s <strong>Analysis</strong><strong>BASF</strong>’s segments/Chemicals51We are realigning our activities for the fuel cell market: In the future,we will concentrate competencies for the production ofhigh-temperature membrane electrode assemblies (MEAs) atour site in Somerset, New Jersey. Operational activities at the<strong>BASF</strong> Fuel Cell GmbH site in Frankfurt, Germany, were discontinuedas of December 31, 2009. <strong>BASF</strong> plans to close the sitein the course of 2010.In 2009, our Kaurit ® Light technology was first successfullyintroduced in commercial quantities in the furniture industry. Thistechnology can be used to manufacture light, energy-savingchipboard made from wood chips, the polymer Kaurit Light anda binder (Kaurit glue).For 2010, we expect sales will continue to recover. Despitelower margins, we expect clearly positive income from operationsand higher volumes.Inorganics – Sales by region (location of customer)1 Europe 63%2 North America 8%3 Asia Pacific 23%4South America, Africa,Middle East 6%PetrochemicalsOur sales to third parties in 2009 were €4,664 million, a declineof €2,607 million compared with the previous year (volumes–10%, prices –27%, portfolio 0%, currencies 1%). This declinewas due to the global economic crisis, which caused demandto drop dramatically in almost all business units at the end of2008. At the same time, a sharp decline in raw materials pricesled to significantly weaker product sales.324€983million1For business and inventory management purposes, we had toconsiderably reduce capacities in the first few months of 2009;some plants were temporarily shut down. Over the course ofthe year, sales volumes improved slowly, but did not match thehigh level of the previous year.As a result of the significant increase in raw materials pricesover the course of the year, margins for cracker productsremained at an unsatisfactory level, especially in Asia and NorthAmerica. New capacities, particularly in the Middle East, ledto an oversupply of cracker products there, which meantthat prices could not be increased sufficiently. In Europe, steamcracker shutdowns in the entire industry led to temporarysupply bottlenecks for olefins, which resulted in a relatively highmargin level. Margins for plasticizers, alkylene oxides andglycols were also negatively affected by a sluggish recovery indemand as well as significant overcapacities. In contrast, thebusiness with alcohols, solvents and acrylic monomers wassatisfactory.After a difficult start in the first quarter of 2009, we improvedincome from operations in the subsequent quarters. Overall,however, it remained below the good level of the previousyear.We expect that the positive business development seen inthe last quarters of 2009 will continue in 2010. However, pressureon margins is increasing due to additional productioncapacities in the Middle East and Asia. We anticipate earningswill be above the previous year’s level.Petrochemicals – Sales by region (location of customer)1 Europe 42%2 North America 38%3 Asia Pacific 18%4South America, Africa,Middle East 2%234€4,664million1Inorganics– Decline in sales in all market segments, particularly in thefirst half of 2009– Earnings significantly below the previous year’s level duein part to volumes and prices– Realignment of activities in the market for fuel cells: futureproduction of MEAs at our site in Somerset, New Jersey– Outlook 2010: sales growth and significantly positiveearnings thanks to rising sales volumesPetrochemicals– Sales decline as a result of the economic crisis– Reduction of production capacity at the beginningof 2009; improvement in sales volumes over the courseof the year– Earnings below the good level of 2008 due to lowervolumes and margins– Outlook 2010: higher sales expected despite continuedovercapacities; earnings above previous year’s level
52Management’s <strong>Analysis</strong> <strong>BASF</strong> <strong>Report</strong> 2009The business year at <strong>BASF</strong> Group<strong>BASF</strong>’s segments/ChemicalsIntermediatesIn 2009, the Intermediates division posted sales to third partiesof €1,868 million, 26% less than in 2008 (volumes –18%, prices–10%, portfolio 0%, currencies 2%). Business with products forthe agricultural, energy and pharmaceutical industries remainedlargely stable compared with the previous year. In contrast, thestart of 2009 was affected by the crisis-related sharp drop indemand from customers in the textile, leather, automotive, coatingsand plastics industries that had already caused a weakfourth quarter of 2008. This particularly affected our polyalcoholsand carboxylic acid product lines, as well as butanediol andits derivatives. From April onward, demand began increasingfrom a low level, mainly as a result of government stimulus programs,the end of inventory destocking by customers and soliddemand in Asia.Prices of important raw materials such as natural gas andmethanol fell overall in 2009, but thanks to our “value over volume”strategy, we were able to keep our sales prices largely stableand improve margins – initially for amines and carboxylicacids, and over the course of the year for the butanediol line aswell. Against a backdrop of demand-related lower capacity utilization,we intensified our efforts globally in 2009 to lower costsand increase efficiency.Lower sales volumes reduced income from operations,which did not match the previous year’s level despite improvedmargins and lower fixed costs. Additionally, earnings were negativelyimpacted by special items related mainly to the plannedclosure of our maleic anhydride plant in Feluy, Belgium.In 2009, we started up several new plants, in particular a plantin Ludwigshafen for the production of cyclododecanone, a rawmaterial used in the production of the high-performance plasticpolyamide 12 as well as for fragrances. The <strong>BASF</strong> plant usesan innovative three-stage process, while conventional productionprocesses require five steps. The new facility will be the firstto use nitrous oxide from the Verbund site as an oxidizing agentin industrial-scale production.We expect demand in 2010 to build on the level seen in thesecond half of 2009, but with considerable fluctuations in theindividual markets. Overall in 2010, we aim for higher sales anda significant improvement in earnings compared with the previousyear.Intermediates – Sales by region (location of customer)1 Europe 48%2 North America 16%3 Asia Pacific 32%4South America, Africa,Middle East 4%324€1,868million1Intermediates– Sales lower due to weak demand– Decline in earnings despite improved margins andreduced fixed costs– Special charges resulted from the planned closure of themaleic anhydride production plant in Feluy, Belgium– Outlook 2010: sales growth and significant earningsimprovement despite ongoing uncertaintiesInvestment and research projects– Expansion of the stream cracker in Nanjing, China– Construction of sodium methylate plant inGuaratinguetá, Brazil– Successful market launch of our Kaurit Light technologyfor the furniture industry
<strong>BASF</strong> <strong>Report</strong> 2009The business year at <strong>BASF</strong> GroupManagement’s <strong>Analysis</strong><strong>BASF</strong>’s segments/Plastics53PlasticsEnergy-efficient products and system solutions for our customers<strong>BASF</strong> is one of the world’s leading producers of plastics.Our Performance Polymers and Polyurethanes divisionsoffer energy-efficient products and system solutions aswell as customer-oriented services.StrategyWe concentrate on activities which allow us to distinguish ourselvesfrom our market competitors and offer us profitablegrowth opportunities. Our customers are primarily in the construction,automotive, electrical and electronics, textile, packagingand furniture industries. The diverse properties of our plasticsare also increasingly appealing to customers from otherindustries. By substituting for other materials, we broaden ourportfolio of customer industries, grow faster than the market andbecome less dependent on the cyclicality of individual industries.When developing new products and system solutions,we focus on close cooperation with our customers. We aimto improve our production processes in a sustainable way:conserving more resources, producing more energy efficiently,and using more cost-effective raw materials.Our productsThe Performance Polymers division is one of the world’s leadingsuppliers of engineering plastics, polyamides and polyamideintermediates, foams and specialty plastics.We offer our customers a broad portfolio of engineeringplastics based on polyamide 6 and polyamide 6,6 (Ultramid ® ).This is complemented by our products Ultradur ® , Ultraform ® andUltrason ® . Due to their special mechanical properties and thecombination of low weight with high temperature and chemicalresistance, our engineering plastics are widely used in theautomotive, electrical and electronics industries as well as forhousehold appliances and in sports and leisure products.For the packaging, textile and food industries, we offer polyamidepolymers as important base products for the manufacturingof fibers and films. Our product range also includesEcoflex ® and Ecovio ® – biodegradable specialty plastics for thepackaging industry.Styropor ® and its innovative refinement Neopor ® – both styrenebasedprecursors for foams – are used as insulating material forconstruction and packaging. Our foams contribute not only toenergy efficiency: The melamine-based foam Basotect ® alsoprovides excellent sound absorption in buildings, cars andairplanes.The Polyurethanes division is one of the leading suppliersof basic products, systems and specialties. With our worldwidenetwork of more than 35 polyurethane system houses and ourcomprehensive product and service portfolio, we are the preferredpartner of our customers in many industries.Our polyurethane solutions help to save energy sustainablyand are used extensively for cold as well as heat insulationapplications. Rigid foam products are the preferred material formany cooling systems for food or pharmaceutical products.The use of polyurethane insulation in all the steps of a coldchain saves up to 16 times more energy than is required tomanufacture the polyurethane. Our Elastopor ® , Elastopir ® andElastocool ® materials combine greater insulation capacity withinnovative technology to guarantee superior refrigeration.Furthermore, our polyurethane solutions are used to insulate hotwater tanks and pipelines for district heating or cooling.For more on energy efficiency, see page 94In the automotive industry, polyurethanes help make vehicledesigns lighter and more attractive, and improve their functionality.Manufacturers of shoe soles, mattresses, householdappliances and sports equipment also use the manifold opportunitiesand advantages of this specialty plastic and benefitfrom the knowledge and expertise of our polyurethane expertsworldwide.StrategyProducts– Tapping into new market segments with a diversified andinnovative portfolio– Close cooperation with customers in the development ofnew products and system solutions– Sustainable improvement of production processes toconserve resources and energy– Performance Polymers: engineering plastics, polyamideand polyamide intermediates as well as foams andspecialty plastics for diverse applications– Polyurethanes: basic products, tailor-made systems andspecialties for the construction and automotive industries,household appliances and sports equipment
54Management’s <strong>Analysis</strong> <strong>BASF</strong> <strong>Report</strong> 2009The business year at <strong>BASF</strong> Group<strong>BASF</strong>’s segments/PlasticsResearch and developmentIn addition to innovative production processes, we focus in particularon product and system development. Together with ourcustomers, we have brought many innovations to the market.These include sophisticated automobile components such asengine mounts and body panels that are lighter than metalalternatives, thus helping to reduce fuel consumption. Suchcomponents are developed with <strong>BASF</strong> software directly at thecustomer’s site.On the basis of our well-known Ultramid ® grades, we areoffering a family of new materials under the brand nameUltramid CR. Because Ultramid CR provides even higherstrength, our customers are already using it in innovative enginemounts. The parts made of Ultramid CR reliably withstandengine torques of up to 650 Nm and weigh 35% less than metalcomponents with comparable functionality. This kind of progress– which also goes beyond automotive applications – ismade possible thanks to the development and technical supportwe offer. This ranges from computer simulation studies inthe design phase to component tests in the trial phase that arecarried out at our technical centers for engineering plastics.In addition to other applications, polyurethanes are usedas a thermal insulation core in sandwich building elements.These elements have gained acceptance for use in the constructionof industrial buildings because of their exceptionalthermal and mechanical properties as well as their ease andspeed of installation.Thanks to our ongoing research and development activities,we have also been able to launch new products for othermarkets. One example is Lupranate 280 Isocyanate for MDIbasedfoam – a product with excellent fire-retardant propertiesthat is used in furniture and furnishing applications, such as sofaupholstery.Another innovative example of a polyurethane application isElastopor H: This spray foam safely insulates pipes, even inextreme conditions, thanks to its impermeability and resistanceto high temperatures. In depths of up to 200 meters, ElastoporH sets a new standard for polyurethane foam in terms of insulatingproperties, temperature stability and solidity.UltramidFor dual-clutch transmissionsValue for <strong>BASF</strong>20%market growth for thisplastic application over thenext few yearsValue for the environment14%lower CO 2emissionscompared with conventionalautomatic transmissionsValue for <strong>BASF</strong> Dual-clutch transmissions fromVW, Audi, Ford and BMW are among the mostinnovative automatic transmissions. The plastic partsof the integrated control units for these transmissionsare made of Ultramid A3WG6, a proven polyamideproduced by <strong>BASF</strong>. This material is highly heat-stabilizedand oil-resistant, characteristics that are already ensuringthe transmission’s market success.Value for the environment Thanks to theintelligent Ultramid control unit in the dual-clutchtransmission, it is now possible to further improve theefficiency of these transmissions and to cut fuelconsumption to a level that is even lower than thatof a manual transmission.Research and development– Focus on innovative production processes as well asproduct and system development– Ultramid CR: a resilient plastic, which, when used inengine mounts, weighs up to 35% less than metalcomponents with comparable functionality– Lupranate 280 Isocyanate: flame-retardant applicationfor furniture and furnishings– Elastopor H: impermeable spray foam insulates pipes inextreme conditionsMarketing and customer relations– Quality and efficiency in the marketing of standardproducts– Tailor-made technical marketing for specialtiesand customer-specific products– Intensive cooperation with customers for optimalsolutions and lasting success
<strong>BASF</strong> <strong>Report</strong> 2009The business year at <strong>BASF</strong> GroupManagement’s <strong>Analysis</strong><strong>BASF</strong>’s segments/Plastics55Capital expendituresLocationProjectAdditional annualcapacity through expansion(metric tons)Total annualcapacity(metric tons)StartupLudwigshafen, Germany Expansion Ecoflex 60,000 74,000 2010Expansion Neopor 70,000 150,000 2009Thane, IndiaConstruction compounding plantfor engineering plastics 9,000 2009Production capacities of significant productsAsia,South America, Annual capacityProductEuropeNorth AmericaPacific Africa, Middle East (metric tons)Isocyanate X X X 1,840,000Polyamide X X 700,000Polyamide precursors X X 1,070,000Propylene oxide X X 925,000 1Sites1Of which 800,000 metric tons are for polyurethane applications. Contains the full capacity of three joint venture companies for the production of propylene oxide inBelgium, the Netherlands and Singapore, in which <strong>BASF</strong> has a 50% stake in each and which are proportionally consolidated in the Group Consolidated FinancialStatements.Marketing and customer relationsIn the Plastics segment, we develop, produce and marketstandard products and specialties as well as system solutionsand compounded polymers. For standard products, which wesell in large quantities, the priority lies on quality and efficiency.For specialties and customer-specific products, we focus ontailor-made technical marketing that allows us to implementvalue-based pricing.In the highly service-oriented business with polyurethanesystems and specialties, experience, expertise and closecollaboration with customers are very important. Through ournetwork of more than 35 system houses worldwide, we providefast local support – from technical service and sales to marketing– in the development of customized solutions.We work intensively with our customers from an early stageof development in order to find optimal, sustainable solutionsand thus help them to achieve long-term success.Sales Plastics(million €)Income from operations Plastics(million €)2009 7,1282008 9,1162007 9,5642009 5542008 5392007 1,169
56Management’s <strong>Analysis</strong> <strong>BASF</strong> <strong>Report</strong> 2009The business year at <strong>BASF</strong> Group<strong>BASF</strong>’s segments/PlasticsSegment data Plastics (million €)2009 2008 Change in %Sales to third parties 7,128 9,116 (21.8)Thereof Performance Polymers 3,005 3,976 (24.4)Polyurethanes 4,123 5,140 (19.8)Intersegmental transfers 363 766 (52.6)Sales including intersegmental transfers 7,491 9,882 (24.2)Income from operations before depreciation and amortization (EBITDA) 994 947 5.0EBITDA as a percentage of sales 13.9 10.4 –Income from operations (EBIT) before special items 576 553 4.2Income from operations (EBIT) 554 539 2.8Income from operations (EBIT) after cost of capital 139 (5) .Assets 4,530 4,826 (6.1)Research and development expenses 126 142 (11.3)Additions to property, plant and equipment and intangible assets 249 470 (47.0)Sales to third parties decreased by €1,988 million to€7,128 million (volumes –8%, prices –15%, portfolio 0%,currencies 1%). In contrast, income from operations was€554 million, slightly higher than in 2008. This was mainlythe result of the positive earnings contribution from PerformancePolymers following successful cost reductionmeasures.In 2010, we expect an improvement in sales and asignificant improvement in earnings against thebackdrop of a global economic recovery. At the sametime, we anticipate that demand for our products willremain volatile and that overcapacities will have a negativeimpact on margins.Performance PolymersSales to third parties were €3,005 million, a decline of €971 millioncompared with the previous year (volumes –11%, prices–14%, portfolio 0%, currencies 1%). Demand from our key customerindustries – the automotive, construction, and electricindustries as well as the Asian textiles industry – recovered fromthe drop seen in the second half of 2008, but did not match thelevel seen before the economic crisis. In particular, the engineeringplastics business was adversely affected in the first half ofthe year by weak demand from the automotive industry. Lowerraw materials prices led to a decline in sales prices for standardproducts, but prices for specialties were kept constant.After a loss in the first quarter, business improved in nearlyall business sectors over the course of the year. Demand for engineeringplastics grew in particular as a result of governmentstimulus packages to support the automotive industry. Therevival of economic growth in Asia also boosted demand forpolyamide and intermediates for the textile industry.Short-time work had to be introduced temporarily at ourproduction facilities due to significantly lower sales volumescompared with 2008. Following the divestiture of our site in SealSands, U.K., in 2008, we accelerated the implementation of furthermeasures to adjust capacities and optimize costs. Theseincluded the closure of the Styropor ® production plant in Tarragona,Spain, and the polyamide 6,6 spin grades plant in Ludwigshafen.Thanks to the economic recovery and a number ofFactors influencing sales PlasticsSales by divisionVolumes –8%Prices –15%Portfolio 0%Currencies 1%Sales –22%1 Performance Polymers 42%2 Polyurethanes 58%2€7,128million1
<strong>BASF</strong> <strong>Report</strong> 2009The business year at <strong>BASF</strong> GroupManagement’s <strong>Analysis</strong><strong>BASF</strong>’s segments/Plastics57cost-cutting measures, we recorded positive income fromoperations in 2009 following a loss in 2008.In 2010, we expect volumes to grow in our important markets.Combined with further cost-cutting measures – the closureof polyamide 6 polymerization in Rudolstadt, Germany, andthe restructuring of polyamide 6 production in Ludwigshafen –this is expected to lead to a significant increase in earnings.Performance Polymers – Sales by region (location of customer)1 Europe 49%2 North America 20%3 Asia Pacific 26%4South America, Africa,Middle East 5%324€3,005million1Income from operations declined compared with 2008 due tolower sales volumes and margins.As a leading supplier of polyurethane solutions, we are continuouslyexpanding our global network of system houses. Wehave more than 35 system houses that offer fast local supportin the development of individual solutions as well as technicalservice for our customers in numerous major industries. Withthe establishment of two system houses in Slovakia and Poland,we are meeting the needs of the growing markets in Centraland Eastern Europe. We opened the new system house nearBratislava, Slovakia, at the beginning of December 2009, andour next system house in Poznań, Poland, will start operationsin 2010.Although we expect the economic environment to remaindifficult in 2010, we anticipate an increase in both sales andearnings compared with 2009.PolyurethanesSales to third parties were €4,123 million, €1,017 million less thanin 2008 (volumes –6%, prices –16%, portfolio 0%, currencies2%). We posted a decline in sales in all regions and product linesin 2009 due to lower volumes and prices. Our basic productsMDI, TDI and polyols were more strongly affected by this developmentthan the elastomers and the systems businesses.Demand from important customer industries such as automotiveand construction declined globally compared with the previousyear, particularly in Europe and North America. Only in thefurniture and household goods sectors were sales volumesalmost at the 2008 level. Supported by the positive developmentin China, demand for polyurethanes in Asia matched theprevious year’s level.Toward the end of 2009, we were able to implement successiveprice increases and thereby offset higher raw materialand energy prices. Our margins – in particular for MDI andTDI – were significantly lower than in 2008 due to a sharp fall inprices at the beginning of the year.Polyurethanes – Sales by region (location of customer)1 Europe 37%2 North America 22%3 Asia Pacific 34%4South America, Africa,Middle East 7%34€4,123million21Performance PolymersPolyurethanes– Sales decline as a result of weak demand from maincustomer industries– Positive earnings following a loss in 2008– Acceleration of measures to adjust capacities andoptimize costs– Outlook 2010: sales growth and significant improvementin earnings, chiefly due to higher volumes– Sales decrease in all regions and product lines due tofalling volumes and lower prices– Earnings below previous year’s level as a result of lowersales volumes and margins– Continuous expansion of our system house network– Outlook 2010: sales and earnings growth despite ongoingdifficult market environment
58Management’s <strong>Analysis</strong> <strong>BASF</strong> <strong>Report</strong> 2009The business year at <strong>BASF</strong> Group<strong>BASF</strong>’s segments/Performance ProductsPerformance ProductsInnovative, high-growth specialtiesThe Performance Products segment consists of the Dispersions& Pigments, Care Chemicals, Paper Chemicalsand Performance Chemicals divisions. Our customersuse our products and services to make their processesmore efficient and give their products special characteristicssuch as heat resistance, UV stability or color.Segment strategySpecialties make up a major part of our product range. Key successfactors are innovations, close relationships with leadingcompanies in our customer industries as well as special expertisein applications and development. Our products createadditional value for our customers, which allows them to standout from their competitors. This is why we prefer to develop newsolutions together with our customers and strive for long-termcollaborations which create profitable growth opportunities forboth sides.We have a different business model for standard products,such as vitamins or dispersions for paper coatings. Here, efficientproduction structures within the <strong>BASF</strong> Verbund, capacitymanagement as well as technology and cost leadership arecrucial. We support our customers by being a reliable supplierwith lean processes, consistent product quality and a goodprice/performance ratio.A central element of the value-adding strategy is the activemanagement of our business and product portfolio. We expandour share of innovative, cyclically resilient, and growth businessesthrough acquisitions and divestitures. With the acquisitionof Ciba Holding AG in April 2009, we expanded and reorganizedthe Performance Products segment. We havesignificantly strengthened our position in certain specialty markets– in particular in plastic additives – and we are now marketleader in several business areas.One of the most important challenges facing the PerformanceProducts segment is the restructuring and repositioning of thecombined businesses in order to ensure they have a sustainableand profitable market position. To this end, we are definingand implementing new strategies and appropriate businessmodels.Integration of Ciba<strong>BASF</strong> acquired Ciba Holding AG on April 9, 2009. Almost all ofthe Ciba businesses have been integrated into the PerformanceProducts segment. To prepare for the realization of the integration,the segment’s divisions had already been reorganized asof April 1, 2009. In addition to the three existing divisions, thenew Paper Chemicals division was established, which includes<strong>BASF</strong>’s business with paper chemicals, binders and kaolin mineralsand since mid-2009 all of Ciba’s paper activities. TheAcrylics & Dispersions division was fundamentally reorganizedand renamed Dispersions & Pigments. This operating divisionnow combines <strong>BASF</strong>’s and Ciba’s businesses with raw materialsfor the coatings and paints industry. Ciba’s businesses withplastic additives and water treatment chemicals as well asothers were assigned to the Performance Chemicals division.We also expanded the Care Chemicals portfolio with the integrationof Ciba. The segment now comprises the divisionsDispersions & Pigments, Care Chemicals, Paper Chemicals andPerformance Chemicals.The integration of the businesses acquired from Ciba intothe various divisions is proceeding rapidly, even faster thanplanned in some areas. In July 2009, the implementation phasebegan, which includes the introduction of <strong>BASF</strong> IT systems, thetransfer of central functions such as human resources andfinance to <strong>BASF</strong> service platforms and the consolidation ofcompany structures and operating sites. All the essentialstructural integration measures are expected to be completedby April 2010.Strategy– Specialties: innovation, close links to leading customercompanies, expertise in applications and development– Standard products: efficient production structures in theVerbund, technology and cost leadership– Significantly strengthened position in the specialty marketthrough the integration of CibaIntegration of Ciba– Acquisition of Ciba Holding AG on April 9, 2009– Acquired Ciba businesses primarily integrated into thePerformance Products segment– Rapid integration of Ciba, faster than planned in someareas: integration costs of €785 million in 2009, of whicharound €150 million were cash costs– From the end of <strong>2012</strong> at the latest, synergies are expectedto be more than €450 million annually
<strong>BASF</strong> <strong>Report</strong> 2009The business year at <strong>BASF</strong> GroupManagement’s <strong>Analysis</strong><strong>BASF</strong>’s segments/Performance Products59As a result of the rapid integration, a major share of the relatedcosts was incurred in 2009. For the full year 2009, the negativeimpact on earnings was €785 million, of which around €150 millionwere cash costs. From the end of <strong>2012</strong> at the latest, weexpect the combined business to generate synergies of morethan €450 million per year. We expect to achieve recurringannual savings of €350 million by the end of 2010.Our productsThe new Dispersions & Pigments division bundles productsfor the coatings and paints industry in particular. The portfolio,which has been strengthened by the Ciba acquisition, includespigments, resins, dispersions and additives such as photoinitiators,UV filters and formulation additives. Other customer industriesinclude the adhesive, printing and packaging industries.Our product range for these customers includes everything fromdispersions for labels, protective film and adhesive tape to colorand effect pigments as well as resins for water-based printingsystems. Our dispersions and additives are also used in the productionof nonwoven materials, fiber components and constructionchemicals.The Care Chemicals portfolio comprises products forcleaning, care, cosmetics and hygiene. These mainly includepolymers, surfactants, chelating agents, UV filters and otherspecialties that are also increasingly being used in chemicalengineering industries. The division’s portfolio was expanded in2009. The superabsorbents business, which belonged to theAcrylics & Dispersions division prior to the Ciba acquisition, wastransferred to the new Hygiene business sector. We have integratedestablished businesses from the former Ciba portfolio –such as UV filters, biocides and optical brighteners – in Detergents& Formulators and Personal Care Ingredients. Human andanimal nutrition and pharmaceuticals are core Care Chemicalsbusinesses. The main nutrition products are vitamins, carotenoidsand enzymes. We provide the pharmaceutical industrywith active ingredients such as caffeine and ibuprofen, aswell as excipients and customized synthesis services. In addition,we produce aroma chemicals for the flavor and fragranceindustry.The Paper Chemicals division was established in 2009 tofocus on the specific challenges of the business with the paperindustry. The acquisition of Ciba rounded out the portfolio, whichcomprises binders, functional and process chemicals, starchproducts and kaolin minerals. Our comprehensive range ofcustomized solutions optimizes costs and efficiency in thepaper manufacturing process, gives paper certain attributesand enhances the aesthetics and performance of printed paperand board.The Performance Chemicals division offers innovative,specific solutions for various industrial customer industries.A new and important business area is plastic additives, whichwas integrated into the division following the Ciba acquisition.The product portfolio for the plastics processing industrycomprises antioxidants, pigments, light stabilizers and specialtyadditives. With the integration of the Ciba businesses, weexpanded our selection of mining and oilfield chemicals andadded water treatment chemicals as a new business sector tothe division. For the automotive and refinery industries, wedevelop brake fluids, engine coolants, fuel and lubricant additivesas well as process and refinery chemicals. The division alsomakes chemicals for the production and finishing of leather andtextiles.Reorganization of the segmentProducts– Effective April 1, 2009, the segment consists of thedivisions Dispersions & Pigments, Care Chemicals, PaperChemicals and Performance Chemicals– Acrylics & Dispersions division was completelyreorganized and renamed Dispersions & Pigments– New Paper Chemicals division bundles the business withpaper chemicals, binders and kaolin minerals.– Dispersions & Pigments: products for the coatings andpaints industry– Care Chemicals: products for cleaning, care, cosmetics,hygiene, nutrition and pharmaceuticals– Paper Chemicals: solutions for the paper industry– Performance Chemicals: specialties for diverse industrialapplications
60Management’s <strong>Analysis</strong> <strong>BASF</strong> <strong>Report</strong> 2009The business year at <strong>BASF</strong> Group<strong>BASF</strong>’s segments/Performance ProductsKeropur gasoline additives rangeGasoline additives combined with technical expertiseValue for <strong>BASF</strong>No.1preferred partner for thedevelopment of innovativegasoline additivesValue for the environment2%less CO 2emissions forgasoline enginesValue for <strong>BASF</strong> We are a global market leader withour Keropur gasoline additives range. This is not onlybecause the additives help reduce an engine’s fuel consumption,for example – our expertise in this area is alsoof great importance to our customers. We have developeda special method to demonstrate how much gasolineis saved when an additive is used. This allows our customersto market their fuels more efficiently, with the helpof our expertise.Value for the environment Keropur is also betterfor the environment. Our gasoline additive range with frictionmodifiers leads to a 2% reduction in CO 2emissionsfrom gasoline engines.Research and developmentThe success of the Performance Products segment is driven byproduct innovations. We focus on the needs of our customersand sustainable market trends. For example, we developed frictionmodifiers as a new component of our Keropur ® range ofgasoline additives that help reduce an engine’s fuel con sumptionand CO 2emissions. Our new detergent surfactant Lutensol ® Malso helps to save energy because it reaches its full cleaningpotential even at washing temperatures below 30°C.Close collaboration with innovation leaders among our customersis key for the development and successful market launch ofnew solutions. For instance, we worked intensively with ourBelgian partner N.V. Recticel S.A., a leading polyurethaneprocessor, on the development of the plastics additiveUvinul ® 5080 H. This cooperation produced a plastic for use indashboards which releases significantly less volatile substancesthan conventional materials.Our resources to develop new solutions are concentratedon innovative, rapidly growing markets and applications in whichwe can set ourselves apart from competitors through exceptionalexpertise. Simultaneously, we pursue the further developmentand increase the flexibility of our production technologiesand processes. This is particularly true for our vitaminproduction in the Care Chemicals division and our dispersionsplants worldwide.Marketing and customer relationsOur customer portfolio is made up of large and medium-sizedenterprises, global and regional customers in almost all areasof the consumer and capital goods industries. We offer directand individual service – with many customers, we have had businesscollaborations and partnerships for many years. In additionto innovative products, we often offer application servicesas well. We follow a value-based pricing strategy that is orientedon the overall added benefit that customers gain from oursolutions.We work with specialized distributors for the servicing ofsmaller customers and for certain products and applications.We also supply internal customers, for example <strong>BASF</strong>’s Coatingsand Construction Chemicals divisions, which receiveimportant raw materials from the divisions in the PerformanceProducts segment.Research and developmentMarketing and customer relations– Product innovation: focused on customers’ needs andsustainable market trends– Close cooperation with innovation leaders among ourcustomers– Resources concentrated on developing new solutions forinnovative and fast-growing markets– Further development and increasing the flexibility of ourproduction technology and processes– Broad customer portfolio: Large and medium-sizedglobal and regional customers from almost all areas ofthe consumer and capital goods industries– In addition to innovative products, applications servicesare often part of the solution package– Specialized distribution partners to serve smallercustomers as well as for certain products andapplications
<strong>BASF</strong> <strong>Report</strong> 2009The business year at <strong>BASF</strong> GroupManagement’s <strong>Analysis</strong><strong>BASF</strong>’s segments/Performance Products61Capital expendituresLocationProjectAdditional annualcapacity through expansion(metric tons)Total annualcapacity(metric tons)StartupLudwigshafen, Germany Construction chelating agent n/a 2010Expansion polyisobutene 25,000 40,000 2010Nanjing, China Construction surfactants 60,000 2011/<strong>2012</strong>Construction polyisobutene 50,000 2011/<strong>2012</strong>Construction superabsorbent to be determined to be determinedWyandotte, Michigan Construction water-based resins n/a 2009Production capacities of significant productsAsiaSouth America, Annual capacityProductEuropeNorth AmericaPacific Africa, Middle East (metric tons)Citral X 40,000HDI (hexamethylendiisocyanate) X 10,000Chelating agent X X X 120,000Methanesulfonic acid X 10,000Nonionic surfactants X X 435,000Organic pigments X X X X n/aPolyisobutene X 145,000Superabsorbents X X X 400,000SitesSales Performance Products(million €)Income from operations Performance Products(million €)2009 9,3562008 8,1252007 8,0882009 (150)2008 7682007 638
62Management’s <strong>Analysis</strong> <strong>BASF</strong> <strong>Report</strong> 2009The business year at <strong>BASF</strong> Group<strong>BASF</strong>’s segments/Performance ProductsSegment data Performance Products (million €)2009 2008 Change in %Sales to third parties 9,356 8,125 15.2Thereof Dispersions & Pigments 2,445 2,239 9.2Care Chemicals 3,405 3,593 (5.2)Paper Chemicals 1,326 1,030 28.7Performance Chemicals 2,180 1,263 72.6Intersegmental transfers 319 345 (7.5)Sales including intersegmental transfers 9,675 8,470 14.2Income from operations before depreciation and amortization (EBITDA) 926 1,205 (23.2)EBITDA as a percentage of sales 9.9 14.8 –Income from operations (EBIT) before special items 698 766 (8.9)Income from operations (EBIT) (150) 768 .Income from operations (EBIT) after cost of capital (930) 182 .Assets 9,242 5,769 60.2Research and development expenses 285 223 27.8Additions to property, plant and equipment and intangible assets 3,753 360 .Sales to third parties increased by €1,231 million to€9,356 million (volumes –10%, prices –4%, portfolio 28%,currencies 1%). Against a backdrop of a generally sharpdecline in demand, sales growth was due solely to theintegration of the Ciba businesses from April 2009onward. Income from operations was minus €150 milliondue to the impact of the crisis in nearly all our customerindustries and high charges incurred as a result of theCiba integration.We expect demand to recover and result in anincrease in sales in 2010. Earnings should improve considerablythanks to higher synergy effects from theacquisition and considerably lower integration costs.We aim to significantly outperform the cumulative resultsthat the now combined businesses achieved in 2008.Dispersions & PigmentsIn 2009, sales to third parties were €2,445 million, an increaseof €206 million compared with the previous year (volumes –11%,prices –4%, portfolio 22%, currencies 2%). Sales grew thanksto the inclusion of the Ciba businesses.Demand dropped as a result of the global economic crisis.The decline affected all business areas, but to varying degrees.Sales volumes for pigments were significantly lower as a resultof the slump in automotive production. For the dispersions unit,the construction sector downturn resulted in a decline in salesvolumes, in particular in Europe, as well as in North and SouthAmerica. However, over the course of the year volumes steadilyrecovered toward the level of the previous year. Sales of resinswere only slightly below the previous year’s level, supported bydemand from the printing and packaging industry. The businesswith coatings additives was also negatively affected by the economiccrisis. Margins in all business sectors could generally bemaintained and even slightly improved in some cases. However,Factors influencing sales Performance ProductsSales by divisionVolumes –10%Prices –4%Portfolio 28%Currencies 1%Sales 15%1 Dispersions & Pigments 26%2 Care Chemicals 37%3 Paper Chemicals 14%4 Performance Chemicals 23%34€9,356million12
<strong>BASF</strong> <strong>Report</strong> 2009The business year at <strong>BASF</strong> GroupManagement’s <strong>Analysis</strong><strong>BASF</strong>’s segments/Performance Products63weak demand and volatile raw materials prices led to increasingpressure on margins in the second half of the year.In 2009, we adjusted global production to meet decliningdemand and reduced our inventories. Lower capacity utilizationrates at our plants adversely affected income from operations.We minimized the negative impact of higher fixed costs with rigorousmanagement. Significant special items resulting from theCiba acquisition led to negative earnings.In the fourth quarter of 2009, we started up a new resinsplant in Wyandotte, Michigan.We expect the economic environment in 2010 to remainchallenging. Our key customer industries – automotive, constructionand packaging – are only slowly recovering from theglobal recession. Overall, we expect to grow somewhat fasterthan the market and to increase sales. Due to stable marginsand continued cost discipline, we expect clearly positive earnings.The rapid implementation of integration and restructuringmeasures associated with the Ciba acquisition will also contributeto a significant improvement in earnings.Dispersions & Pigments – Sales by region (location of customer)1 Europe 45%2 North America 26%3 Asia Pacific 22%4South America, Africa,Middle East 7%324€2,445million1Care ChemicalsThe Care Chemicals division posted sales to third partiesof €3,405 million, a decrease of €188 million compared withthe previous year (volumes –9%, prices –3%, portfolio 5%,currencies 2%). Portfolio measures included the integrationof Ciba businesses into the division, and the closure of theformulated vitamin-C manufacturing site in Wilmington, NorthCarolina, in 2009.Our business performance proved cyclically resilient in adifficult market environment. Despite lower sales volumes,prices largely remained stable and we were able to raise margins,in particular in the business sectors Detergents & Formulators,Aroma Chemicals and Personal Care Ingredients. Salesin the Nutrition business were below the very good levelseen in 2008 due in large part to the weak demand for vitamins,but exceeded our expectations due to stable margins andlower fixed costs. Demand in the Care Chemicals divisiondeclined overall, but began a steady recovery from the secondquarter on.Income from operations was negatively impacted by costsresulting from the integration of Ciba businesses. Furthermore,the impairment of intangible assets adversely affected earnings,which were below the previous year’s strong level. Thanksto the rapid integration of Ciba activities into existing <strong>BASF</strong>structures, we were already able to take advantage of synergiesfrom the combined portfolio for market development purposesin 2009.We strengthened cooperation with our strategically importantcustomers: We created a new global unit to bundle ourkey account business in the fields of cleaning, personal care,hygiene and cosmetics worldwide. This will lead to an evenstrong er focus on the market and our customers’ needs.We expect a demand-driven rise in sales and generally stablemargins in 2010, supported by economic recovery in our keycustomer industries. We expect considerably higher earnings.The incorporated Ciba businesses will make a contribution tothis improvement through greater synergies, lower integrationexpenses and higher sales in comparison with 2009.Dispersions & Pigments– Higher sales due to integration of Ciba businesses– Sharp decline in demand impacted all business areasand led to capacity adjustments– Earnings negative due to low capacity utilization andhigh special items– Outlook 2010: sales growth and significantly positiveearnings thanks to stable margins and continued costdisciplineCare Chemicals– Sales declined as a result of weak demand– With sales prices largely stable, margins increaseddespite lower sales volumes– Earnings were below the strong 2008 level partlydue to integration costs– Outlook 2010: higher sales and considerable improvementin earnings as a result of economic recovery
64Management’s <strong>Analysis</strong> <strong>BASF</strong> <strong>Report</strong> 2009The business year at <strong>BASF</strong> Group<strong>BASF</strong>’s segments/Performance ProductsCare Chemicals – Sales by region (location of customer)1 Europe 50%2 North America 25%3 Asia Pacific 15%4South America, Africa,Middle East 10%Paper ChemicalsThe Paper Chemicals division was established on April 1, 2009.It comprises <strong>BASF</strong>’s paper business, which previously belongedto the Acrylics & Dispersions division, and the newly acquiredCiba paper business.In 2009, we posted sales to third parties of €1,326 million,an increase of €296 million in comparison with the previousyear. This included a contribution of €479 million from theintegration of Ciba’s paper business. Therefore, the salesgrowth was exclusively due to the Ciba business included inthe division since April 2009 (volumes –11%, prices –7%, portfolio46%, currencies 1%).The business environment was difficult, particularly in thefirst half of the year. It was not until the second half that we sawa slow but continuous recovery – albeit from a low level – beginin the paper industry. This industry has for many years beencharacterized by structural problems such as overcapacity anddeclining demand. The effects of generally weaker demandcould be felt in all regional business units. In particular in Europeand North America, the economic crisis intensified the decliningtrend. In both regions we faced the challenge of having toadjust our capacities to the significantly lower demand. On theAsian market, our sales volumes decreased as a result of theeconomic crisis especially in the first half of 2009. In the secondhalf of 2009, we experienced rising demand again, in particularin China. After a weak start, the South American market recoveredslowly over the course of the year. Overall, we were ableto maintain margins despite declining prices.324€3,405million1Sales and sales volumes of kaolin minerals declined considerablydue to the ongoing difficult market situation in the paperindustry. The business was also negatively affected by highenergy and freight costs.To some extent, we were able to compensate for theexpenses resulting from the lower capacity utilization with strictcost management. Income from operations in the mergedpaper businesses was adversely affected by high integrationcosts and the creation of structures in the newly establisheddivision. In addition, there were significant special items in 2009due to impairment charges and restructuring measures. Overall,earnings were negative.In 2010 we expect the economic environment to remain difficultalong the entire value-adding chain in the paper industry.The pressure on our business will be further increased by ourcustomers’ overcapacities and their portfolio adjustments.Simultaneously, we anticipate rising raw materials prices whichwe will not be able to fully pass on to the market. Planned restructuringmeasures and the rapid integration of the Ciba operationswill contribute to improving sales and earnings in 2010.Paper Chemicals – Sales by region (location of customer)1 Europe 49%2 North America 21%3 Asia Pacific 23%4South America, Africa,Middle East 7%324€1,326million1Paper Chemicals– Growth in sales and volumes due exclusively to theintegration of Ciba businesses in the division– Difficult business environment in the first half of 2009;recovery from a low level in the second half– Earnings in the combined paper businesses werenegative due to integration costs, impairment chargesand restructuring measuresOutlook – 2010: improved sales and earnings thanksto restructuring and rapid integration of the Cibabusinesses
<strong>BASF</strong> <strong>Report</strong> 2009The business year at <strong>BASF</strong> GroupManagement’s <strong>Analysis</strong><strong>BASF</strong>’s segments/Performance Products65Performance ChemicalsSales to third parties in 2009 were €2,180 million, an increaseof €917 million compared with the previous year (volumes –11%,prices –4%, portfolio 87%, currencies 1%). Established <strong>BASF</strong>businesses contributed €1,080 million to sales, while the newlyconsolidated Ciba businesses contributed €1,100 million.As a result of the economic crisis, which affected all ofour customer industries, demand declined in all businesssectors compared with 2008. The acquired Ciba businesses– in particular plastic additives – were also negatively impactedby the difficult economic environment. However, demandrecovered continuously toward the end of the year. We improvedmargins despite strong price pressure. The integration proceededrapidly.In the leather and textile chemicals business, we were ableto counteract the downturn that had started at the end of 2008and to implement price increases. Thanks to the rapid implementationof restructuring measures, we were able to increasemargins and reduce fixed costs.Sales in the business with automotive and refinery chemicalswere lower than in the previous year, due both to lowervolumes as well as lower prices resulting from raw materialsbasedsales contracts. However, we were able to prevent marginerosion.In 2009, the division was negatively impacted by high costsresulting from the integration of the Ciba businesses. Incomefrom operations was therefore significantly below the previousyear’s level and was negative due to high special items.Despite uncertainty about macroeconomic developments, weexpect sales to increase significantly in 2010 compared with2009. Earnings should improve considerably as a result of lowerintegration costs, the realization of synergies from the acquisitionand expected higher sales. We will continue to counter pressureon margins by applying strict price and cost management.In 2010, we will continue to pursue measures previously introducedto improve efficiency along the entire value-adding chain.Furthermore, we are concentrating on optimizing the acquiredCiba businesses and further advancing the restructuring programfor the leather and textiles chemicals business. Overall,we expect earnings to be clearly positive.Performance Chemicals – Sales by region (location of customer)1 Europe 42%2 North America 20%3 Asia Pacific 26%4South America, Africa,Middle East 12%34€2,180million21Performance Chemicals– Growth in sales resulted from the integration of Cibabusinesses in the division– After a difficult start, demand recovered continuouslytoward the end of the year– Earnings significantly below the previous year’s leveland negative due to high integration costsOutlook – 2010: despite ongoing uncertainties aboutthe economic environment, we expect sales to growsignificantly; earnings to improve considerably duemainly to lower integration costs and the realization ofsynergies from the rapid integration of Ciba; positiveearnings contribution
66Management’s <strong>Analysis</strong> <strong>BASF</strong> <strong>Report</strong> 2009The business year at <strong>BASF</strong> Group<strong>BASF</strong>’s segments/Functional SolutionsFunctional SolutionsCustomer-specific products and system solutionsThe Functional Solutions segment consists of the Catalysts,Construction Chemicals and Coatings divisions.These divisions develop innovative, customer-specificproducts and system solutions, in particular for theautomotive and construction industries.Segment strategyOur portfolio is made up of innovative products and technologiesthat allow our customers to differentiate themselves fromtheir competitors. The success of the segment is based primarilyon specialties and system solutions developed in collaborationwith our customers. Our strategy focuses on the ongoingoptimization of our product portfolio and structures based onregionally differentiated market requirements as well as trendsin our customer industries. We aim to strengthen our leadingmarket position in Europe, to profitably expand our position onthe North American market and to extend our activities in thegrowth regions of Asia, South America, Eastern Europe and theMiddle East in a targeted manner.Our productsThe Catalysts division develops catalysts and adsorbents thathelp protect the air, produce fuels and efficiently manufacture anumber of chemicals and plastics. For example, we producecatalysts that transform pollutants in the exhaust flows of vehiclesinto harmless chemical compounds. With our CatalyzedSoot Filter, we offer our customers an integrated catalyticconverter for diesel vehicles. Furthermore, we produce processcatalysts which increase the raw material and energy efficiencyof chemical plants and refineries. Our Prox-SMZ catalyst, forexample, increases the yield of diesel fuel from crude oil by 1.5%.In addition, we offer precious and base metals services.The Construction Chemicals division is a global leader inthe development of concrete admixtures such as concrete plasticizers,deferrers and curing agents. These facilitate simple andefficient processing of concrete, and increase the stability anddurability of concrete structures. We also produce and marketconstruction systems that help to protect and repair concretestructures. For example, with our Emaco ® NanoCrete brand ofconcrete repair mortars, lasting and secure repairs can be madeon concrete structures such as bridges or high-rise buildings.Besides mortars, our construction systems portfolio also includestile adhesives, waterproofing and insulating systems aswell as sports and industrial flooring.The Coatings division is one of the world’s largest suppliersof innovative and environmentally friendly coatings solutionsfor automotive and industrial applications. Our brands Glasurit ®and R-M ® for the car refinish business make us successful inthe premium segment worldwide. In Brazil, we are the leadingmanufacturer of architectural coatings, with an excellent marketposition of our brand Suvinil ® .Glenium concrete additivesImproved concrete propertiesValue for <strong>BASF</strong>Annual average2.5 xhigher growth rate ofnewest high-performanceplasticizers compared tothe cement marketValue for the environmentUp to60%less CO 2emissionsthan conventional concretemixturesValue for <strong>BASF</strong> Our high-performance plasticizers,sold under the brand name Glenium, improve the propertiesof both liquid and solid concrete. Our customersbenefit not only from our expertise in this area, but alsofrom lower production costs. This is the basis of ourmarket success.Value for the environment With the help ofGlenium, manufacturers can produce concrete mixturesthat contain significantly less cement clinker, a materialwhich is manufactured in a highly carbon-intensiveprocess, yet are still as strong or even stronger thanconventional concrete.StrategyProducts– Focus on innovative products and technologies– Development of specialties and system solutionsin close collaboration with our customers– Continuous optimization of our product portfolioaccording to regional market requirements and trendsin the customer industries– Catalysts: Automotive and process catalysts aswell as adsorbents– Construction Chemicals: Concrete admixturesand construction systems for the building sector– Coatings: Coatings solutions for automotive andindustrial applications as well as architectural coatings
<strong>BASF</strong> <strong>Report</strong> 2009The business year at <strong>BASF</strong> GroupManagement’s <strong>Analysis</strong><strong>BASF</strong>’s segments/Functional Solutions67Capital ExpendituresLocation Project StartupDemarchi, Brazil Expansion Suvinil 2009Guangdong, China Construction admixtures and construction systems 2009Karachi, Pakistan Construction admixtures and construction systems 2009Kunming, China Construction concrete admixtures 2009Moscow-Krasnogorsk, Russia Construction vehicle catalysts 2009Münster, Germany Expansion water-based finishes 2009Poznań, Poland Construction of construction systems 2009Shanghai, China Expansion vehicle catalysts 2009Würzburg, Germany Expansion water-based finishes 2009Research and developmentThe Catalysts division’s research and development platform isunique in the industry. We continuously extend our technologicalleadership through process and product innovations. Ourfocus is on meeting ever-stricter exhaust gas standards andconsistently improving the efficiency of our catalysts. Our innovationsinclude our NanoSelect TM catalysts LF 100 and LF 200 –lead-free alternatives to the Lindlar catalyst, which has long beenwidely used in the fine chemical industry. As they contain verylittle precious metal, these catalysts also create significant costsavings for our customers.Construction Chemicals aligns its research activities withcustomers’ needs and construction industry trends. Sustainabilityas well as cost and resource efficiency are the focus ofthe division’s research. The latest example is our Crystal SpeedHardening concept. Thanks to the core product X-SEED ® 100,a unique hardening accelerator, concrete strength can be morethan doubled. This concept also increases energy efficiencywhile reducing processing costs. Other focus areas includepolymers, reactive resins, new formulations and tailor-madesystem solutions as well as mineralogy and nanotechnology.The Coatings division works closely with our customersfrom the automotive industry to develop new solutions forintegrated processes, eco-efficient coatings and highly scratchresistantclearcoats. Another research area is improvedcoatings products that can be used in fast-growing fields ofapplication such as wind turbines. Our innovations also in cludemore efficient corrosion protection technologies from theCathoGuard ® product range.Marketing and customer relationsOur customer portfolio ranges from major customers in theautomotive, construction and chemical industries to mediumsizedregional businesses to small local businesses, such as carrepair shops. Our business models and sales channels arealigned with the needs of the specific customer groups and marketsegments. We offer our major customers individual serviceand custom-tailored research and development activities andtechnical services. Our pricing policy is primarily based onthe value of our innovative products and technologies to ourcustomers.One example of our close collaboration with customers isour cooperation with Masdar: As a preferred partner and supplierof construction materials and system solutions, <strong>BASF</strong> willcontribute to the construction of Masdar City, the world’s firstcarbon-neutral city, in Abu Dhabi. We also maintain close contactwith our customers in our redesigned Refinish CompetenceCenter in Münster, Germany. At this center, we offer courses,for example, in the use of our automotive refinish products.Sales Functional Solutions(million €)Income from operations Functional Solutions(million €)2009 7,1152008 9,3882007 9,4912009 1072008 1512007 433
68Management’s <strong>Analysis</strong> <strong>BASF</strong> <strong>Report</strong> 2009The business year at <strong>BASF</strong> Group<strong>BASF</strong>’s segments/Functional SolutionsSegment data Functional Solutions (million €)2009 2008 Change in %Sales to third parties 7,115 9,388 (24.2)Thereof Catalysts 2,961 4,729 (37.4)Construction Chemicals 1,991 2,163 (8.0)Coatings 2,163 2,496 (13.3)Intersegmental transfers 147 147 –Sales including intersegmental transfers 7,262 9,535 (23.8)Income from operations before depreciation and amortization (EBITDA) 511 564 (9.4)EBITDA as a percentage of sales 7.2 6.0 –Income from operations (EBIT) before special items 209 265 (21.1)Income from operations (EBIT) 107 151 (29.1)Income from operations (EBIT) after cost of capital (644) (750) 14.1Assets 8,265 8,693 (4.9)Research and development expenses 163 186 (12.4)Additions to property, plant and equipment and intangible assets 174 234 (25.6)Sales to third parties decreased by 24% to €7,115 million(volumes –14%, prices –11%, portfolio 0%, currencies 1%).Income from operations also declined by €44 million to€107 million. This was mainly due to the dramatic drop indemand from the automotive industry.In 2010, we expect some improvement in the marketenvironment in the automotive and construction industriesand, as a result, we anticipate a slight increase insales. We aim to significantly increase income fromoperations.CatalystsThe dramatic drop in demand from our key customer industries– the automotive and chemical industries – had a negativeimpact on the division’s sales and earnings in 2009. Salesto third parties fell by €1,768 million to €2,961 million due tolower annual average precious metals prices and a decrease insales volumes (volumes –16%, prices –23%, portfolio 0%,currencies 2%).While we increased sales of refinery catalysts, sales volumes ofchemical catalysts and automotive catalysts were significantlylower than in the previous year. A higher volume of business inemerging markets, particularly in Asia Pacific, could not offsetthe sharp decline in North America and Europe. As a result ofsignificantly lower precious metals prices and reduced tradingvolumes, sales in our Precious and Base Metal Services unitdropped by 50% to €1,229 million.Despite a reduction in fixed costs, income from operationswas considerably lower than in 2008 due to the extraordinarilyweak market environment, especially during the first half of2009. Higher earnings in our refinery catalysts business couldnot compensate for lower results in other businesses.Factors influencing sales Functional SolutionsSales by divisionVolumes –14%Prices –11%Portfolio 0%Currencies 1%Sales –24%31 Catalysts 42%2 Construction Chemicals 28%3 Coatings 30%€7,115million12
<strong>BASF</strong> <strong>Report</strong> 2009The business year at <strong>BASF</strong> GroupManagement’s <strong>Analysis</strong><strong>BASF</strong>’s segments/Functional Solutions69For 2010, we expect a considerable increase in sales due tohigher precious metals prices and rising volumes, particularly inautomotive catalysts. Despite uncertainty about the impactof the end of government stimulus programs, we expect salesvolumes will increase due to positive effects from higher overallautomotive production worldwide compared to 2009 as well asnew emissions regulations coming into effect. We are alsooptimistic that we can profitably grow our process catalystsbusiness. Overall, earnings in 2010 are expected to be significantlyhigher than 2009, driven by higher sales and continuingefforts to optimize our cost base.Catalysts – Sales by region (location of customer)1 Europe 36%2 North America 39%3 Asia Pacific 14%4South America, Africa,Middle East 11%324€2,961million1Income from operations improved compared with the previousyear and returned to profitability. However, it was negativelyimpacted by special items resulting from our measures tostrengthen our competitiveness. We have adapted our businessmodels and organizations to market developments in all regions,reduced the complexity of our portfolio and increased the efficiencyof our processes throughout the entire supply chain. Asa result, we reduced fixed costs and improved our margins.We expect the following developments in our importantmarkets in 2010: Construction activity will continue to declinein the United States, Spain, France and the United Kingdom.At the same time, the construction sector should stabilize inGermany, Italy, Eastern Europe and Japan. In emerging marketsin Asia, in particular in China, the growth trend will continue. Wealso expect positive development in the construction sector inthe financially sound states in the Arabian Peninsula. For 2010,we aim for a slight increase in sales at Construction Chemicalsand a significant improvement in earnings.Construction Chemicals – Sales by region (location of customer)4Construction ChemicalsIn the Construction Chemicals division, sales to third partiesdecreased by 8% to €1,991 million due to lower volumes (volumes–10%, prices 1%, portfolio 0%, currencies 1%). This wasdue to the continuing weakness in the construction sector inmany of our important markets. We recorded the sharpestdecline in sales in the United States, Spain, the United Kingdom,Brazil and Japan. In contrast, we continued to grow in Chinaand the Arabian Peninsula.1 Europe 47%2 North America 22%3 Asia Pacific 18%4South America, Africa,Middle East 13%32€1,991million1CatalystsConstruction Chemicals– Considerable decline in sales due to lower preciousmetals prices and weaker volumes; sales increasein the business with refinery catalysts– Noticeable decline in earnings despite a reductionin fixed costs– Outlook 2010: higher sales due to a rise in preciousmetals prices and higher volumes; significant increasein earnings compared with 2009– Decline in sales due to weak construction sectoractivity in many important markets– Increase in earnings thanks to reduction in fixedcosts and higher margins– Measures to increase competitiveness successfullyimplemented– Outlook 2010: slight increase in sales and significantlyhigher earnings
70Management’s <strong>Analysis</strong> <strong>BASF</strong> <strong>Report</strong> 2009The business year at <strong>BASF</strong> Group<strong>BASF</strong>’s segments/Functional SolutionsCoatingsOur sales to third parties in 2009 were €2,163 million, a decreaseof €333 million compared with 2008 (volumes –14%, prices 1%,portfolio 0%, currencies 0%). The overall decline in demandaffected all product lines in Europe, North America and SouthAmerica. Lower sales resulted in particular from the deteriorationin the market environment for the automotive industry inEurope and North and South America as well as our divestituresin our industrial coatings activities in North America in 2008.The rapid recovery of the automotive industry in China ledto sales growth for automotive coatings in Asia. In contrast, asa result of the difficult business environment we posted a slightdecline in sales of automotive refinish coatings. Demand forcoatings for tractors and other agricultural machines weakeneddramatically.Sales of industrial coatings in North America declined dueto divestitures. Sales in Europe also decreased, attributablemainly to lower demand from the steel industry for coil coatings.Even the positive development with coatings for wind turbinescould not offset this decline. Sales in the architectural coatingsbusiness matched the previous year’s level; in South America,we were able to gain market share.Income from operations exceeded the previous year’s levelbecause we were able to reduce fixed costs through personneladjustments and strict cost discipline while margins remainedstable.Special items were lower overall than in 2008. They wererelated to restructuring projects in Europe and Asia: Here weresponded to changing market conditions by selling our productionsites in Ako, Japan, and Verbania, Italy. In addition tothese divestitures, we optimized internal processes and streamlinedour product portfolios.In 2010, we expect a slight recovery in the global automotiveindustry and consumer demand. This should more than offsetthe sales decline that has resulted from the divestment of ourproduction sites in Japan and Italy. We therefore expect thatsales will increase slightly compared with the 2009 level. Incomefrom operations is expected to improve significantly as a resultof the restructuring measures we have introduced. We willcontinue to expand our presence in the growth regions of Asiaand Eastern Europe, particularly in Russia, China and India.Coatings – Sales by region (location of customer)1 Europe 45%2 North America 14%3 Asia Pacific 17%4South America, Africa,Middle East 24%34€2,163million21Coatings– Decline in sales resulted in particular from worsenedmarket environment in the automotive industry in Europeand North and South America– Increase in earnings due to stable margins andreduced fixed costs– Sale of our production sites in Ako, Japan, and Verbania,Italy, in response to changing market conditions– Outlook 2010: sales growth and significant improvementin earnings; presence in Asia and Eastern Europeangrowth markets to be expanded further
<strong>BASF</strong> <strong>Report</strong> 2009The business year at <strong>BASF</strong> GroupManagement’s <strong>Analysis</strong><strong>BASF</strong>’s segments/Agricultural Solutions71Agricultural SolutionsInnovations for the health of cropsThe Agricultural Solutions segment consists of the CropProtection division. We develop and produce innovativeactive ingredients and formulations for the improvementof crop health and yields, and market them worldwide.<strong>BASF</strong> Plant Science conducts research in the field ofplant biotechnology.Crop ProtectionStrategyIn the Crop Protection division, we grow through innovation. Ourfocus is on the continuous development of new solutions to proactivelyaddress the needs of our customers. We concentrateon high value markets and applications and strategically optimizeour portfolio.Innovation is decisive for our success. That is why we continuouslyinvest in our active ingredients pipeline and developimproved formulations. Successful growth also means using thepotential of new business models and developing new marketsegments, through acquisitions when appropriate.Our productsOur products and services make us a reliable partner to farmers.Our products help improve crop health and yields. We alsooffer solutions for non-agricultural applications: for example,our product Termidor ® protects buildings from termites andour Interceptor ® mosquito nets are effective in combating thespread of malaria. We are an industry leader with our portfolioof fungicides, insecticides, herbicides and seed treatments.We develop new markets: One goal of our Plant Health marketsegment is to increase yields through improved plant health.Thanks to our products from the umbrella brand AgCelence ® ,plants are more resistant to stress factors such as heator drought. Farmers make higher profits thanks to greater yieldsecurity and improved harvests.The fungicidal active ingredient F 500 ® forms the core ofour Plant Health concept. It is also contained in our fungicideOpera ® , which is used, for example, in South America for soybeancultivation, an important agricultural product in that region.Opera has a leading position in this market. It helps effectivelycombat Asian soybean rust – a fungal disease that can lead toa loss of up to 80% of a harvest – and increase yields.Crop Protection pipelineMarket segmentsActive ingredients already launched on the marketF 500 (F), boscalid (F), dimoxystrobin (F)Crops, specialty cropsTitrosulfuron (H)CropsChlorfenapyr (I)Pest controlActive ingredients/projects being launched on the marketMetrafenone (F), orysastrobin (F)Crops, specialty cropsTopramezone (H), F 500 fungicide seed treatment (F)CropsMetaflumizone (I)Specialty cropsActive ingredients/projects in development2 fungicides Crops, specialty crops, seed treatment1 herbicide, 2 herbicide tolerance projects Crops1 insecticide Specialty cropsTotal(F): Fungicides (H): Herbicides (I): InsecticidesTotal peak sales potential€1,500 million€700 million€2,200 millionSales Agricultural Solutions(million €)Income from operations Agricultural Solutions(million €)2009 3,6462008 3,4092007 3,1372009 7692008 7052007 516
72Management’s <strong>Analysis</strong> <strong>BASF</strong> <strong>Report</strong> 2009The business year at <strong>BASF</strong> Group<strong>BASF</strong>’s segments/Agricultural SolutionsOur SeedSolutions business focuses on disease and insect controlas well as yield and quality advantages. Seed treatment isa business area with growth potential: Genetically modifiedcrops are playing an increasingly important role worldwide. Thisincreases the value of the seeds and farmers therefore have agreater incentive to effectively protect them from disease andpests. In the SeedSolutions business area, we transfer thestrengths of our plant health products to our seed treatments.We are currently introducing our products with the active ingredientF 500 – such as Stamina ® or Acronis ® – in the U.S. andLatin American markets. Worldwide, these are the first productsof <strong>BASF</strong>’s new generation of seed treatments that we arebringing to market.Research and developmentIn 2009, we increased our research and development expendituresto €355 million, around 10% as a percentage of sales. Wemake targeted investments to identify novel active ingredientsat an early stage and to quickly bring to market the results ofour research and development projects. Our pipeline currentlyhas a peak sales potential of €2,200 million. Of this, €700 millionrelates to future product innovations. A total of €1,500 millionrelates to active ingredients launched since 2002, withwhich we achieved approximately 70% of the expected salespotential in 2009.With boscalid, <strong>BASF</strong> has successfully launched the world’sfirst fungicide from the promising carboxamide active ingredientclass. Farmers have now applied boscalid to over 100 cropsin more than 70 countries and in more than 200 indications. Weonce again raised the sales potential of this active ingredientand now expect peak sales of over €300 million annually.Samruddhi business modelProductivity in soybean cultivationValue for <strong>BASF</strong>60%annual growth in businesswith plant protection productsfor soybeans from2006 to 2009Value for our customers30%more yield thanks toimproved know-howand optimized farmingmethodsValue for <strong>BASF</strong> The productivity of soybean cultivationin India is among the lowest in the world becausefarmers there have very little access to information aboutthe best farming methods. In our Samruddhi businessmodel, <strong>BASF</strong> agronomists advise Indian farmers. Notonly does this ensure our customers’ success – ourbusiness with plant protection products for soybeansin India also grew by an average 60% annually over thelast three years.Value for our customers We are helping morethan 100,000 farmers secure good harvests. And we havebeen successful: the farmers involved increased theiryields by around 30%.We are working on developing four new active ingredients andtwo herbicide tolerance projects. Our novel herbicide Kixor ® isparticularly promising. Kixor can be used against broadleaf anddifficult-to-control weeds, including those that have developedresistance to the herbicide glyphosate. After being approved onvarious Latin American markets, Kixor was granted approval byU.S. authorities in September 2009. We will further advance theintroduction of the Kixor product family in 2010. We aim toachieve peak sales of over €200 million annually with Kixor.Strategy and productsResearch and development– Leading position thanks to an innovative portfolio andcontinuous improvement of formulations– Our products: fungicides, insecticides, herbicidesand seed treatments as well as applications in thenon-agricultural sector– Plant Health market segment: increase yields throughimproved plant health2009: – research and development expendituresof €355 million, equivalent to 10% of salesPipeline with peak sales potential of– €2,200 millionSuccessful market launch of boscalid fungicide;–expected peak sales potential of €300 million annuallyApproval for Kixor herbicide in various Latin American–markets; approval received from U.S. authorities
<strong>BASF</strong> <strong>Report</strong> 2009The business year at <strong>BASF</strong> GroupManagement’s <strong>Analysis</strong><strong>BASF</strong>’s segments/Agricultural Solutions73Marketing and customer relationsInnovative, high-value products and services as well as stronglocal expertise are key to making our collaboration with customerssuccessful. We see major growth potential in China andIndia. We also want to support farmers in these countries withour wide-ranging expertise in agronomic practices and technologicalsolutions. For example, in the Samruddhi business model,<strong>BASF</strong> agronomists teach Indian farmers about the proper useof crop protection products and fertilizers in soybean cultivationin order to sustainably increase their productivity.InvestmentsIn 2009, we invested €183 million. A large part of this investmentwas directly related to the capacity expansion for our fungicideF 500. Furthermore, we started operations at a new productionsite for our Kixor herbicide in Hannibal, Missouri. To meet theongoing high demand for our innovative crop protection productsin the future, we will continue to invest in our productioncapacities. To do this, we plan an average investment volumeof €100 million to €150 million annually in the next few years.<strong>BASF</strong> Plant SciencePlant biotechnology at <strong>BASF</strong><strong>BASF</strong> Plant Science is an international research and technologyVerbund with eight sites in Europe and North America. Around700 employees are developing crops with clear advantages forfamers, consumers and the environment. Plant biotechnologyis used to give plants specific, desired characteristics. It supplementsconventional breeding methods, because it allows thegenes from other organisms – and therefore a much larger repertoireof genetic traits – to be used. Research expenditures for<strong>BASF</strong> Plant Science in 2009 amounted to around €150 millionfrom the corporate research budget.StrategyAs a partner to leading seed companies, <strong>BASF</strong> Plant Sciencedevelops traits, or genetic properties, such as drought and diseaseresistance or higher yields. We offer seed companiessolutions ranging from development to end product, dependingon the characteristics and the crop. Together with our partners,we bring the seeds to market. In addition to crops thatoffer farmers higher and more secure yields, we also developplants that are more nutritious or can be used as renewableraw materials.Plant biotechnology is an especially controversial topic inEurope. We take our social responsibility seriously: That is why,at an early stage, we enter into close dialogue with farmers, politiciansand consumers to explain the benefits of the processesused and our products.Research and developmentWe cooperate with a number of research institutes, universitiesand biotechnology companies worldwide in the discovery andcharacterization of traits.Together with Monsanto, we develop higher-yielding andstress-tolerant corn (maize), soybean, canola (oil-seed rape) andcotton plants. An approval process is currently underway in theUnited States for a corn variety that can withstand dry periodswithout adverse affects on yields. We expect this new varietywill be available for cultivation in North America from <strong>2012</strong>. Atthe end of 2009, we received the first approval for a geneticallyoptimized plant. In Brazil, we obtained approval for the cultivationof the herbicide-tolerant soybean we developed jointly withour Brazilian partner Embrapa. The market launch of the soybeanwill take place once our product has been approved forimport in markets such as China and the European Union. SinceAugust 2009, we have been collaborating on the geneticimprovement of sugar cane with Centro de Tecnologia Canavieira(CTC), Brazil’s largest sugarcane grower. We also enteredinto a similar cooperation for sugar beets with KWS Saat AG.Investments– Investments of €183 million in 2009– Investment flow largely directed to capacity expansionfor F 500 fungicide and production facilities for the newKixor herbicide– Annual investment volume of €100 million to €150 millionplanned in coming years<strong>BASF</strong> Plant Science– International research and technology Verbund with eightsites in Europe and North America– Around 700 employees develop, with the help of plantbiotechnology, plants with clear advantages for famers,consumers and the environment– In 2009, expenditures of around €150 million annually for<strong>BASF</strong> Plant Science from the corporate research budget– Obtained approval for the cultivation of a herbicidetolerantsoybean in Brazil
74Management’s <strong>Analysis</strong> <strong>BASF</strong> <strong>Report</strong> 2009The business year at <strong>BASF</strong> Group<strong>BASF</strong>’s segments/Agricultural SolutionsSegment data Agricultural Solutions 1 (million €)2009 2008 Change in %Sales to third parties 3,646 3,409 7.0Intersegmental transfers 33 28 17.9Sales including intersegmental transfers 3,679 3,437 7.0Income from operations before depreciation and amortization (EBITDA) 973 905 7.5EBITDA as a percentage of sales 26.7 26.5 –Income from operations (EBIT) before special items 776 706 9.9Income from operations (EBIT) 769 705 9.1Income from operations (EBIT) after cost of capital 329 264 24.6Assets 4,681 4,352 7.6Research and development expenses 355 325 9.2Additions to property, plant and equipment and intangible assets 183 196 (6.6)1Sales, earnings and all other data of <strong>BASF</strong> Plant Science are not included in the Agricultural Solutions segment but reported in “Other”.Sales to third parties rose by €237 million compared withthe previous year to €3,646 million. Income from operationsincreased to a record high of €769 million.We aim for sales growth in 2010 despite a difficultmarket environment. We aim to keep earnings at the highlevel of 2009.Crop ProtectionThe Crop Protection division once again increased sales andearnings in 2009. Sales to third parties were €3,646 million, anincrease of €237 million compared with the previous year’s verystrong level (volumes 0%, prices 5%, portfolio 1%, currencies1%). Thanks to strong demand from distributors, we experienceda good start to 2009. However, business slowed fromthe beginning of the second quarter as unfavorable weatherconditions in the northern hemisphere resulted in reduced useof crop protection products. Furthermore, lower prices foragricultural produce, in particular for corn (maize) and wheat,led to more cautious purchasing behavior by farmers. Distributorsalso acted cautiously because of their higher inventorylevels. Sales growth was mainly due to higher prices. Overallpositive currency effects and the businesses of Sorex andWhitmire acquired at the end of 2008 also contributed to theimprovement in sales.At €1,520 million, sales to customers in Europe nearlymatched the previous year’s level. Negative currency effects,particularly related to Eastern European currencies, adverselyimpacted sales. Use of crop protection products declined dueto a late start to the season following a long winter, as well aslow disease pressure for field crops. Lower sales volumes wereoffset by price increases for our innovative products. Our cautiouscredit management paid off in the Central and EasternEuropean growth markets.At €910 million, sales in North America were significantlyhigher than in 2008. This was due mainly to higher prices anda stronger U.S. dollar on average in 2009. In addition, theacquisition of the Sorex Group contributed to sales growth inour business with pest control products for non-agriculturalapplications. Due to adverse weather conditions and weakprices for corn, there was significantly lower demand for ourFactors influencing salesFactors influencing sales Agricultural SolutionsVolumes 0%Prices 5%Portfolio 1%Currencies 1%Sales 7%– Europe: sales nearly at previous year’s level dueto currency and weather effects– North America: higher sales due to higher prices anda stronger U.S. dollar– Asia: sales growth as a result of higher sales volumes– South America: sales above 2008 level, in particular dueto strong demand for fungicide Opera
<strong>BASF</strong> <strong>Report</strong> 2009The business year at <strong>BASF</strong> GroupManagement’s <strong>Analysis</strong><strong>BASF</strong>’s segments/Agricultural Solutions75plant health products (Headline ® ) compared with 2008. Overall,sales adjusted for currency and portfolio effects were at theprevious year’s level.In Asia, we increased sales to €378 million, primarily as aresult of higher sales volumes. Growth was particularly strongin China and India. For instance, we experienced high demandfor our soybean herbicide Pursuit ® in India.At €838 million, sales in South America were above theprevious year’s level. Favorable weather conditions at the endof the year led to increased disease pressure and resulted instrong demand for our fungicide Opera ® . The sugarcane marketin Brazil recovered thanks to the rise of sugar and ethanolprices toward the end of 2009. This had a positive effect on ourinsecticide business in this market segment, which had beenweak at the beginning of the year. Furthermore, we experiencedstrong demand for our soybean seed treatment productStandak ® .We increased income from operations by €64 million to€769 million despite the expansion of our sales and marketingactivities and higher spending on research and development.This increase in earnings was due to higher prices and positivecurrency effects. With an EBITDA margin of 26.7%, we haveonce again exceeded our target of 25%.Assets climbed by €329 million to €4,681 million, mainly asa result of the rise in inventories. Toward the end of 2008, weexperienced some inventory shortages as a result of strongdemand for our products. In order to improve our ability andflexibility to supply our customers, we increased our inventorylevels in 2009. In addition, demand for our crop protection productswas lower than anticipated in the second and third quartersof 2009. The level of receivables increased in line with salesgrowth. Our strict credit and risk management, particularly inthe Latin American and Eastern European growth markets, hasproven its worth. Payments are being received as planned.In 2010, we expect market conditions to be more difficult thanin 2009. We anticipate prices for agricultural products will continueto be characterized by high volatility. In addition, the futuredevelopment of important currencies will play a decisive role, asthe recent course of the U.S. dollar shows. Moreover, distributors’inventory levels influence the market. Despite this challenge,we aim to increase sales once again and to keep ourearnings at the high level of 2009.Crop Protection – Sales by region (location of customer)1 Europe 42%2 North America 25%3 Asia Pacific 10%4South America, Africa,Middle East 23%Crop Protection – Sales by indication1 Fungicides 47%2 Herbicides 32%3 Insecticides and other 21%3243€3,646million2€3,646million11Crop Protection– Sales growth due to higher prices and an overall positivecurrency effect; after a good start to the year, demandweakened continuously– Earnings improved despite the targeted expansion ofour sales and marketing and planned higher researchand development expenditures– At 26.7%, EBITDA margin again exceeded ourgoal of 25%– Outlook 2010: volatile prices expected for agriculturalproducts; market conditions anticipated to be moredifficult than in the previous year; nevertheless, we aimto increase sales and maintain high earnings level
76Management’s <strong>Analysis</strong> <strong>BASF</strong> <strong>Report</strong> 2009The business year at <strong>BASF</strong> Group<strong>BASF</strong>’s segments/Oil & GasOil & GasExploration and production of oil and natural gas;Trading, transport and storage of natural gas<strong>BASF</strong>’s oil and gas activities are bundled in the WintershallGroup. Wintershall and its subsidiaries operate in thebusiness sectors Exploration & Production and NaturalGas Trading.Segment strategyWe focus our exploration and production of crude oil and naturalgas on selected oil and gas-rich regions in Europe, NorthAfrica and the Middle East, South America as well as Russiaand the Caspian Sea region. We secure our lasting success bybroadening our technological expertise and investing in theexploration, development and production of hydrocarbons.The long-term growing demand for natural gas in WesternEurope coupled with the decline in regional production, meansthat in the future even greater amounts of natural gas will haveto be imported. This creates opportunities for our business sectors,which we utilize in our strategy “Gas for Europe.” We explorefor and produce natural gas in and around Europe and helpdevelop the infrastructure to deliver the gas to customers. Withour pipeline network and strategically positioned natural gasstorage facilities, we make an important contribution to securinggas supplies in Germany and Europe.We pursue our own research and development activities inselected technology areas. These focus on increasing the yieldfrom producing deposits as well as the development of technologiesfor reservoirs with difficult production conditions. By tappingsynergies with <strong>BASF</strong> Group’s research expertise, we areincreasingly able to establish ourselves as a partner with exceptionaltechnological expertise.We operate in environmentally sensitive areas. Therefore,before our activities start, we examine potential effects on theenvironment, such as on water and biodiversity. Together withexperts, our contractors and relevant stakeholders, we establishappropriate measures to minimize the impact on humansand the environment. In so doing, we are committed to theadherence to international conventions, local regulations andour own standards.Exploration & ProductionEurope: The Mittelplate oil field in the North Sea tidal flats is thecornerstone of our oil production in Germany. Wintershall andRWE-DEA each own a 50% stake in this field, the largest knownoil deposit in the country. In 2009, we acquired a 25% stake inthe Cuxhaven concession, which directly adjoins the Mittelplateoil field. Wintershall is one of the largest producers of natural gasin the southern sector of the North Sea, producing approximately1.6 billion cubic meters annually. We operate 26 offshoreplatforms in this region, of which 19 are centrally controlled byone of the most modern radio control systems in the world.This automation is an essential prerequisite for the continuedeconomic production of small and medium-sized deposits.Norway plays a central role in our “Gas for Europe” strategy.Thanks to Norway’s large oil and gas reserves and itsexisting pipeline to the Western European markets, the countryis – next to Russia – one of Europe’s most important suppliers.Following the acquisition of Revus Energy, Wintershall NorgeASA now holds more than 53 licenses in Norway and more than20 licenses in the United Kingdom that will soon add to crudeoil and natural gas production in Europe.Russia and the Caspian Sea region: The joint field developmentprojects with Gazprom in Western Siberia were successfullycontinued in 2009. The Yuzhno Russkoye natural gas fieldreached plateau production earlier than planned. We hold a 35%interest in the economic rewards of this field.Wintershall holds a stake of 50% in the development ofa section of the Achimov formation in the Urengoy field. Herewe have successfully started up all six production wells of thepilot phase and a gas treatment plant. In the Caspian Searegion, we are pursuing exploration projects in Turkmenistanand Azerbaijan.Oil & Gas segmentExploration & Production– Two business sectors: Exploration & Production andNatural Gas Trading, bundled in the Wintershall Group– Success is driven by investments in exploration andproduction and expansion of technological expertise– We make an important contribution to Europe’s supplysecurity with our “Gas for Europe” strategy– Strengthening our competitive position with our ownresearch and development activities– Cooperation with Gazprom in joint field developmentprojects in Siberia– Yuzhno Russkoye natural gas field reached plateauproduction earlier than planned– All pilot drill holes in operation in the Achimgaz project– Successful integration of Revus Energy
<strong>BASF</strong> <strong>Report</strong> 2009The business year at <strong>BASF</strong> GroupManagement’s <strong>Analysis</strong><strong>BASF</strong>’s segments/Oil & Gas77North Africa/Middle East: In Libya, we operate eight onshoreoil fields in the concessions 96 and 97 and exploit the associatedgas released during crude oil production in a gas treatmentplant to meet local demand. Gazprom is involved in theseprojects through its 49% stake in a German Wintershallsubsidiary.Negotiations, which began in early 2008, are still ongoingwith the Libyan state oil company on converting the existingconcession agreements into production sharing agreementsaccording to the EPSA-IV standard.We have continued our exploration activities in the blocksin the Kufra Basin in southern Libya, where we are the operatorand hold a 65% stake. In addition, we hold a stake in the Al Jurfoffshore oil field in Libya, which is operated by another company.The new EPSA-IV contract was signed there in 2009.In Mauritania, we operate two onshore exploration blocks.Seismic measurements were conducted in the exploration block4N in Qatar; the first exploration well is to follow in 2010. Theblock is located close to the North Field, the largest naturalgas field in the world. In Qatar, we also have stakes in blocks 3and 11; in Oman, we have a stake in block 51.South America: We have been active in the exploration for andproduction of oil and gas in Argentina for more than 30 yearsand we have a stake in 15 fields. In the Neuquén Basin we areadvancing the development of the tight gas deposit in the Central-Westfield of the Aguada Pichana concession by drilling productionswells. We are also conducting seismic measurementsin the Las Cárceles part of the field. In Chile, we hold a stake inthe Otway Block in the Magellan Basin near our existing facilitiesin Tierra del Fuego. Additional geological activities forexploration of this block are being carried out.WINGAS natural gas storage facilitiesMore energy supply security for EuropeValue for <strong>BASF</strong>3 rdlargest owner of storagefacilities in northwestEuropeValue for society40%more storage volume forsecure energy supplyValue for <strong>BASF</strong> <strong>BASF</strong> subsidiary WINGAS is continuingto strengthen its position as one of the leading providersof storage capacities in Europe with new natural gasstorage facilities in Austria, Germany and England.Value for society Natural gas storage facilities areextremely important for a secure supply of energy. Withthe realization of its new storage projects in Europe,WINGAS is increasing its storage volumes by more than40%, and therefore ensuring the availability of this environmentallyfriendly fuel.Natural Gas TradingThe WINGAS Group is a natural gas trading joint venture thatwe operate with Gazprom. We supply natural gas from varioussources to Germany and other European countries. The pipelinenetwork operated by WINGAS TRANSPORT connectsWestern European markets with an infrastructure that extendsto the gas fields of Siberia. Other important components of theportfolio include the largest natural gas storage facility in WesternEurope, in Rehden, Germany, and the natural gas storagefacility in Haidach, Austria.Natural Gas Trading Important developments in 2009– Expansion of natural gas infrastructure in Germanyand Europe in cooperation with Gazprom– Participation in the construction of the Nord Streampipeline running from Russia through the Baltic Seato the German coast– Market position in Germany strengthened; continuedgrowth in the rest of EuropeConstruction started on the onshore– OPAL pipeline(Ostsee-Pipeline-Anbindungs-Leitung – Baltic SeaPipeline Link), which has been largely exempted fromthe German regulations on network access and tariffsConstruction started on the Jemgum natural gas–storage facility
78Management’s <strong>Analysis</strong> <strong>BASF</strong> <strong>Report</strong> 2009The business year at <strong>BASF</strong> Group<strong>BASF</strong>’s segments/Oil & GasCapital expendituresLocation Project Total capacity StartupSiberia,RussiaAustriaAchimgaz, development of the Achimov formation in theUrengoy gas and condensate field 70,000,000 BOE 1,2 2015Expansion and startup of the Haidach natural gas storagefacility 2,400,000,000 m³ 2007/2011Germany Expansion of the compressor station Haiming 39,000,000 W 2007/2011Construction of the Nord Stream natural gas pipelinethrough the Baltic Sea 55,000,000,000 m 3 2011/<strong>2012</strong>Construction of the onshore pipeline links OPAL and NELto the Nord Stream natural gas pipeline around 55,000,000,000 m 3 2011/<strong>2012</strong>Expansion and startup of the Jemgum natural gasstorage facility 1,200,000,000 m 3 20131BOE = Barrel oil equivalent2Total capacity in the plateau phase after 2015The planned construction of the Nord Stream pipeline fromRussia through the Baltic Sea to the German coast and its associatedonshore projects for onward transport to the Europeannetwork will significantly strengthen Europe’s natural gas infrastructure.With this additional supply route of natural gas toEurope, the Nord Stream project will decrease transit risk andimprove supply security in the long term. Partners in this project –the shareholders in Nord Stream AG – are: Gazprom (51%), E.ONRuhrgas (20%), Wintershall (20%) and N.V. Nederlandse Gasunie(9%). Nord Stream AG, which is included in the <strong>BASF</strong> Group ConsolidatedFinancial Statements using the equity method, pressedahead with preparations for the construction of the pipeline in2009, and has now successfully completed the required approvalprocess in all the affected countries bordering the project –Denmark, Sweden, Russia, Germany and Finland. Constructionis expected to begin in the first half of 2010.As a natural gas transit pipeline, the onshore OPAL pipeline(Ostsee-Pipeline-Anbindungs-Leitung – Baltic Sea PipelineLink) has been largely exempted from the German regulationson network access and tariffs for a period of 22 years from thestart of operations. This enables tariffs to be set according tothe market and makes transit capacity exclusively available fortransport customers. Construction on this pipeline, which shouldstart operating in 2011, has begun in the German states ofSaxony and Mecklenburg-Western Pomerania. The approvalprocess has begun for the NEL pipeline (Norddeutsche Erdgas-Leitung – Northern German Gas Link). It should begin operations,together with the second leg of the Nord-Stream pipeline,in <strong>2012</strong>.Our growth strategy is supplemented by the constructionof additional storage capacity. While the natural gas storagefacility in Saltfleetby, U.K., is still in the approval phase, we havestarted construction on the facility in Jemgum, Germany. Thesecond expansion phase of the storage facility in Haidach,Austria, is already underway.Following a decision by the German Federal NetworkAgency in September 2008, WINGAS TRANSPORT and all otherGerman operators of long-distance gas transportation networksare no longer allowed to set their natural gas transport tariffs ina competition-oriented manner. WINGAS TRANSPORT nowbills its customers according to the cost-based reduced transporttariffs set by the German Federal Network Agency.Sales Oil & Gas(million €)Income from operations Oil & Gas(million €)2009 11,3562008 14,4452007 10,5172009 2,2892008 3,8442007 3,031
<strong>BASF</strong> <strong>Report</strong> 2009The business year at <strong>BASF</strong> GroupManagement’s <strong>Analysis</strong><strong>BASF</strong>’s segments/Oil & Gas79Segment data Oil & Gas 1 (million €)2009 2008 Change in %Sales to third parties 11,356 14,445 (21.4)Thereof Exploration & Production 3,847 5,308 (27.5)Natural Gas Trading 7,509 9,137 (17.8)Intersegmental transfers 702 1,235 (43.2)Sales including intersegmental transfers 12,058 15,680 (23.1)Income from operations before depreciation and amortization (EBITDA) 2,830 4,409 (35.8)Thereof Exploration & Production 2,188 3,744 (41.6)Natural Gas Trading 642 665 (3.5)EBITDA as a percentage of sales 24.9 30.5 –Income from operations (EBIT) before special items 2,289 3,844 (40.5)Thereof Exploration & Production 1,781 3,319 (46.3)Natural Gas Trading 508 525 (3.2)Income from operations (EBIT) 2,289 3,844 (40.5)Thereof Exploration & Production 1,781 3,319 (46.3)Natural Gas Trading 508 525 (3.2)Income from operations (EBIT) after cost of capital 2 695 1,271 (45.3)Assets 8,301 8,356 (0.7)Thereof Exploration & Production 4,997 4,740 5.4Natural Gas Trading 3,304 3,616 (8.6)Exploration expenses 143 227 (37.0)Additions to property, plant and equipment and intangible assets 1,012 1,651 (38.7)Income taxes on oil-producing operations non-compensable with Germancorporate income tax870 1,851 (53.0)Net income 3 712 951 (25.1)1Supplementary Information concerning Oil and Gas Producing Activities from page 198 onward2In the Oil & Gas segment, non-compensable foreign income taxes for oil production are deducted.3Information on the net income of the Oil & Gas segment can be found in the reconciliation reporting Oil & Gas in the Notes to the Consolidated Financial Statementson page 159.Factors influencing sales Oil & GasSales by divisionVolumes –4%Prices –17%Portfolio 1%Currencies –1%Sales –21%1 Exploration & Production 34%2 Natural Gas Trading 66%2€11,356million1
80Management’s <strong>Analysis</strong> <strong>BASF</strong> <strong>Report</strong> 2009The business year at <strong>BASF</strong> Group<strong>BASF</strong>’s segments/Oil & GasIn 2009, sales to third parties decreased by €3,089 millionto €11,356 million (volumes –4%, prices/currencies–18%, portfolio 1%). Income from operations fell by€1,555 million to €2,289 million. Net income declined by€239 million to €712 million.As a result of the development of the world economy,we expect the oil price in 2010 to stabilize at a high levelin comparison with the average price in 2009. We havebased our planning on an oil price of $75 per barrel andan average euro/dollar exchange rate of $1.40 per euroin 2010. We expect earnings to increase while salesremain nearly unchanged.For more on the segment’s net income, see Notes to theConsolidated Financial Statements on page 159Exploration & ProductionSales to third parties declined by €1,461 million to €3,847 million.The average price of Brent crude in 2009 was $62 per barrel,a drop of around $36 per barrel compared with the previousyear. With the recovery of the U.S. dollar against the euro,the price in euro declined by only €22 per barrel to €44 per barrel.Crude oil and natural gas production rose overall by 4% to136 million barrels of oil equivalent (BOE). This figure includesminority interests from Gazprom’s stake in a German Wintershallsubsidiary that holds the Libyan concessions 96 and 97.Volumes from the Achimgaz project are not included due tocontractual and legal stipulations.Income from operations declined by €1,538 million to €1,781 million,mainly as a result of lower prices. In the natural gas activities,this decrease was mitigated by the time-lag effect (thedelayed adjustment of sales prices to the development in oilprices) in the first half of 2009. Earnings include income taxeson oil production in North Africa of €870 million that are noncompensablewith German corporate income tax (2008:€1,851 million). These taxes are reported as income taxes.In 2009, 29 exploration and appraisal wells were drilled inthe search for new oil and natural gas deposits, of which 17 weresuccessful. We acquired additional stakes in exploration licensesin Norway. Exploration expenses declined significantly to€143 million. This is mainly due to the fact that more explorationwells were successful in 2009 than in the previous year.Proven crude oil and natural gas reserves decreased by 1%to 1,136 million BOE compared with the end of 2008. Thereserve-to-production ratio of these reserves is 10 years (2008:11 years). This is based on Wintershall’s share of production in2009 and refers to the reserves at year end. We replenished89% of the volumes drilled in 2009. These figures do not includethe volumes from the Achimgaz project.The Yuzhno Russkoye natural gas field reached the projectedplateau production level earlier than planned with all 142production wells in operation. Wintershall holds a 35% share inthe economic rewards of this field through its share in Severneftegazprom.In the Achimgaz joint venture, we started up allproduction wells of the pilot phase.In 2010, we expect earnings in the Exploration & Productionbusiness sector will improve while sales stay generallyunchanged. The anticipated growth in earnings is based onhigher prices in crude oil production. The earnings contributionfrom natural gas production in Russia, Germany and theNetherlands will be lower because the positive time-lag effectseen in the first half of 2009 will not be repeated in 2010.Oil & Gas segment– Significant decline in sales due to lower prices; earningsbelow previous year’s level– Oil price expected to stabilize in 2010 at a higher levelthan in 2009; our planning is based on the followingannual average assumptions: oil price of $75 per barrel;euro/dollar exchange rate of $1.40 per euro– All construction permits for the Nord Stream pipelinehave been granted– Construction started on the OPAL pipeline(Baltic Sea Pipeline Link)– Outlook 2010: improved earnings and nearlyunchanged sales
<strong>BASF</strong> <strong>Report</strong> 2009The business year at <strong>BASF</strong> GroupManagement’s <strong>Analysis</strong><strong>BASF</strong>’s segments/Oil & Gas81Natural Gas TradingSales to third parties declined by €1,628 million to €7,509 million,due mainly to lower prices. Sales volumes declined to388 billion kilowatt hours, or by 7% compared with the previousyear, as a result of the unfavorable economic climate. Thisdecline was almost equally attributable to markets in Germanyand abroad – particularly in Romania. WINGAS supplied around10% of the natural gas volumes to <strong>BASF</strong> Group companies.At €508 million, income from operations was €17 millionless than in the previous year. Since sales prices for natural gascontractually follow those of oil prices with a time lag of severalmonths, we were still benefitting in the first half of 2009 from thehigh oil prices seen in mid-2008. This largely compensated forthe significant price decline on the spot markets in the secondhalf of the year as well as volume-related decreases.A key part of our growth strategy in the natural gas businessis our stake in Nord Stream AG. This company is constructinga pipeline from Russia through the Baltic Sea to the Germancoast. All of the countries bordering the project – Denmark,Sweden, Russia, Germany and Finland – have now grantedconstruction permits. We expect construction to begin inthe first half of 2010. Preparations for laying the pipeline havealready begun.In connection with the Nord Stream project, work began in Germanyon the Jemgum natural gas storage facility and the onshoreOPAL pipeline (Baltic Sea Pipeline Link). Planning activities forthe NEL pipeline (Northern German Gas Link) are continuing.In 2010, we expect volumes in Natural Gas Trading willstabilize at the high level of 2009 despite the ongoing tougheconomic situation and increasingly intense competition.As positive time-lag effects seen in the first half of 2009 will notbe repeated, we expect sales and earnings in 2010 will be slightlybelow the level of the previous year.Oil & Gas – Sales by region (location of customer)1 Europe 93%2 North America 3%3 Asia Pacific 1%4South America, Africa,Middle East 3%2 3 4€11,356million1Exploration & Production– Price-related decline in sales: oil price in U.S. dollarsignificantly below previous year’s level– Production expanded by 4% to 136 million BOE– Earnings below previous year’s level due to lower prices– Outlook 2010: price-related earnings improvement withnearly unchanged salesNatural Gas Trading– Sales significantly lower than in previous year dueto lower prices– Decline in volumes due to unfavorable economicdevelopments– Earnings slightly below the previous year’s high level– Outlook 2010: slight decline in sales and earnings
82Management’s <strong>Analysis</strong> <strong>BASF</strong> <strong>Report</strong> 2009The business year at <strong>BASF</strong> GroupRegional resultsRegional resultsRegions (million €)Salesby location of companySalesby location of customerIncome from operations(EBIT)2009 2008Changein % 2009 2008Changein % 2009 2008Changein %Europe 30,375 38,652 (21) 28,532 36,693 (22) 2,390 5,822 (59)Thereof Germany 21,543 27,497 (22) 10,666 13,796 (23) 1,855 4,744 (61)North America 9,320 11,937 (22) 9,423 11,932 (21) 495 73 .Asia Pacific 7,997 8,664 (8) 8,706 9,320 (7) 503 254 98South America, Africa, Middle East 3,001 3,051 (2) 4,032 4,359 (8) 289 314 (8)50,693 62,304 (19) 50,693 62,304 (19) 3,677 6,463 (43)EuropeSales by companies in Europe declined as a result of the economiccrisis by 21% to €30,375 million in 2009. In the first halfof the year in particular, European economies were in recession.Although this downward trend slowed slightly in the second halfof the year, 2009 was characterized by an economic decline ofhistoric proportions.All divisions in the Chemicals and Plastics segmentsrecorded dramatically lower sales as a result of a fall in volumesand prices. Thanks to the Ciba integration, sales in our PerformanceProducts segment increased. Sales in Functional Solutionsdecreased substantially, in particular as a result of the dropin demand from the automotive and construction industries inmuch of Europe. Businesses in Eastern Europe were alsounable to escape the decline in demand. The slightly lower volumesin the Agricultural Solutions segment were offset by higherprices. As a result of lower prices and volumes, sales in the Oil &Gas segment were significantly lower than in 2008.Income from operations was €2,390 million, a decrease of59% compared with 2008. This was primarily due to the lowercontribution of the Oil & Gas segment.In Europe, as in the other regions, we are fully integrating Ciba’sformer service and business activities into the existing <strong>BASF</strong>structures. In addition, we have concentrated our researchactivities in Basel, Switzerland, and Ludwigshafen. In recognitionof the increased significance of the “Basel Area” and Switzerlandin general, we have established our Paper Chemicalsdivision in Basel. Bringing together <strong>BASF</strong>’s activities in the bordertriangle (the zone where France, Switzerland and Germanymeet) makes innovative cross-border Verbund concepts possibleand creates additional potential for optimization, such as inproduction and maintenance services.Based on the motto “We create more value,” our excellenceprogram NEXT comprises projects and individual measures thataim to further increase productivity and efficiency in all functionsand divisions. In Europe, this also includes further developmentof the administrative service structures in the areas of corporatecommunications, environment, health and safety, building servicesmanagement, and procurement, with the aim of ensuringthat these services remain competitive in the long term.Sales by region (location of company)Income from operations by region551 Germany 43%2 Europe (excl. Germany) 17%3 North America 18%4 Asia Pacific 16%41 Germany 50%2 Europe (excl. Germany) 15%3 North America 13%4 Asia Pacific 14%45South America, Africa,Middle East 6%3€50,693million215South America, Africa,Middle East 8%32€3,677million1
<strong>BASF</strong> <strong>Report</strong> 2009Management’s <strong>Analysis</strong>The business year at <strong>BASF</strong> Group Regional results83North AmericaSales by companies in North America declined by 22% to€9,320 million, or by 25% in local-currency terms.After a further intensification of the recession at the beginningof 2009, the economy stabilized at a low level from themiddle of the year. As a result of the economic downturn, salesvolumes were significantly lower in almost all segments. In theChemicals, Plastics and Functional Solutions segments in particular,lower prices intensified the decline in sales. In the PerformanceProducts segment, on the other hand, the integrationof the businesses acquired from Ciba led to an increase in sales.In the Agricultural Solutions segment, sales rose compared withthe previous year due to higher prices for our innovative cropprotection products.At €495 million, income from operations in 2009 was€422 million higher than in the previous year. Our successfulcost management and consistent implementation of our “valueover volume” pricing strategy contributed to this. In addition,improved margins in some businesses more than offset thedecline in sales volumes. There was a clear increase in earningsin particular in the Chemicals and Plastics segments as well asin the Styrenics business. The Agricultural Solutions segmentperformed strongly, once again surpassing the high level of earningsachieved in the previous year. Only Performance Productsand Functional Solutions did not reach the level of earningsposted in 2008. This was primarily due to the extremely difficultbusiness environment in the automotive and constructionindustries.Within the framework of the NEXT excellence program, wecontinued to harmonize our business processes in 2009. Thestandardization of our IT systems, which we are continuing topursue in this region, also contributes to this. In addition, in 2009we simplified our structures by merging <strong>BASF</strong> companies withinNorth America.In the course of restructuring the Coatings division in NorthAmerica, our site in Belvidere, New Jersey, was closed.Our long-established service platform in North America facilitatedthe rapid and smooth integration of Ciba’s service functionswithin the region. The bundling of our business activitiesis also proceeding rapidly. For example, all the former Ciba administrativesites in North America have already been closed.We have also closed 27 smaller sales locations or merged themwith our larger sales centers, which allows us to supply our customerseven more reliably and save costs. With the former Cibasite in Tarrytown, New York, where we have combined varioustechnology activities, <strong>BASF</strong> now has a fourth research center inNorth America in addition to the existing ones in Wyandotte,Michigan; Iselin, New Jersey; and Research Triangle Park, NorthCarolina.Asia PacificIn 2009, <strong>BASF</strong> laid out its ambitious Strategy 2020 for AsiaPacific. The main aim is to grow on average two percentagepoints faster than the Asia Pacific chemical market each year.With expected market growth of 4% to 5% per year, this means<strong>BASF</strong> aims to double regional sales by 2020 while earning a premiumon cost of capital for the region.Sales in the Asia Pacific region decreased by €667 millionto €7,997 million in 2009, which represents a decline of 11% inlocal-currency terms. Sales grew in the Agricultural Solutionssegment as well as in the Performance Products segment,where the integration of Ciba businesses contributed to theincrease. Sales declined, however, in the Chemicals, Plasticsand Functional Solutions segments.At €503 million, income from operations was €249 millionhigher than in the previous year. Thanks to our cost-cuttingmeasures and strong demand in the second half of the year,earnings improved in the Chemicals and Functional Solutionssegments. The Plastics segment did not match the very goodlevel of 2008.Regional trends– Europe: further bundling of our business and service activities following the Ciba integration;concentration of research activities in Basel and Ludwigshafen– North America: rapid integration of Ciba’s service functions thanks to our established service platform;Tarrytown, New York, is the fourth research center in the region– Asia Pacific: Asia Pacific Strategy 2020 aims for growth of two percentage points above the chemical marketin the region; reorganization of our business in Japan– South America, Africa, Middle East: first approval for a genetically optimized plant receivedat the end of 2009 in Brazil; cultivation of herbicide-tolerant soybean approved
84Management’s <strong>Analysis</strong> <strong>BASF</strong> <strong>Report</strong> 2009The business year at <strong>BASF</strong> GroupRegional resultsWe continued our proactive capacity management in 2009 andreorganized our business in Japan, where we optimized themanagement structure, consolidated the concrete admixturebusiness and sold a coatings site. We also divested a catalystsproduction site in China and a styrene monomer plant in SouthKorea. At the same time, we added new capacities in growthareas such as construction systems in China, admixture systemsin India, motorcycle coatings in Thailand and engineeringplastics in Malaysia and China.Asia Pacific continues to make strong contributions toNEXT, the global efficiency project. Efficiency improvementsunder the Asia Pacific Site Optimization Project are expected tosave at least €100 million annually by <strong>2012</strong>.We plan to invest €2 billion in the Asia Pacific region between2009 and 2013 to reach our goal of generating 70% of salesfrom local production. China will continue to be central to <strong>BASF</strong>’sgrowth in Asia Pacific. <strong>BASF</strong> broke ground in September on theexpansion of the Verbund site in Nanjing, including the expansionof the steam cracker and four existing plants, along withthe construction of ten new plants. In Chongqing, China, we areplanning to construct a plant for MDI, a precursor for polyurethanes,which should produce 400,000 metric tons per year.Despite the economic crisis, we did not reduce our commitmentto research and development in 2009. We did not lowerour investments in important research sites, such as our Singaporenanotechnology lab. We opened a lab for PolyTHF ® in Chinaand strengthened our research and development activities inIndia, which included the start-up of a lab for pharmaceuticalapplications.South America, Africa, Middle EastSales by companies in the region amounted to €3,001 million,a decrease of 2% compared with 2008 as volumes declineddue to the global economic crisis. In local-currency terms, salesdeclined by 1%.In particular, sales growth in the Agricultural Solutions segmentand the Care Chemicals division helped stabilize the businessin South America. Sales volumes in the architectural coatingsbusiness remained steady.In Africa and the Middle East, sales in 2009 were significantlylower than in 2008. Thanks to the integration of theCiba businesses, sales volumes rose in the PerformanceProducts segment. The Agricultural Solutions segment andConstruction Chemicals division also increased sales. However,the Catalysts division, in particular, experienced substantiallyreduced demand as a result of the crisis in the automotive andchemical industries.At €289 million, income from operations was €25 millionlower than in the previous year. Higher earnings in the Styrenicsbusiness and the Construction Chemicals division were notsufficient to offset declines in other areas.In Brazil, we received the first approval for a geneticallyoptimized plant at the end of 2009. The cultivation of ourherbicide-tolerant soybean, developed jointly by <strong>BASF</strong> and ourBrazilian partner Embrapa, was approved.Increasing income among the South American populationis generating new potential for our products in strong growthindustries such as construction, cosmetics and hygiene. Crossdivisionalinitiatives have been developed to focus on theseindustries and take advantage of opportunities for profitablegrowth.Assets by region (share in %)Property, plant and equipment Inventories Accounts receivable, trade2009 2008 2009 2008 2009 2008Europe 60 58 56 57 56 63North America 21 21 25 24 16 15Asia Pacific 15 17 13 12 19 15South America, Africa, Middle East 4 4 6 7 9 7100 100 100 100 100 100
<strong>BASF</strong> <strong>Report</strong> 2009Management’s <strong>Analysis</strong>Employees and society Employees85EmployeesOur employees are key to our success: their skills, commitmentand motivation make <strong>BASF</strong> competitive and fitfor the future. For this reason, we want to recruit, supportand retain the best employees. We do this, forexample, with performance-based remuneration, targetedfurther training opportunities and measures to balancework and family life. We place emphasis on diversityin our teams to reflect the various backgrounds andmeet the needs of our business partners.Challenges in 2009Company management, employee representatives and employeesworked together in a spirit of partnership to cope with theeconomic crisis in 2009. We were able to limit the impact of thecrisis on our core workforce as much as possible. We limitedshort-time working in Europe by using a variety of measuressuch as temporary personnel transfers. In addition, by makinguse of our flexible personnel systems for working time and variableremuneration as well as keeping strict cost discipline, wewere able to achieve two core goals: extensive job security andcost reduction. Nevertheless, we were unfortunately unable tocompletely avoid staff downsizing in 2009. Our employeesworldwide had access to information about the company’s currentsituation and the steps necessary as part of our crisis management.Despite the difficult environment, <strong>BASF</strong> invested inlong-term issues such as demographic change and further training.Moreover, the integration of Ciba proceeded more quicklythan planned. For more information, see page 117Employees worldwideAt the end of 2009, <strong>BASF</strong> had 104,779 employees, of whom2,401 were apprentices and trainees. In addition, more than19,500 employees from other companies were contracted toprovide technical and other services at our sites. Worldwide, thepercentage of employees who left the company during their firstthree years of employment was on average 1.1%. This turnoverrate varies from region to region.Overview 2009Number of employees by region (as of December 31, 2009)2009%2009%2008Europe 67,621 64.5 63.9Thereof Germany 48,586 46.4 48.9Thereof <strong>BASF</strong> SE 32,870 31.4 33.9North America 15,945 15.2 15.6Asia Pacific 14,817 14.2 14.2South America, Africa, Middle East 6,396 6.1 6.3104,779 100.0 100.0Personnel costs and social benefitsIn 2009, the <strong>BASF</strong> Group spent €7,107 million on wages andsalaries, social security contributions, pension contributions andassistance (2008: €6,364 million). Personnel costs rose by11.7%, in particular due to the acquisition of Ciba. At <strong>BASF</strong>,attractive compensation for our employees comprises remunerationwith fixed and variable components as well as social benefitsthat go beyond the basic obligations. These benefits includea company pension plan, supplementary health insurance andshare programs.<strong>BASF</strong> Group personnel costs 2009 (million €)Change2009 in %Wages and salaries 5,942 15.2Social security contributions and expensesfor pensions and assistance 1,165 -3.4Thereof for pension benefits 178 -42.6Personnel costs 7,107 11.7Employees’ ideas create valueOur employees around the world make an important contributionto value with their suggestions for improvements. In 2009, onef ocus was on ideas relating to energy and material efficiency.Around 54,500 suggestions for improvements were submittedduring the year. In 2009, we implemented approximately32,700 suggestions, leading to an overall benefit of about€41.5 million.– 104,779 employees worldwide– Coping with the economic crisis with a clear focus onsecuring jobs and reducing costs– Short-time work limited in Europe through temporarypersonnel transfers– €7,107 million in personnel costs– Investments in long-term issues such as demographicchange and further training despite the economic crisis<strong>BASF</strong> Group employee structure 2009(2008 in parentheses)WomenMenTotal number of employees 22.5% (21.9%) 77.5% (78.1%)Management and professionals 24.1% (23.2%) 75.9% (76.8%)Senior executives 6.5% (5.7%) 93.5% (94.3%)
86Management’s <strong>Analysis</strong> <strong>BASF</strong> <strong>Report</strong> 2009Employees and societyEmployeesDemographic changeAround the world, particularly in Europe and the United States,demographic change poses major challenges to humanresource management. To keep <strong>BASF</strong> innovative and ahead ofthe competition in this environment, we launched the“Generations@Work” program in 2006. We analyze the agestructure of our workforces worldwide and demographic developmentsin our host communities to determine site-specificrisks. In Europe and the United States, we have implementedinitial concepts to address demographic change. Health managementand further training measures help employees to maintaintheir performance. At the same time, we want to adjustworking conditions accordingly. In a pilot project in 2009, <strong>BASF</strong>offered all employees in the Petrochemicals division at the Ludwigshafensite a preventive program including a free healthcheck-up for early detection of diseases and risk factors – 85%of the employees took part in the screening. With Generations@Work,we are also well positioned to implement the Germanchemical industry’s collective agreement on working lifeand demography. Starting in 2010, the companies in the chemicalindustry in Germany will contribute €300 per non-exemptemployee into a company “demography fund” each year. <strong>BASF</strong>SE and the works council have in this regard agreed on a personallong-term account for every non-exempt employee. Thiscan be used as a means to take a leave of absence near thelegal age of retirement.In dialogue with stakeholders, we take a leading role in theLaboratory for Demographic Change of the CSR Alliance, analliance between politics and business initiated by the EuropeanCommission. Together with its partners, <strong>BASF</strong> has developeda demographic atlas which evaluates the risks for more than260 European regions.For more information, see basf.com/demographic_changeCompetition for talentDemographic change also increases the competition for thebest specialists and managers. A key topic in our initiative todevelop our global employer brand is the variety of chal lengesand professional development opportunities available at<strong>BASF</strong> – features that allow <strong>BASF</strong> to stand out positively fromother employers. We have reviewed the effectiveness of ourworldwide recruitment measures in the context of changingemployment markets. To continue improving our attractivenessas an employer, we have, for example, developed a unifiedapproach to recruitment for the whole of Europe for the first time.This will fully come into effect in 2011. We rely on cooperationwith universities and colleges to find the most talented people.In China, for example, more than 1,300 students took part in<strong>BASF</strong> industry seminars during 2009.<strong>BASF</strong> Group employee age structure 2009(proportion of employees)Up to and including 25 years 6.7%Between 26 and 39 years 34.1%Between 40 and 54 years 48.2%55 years and older 11.0%Feedback from our employeesIn our first global employee survey in 2008, we asked employeesworldwide standardized questions on topics relating to theworkplace; 66% of our employees answered questions on topicssuch as leadership and the culture of innovation. In our followupprocess on the basis of the results, we introduced more than1,500 individual measures worldwide aimed at improving theworking environment. A number of activities aim to optimize personneldevelopment and reduce workload – areas in which ouremployees pointed out a need for improvement. In the followupsurvey to be conducted from the beginning of 2010, ouremployees will be given the chance to evaluate the selectionand implementation of the measures. The results of theemployee surveys are also an indicator of the success of ourintegration activities. Using a method known as pulse surveys,we asked several thousand employees affected by the Cibaintegration about the progress of the merger. The results of thesesurveys help the integration teams to implement any necessaryMastering demographic change– Pilot projects in Europe and the United States– Health management and further training measures– Active engagement with external partners in theEuropean Alliance for CSRFor more on the European Alliance for CSR, seewww.demographicchange.infoCompetition for the best employees– <strong>BASF</strong> as a globally developed employer brand– Global assessment of the effectiveness of recruitmentmeasures– New recruitment approach for Europe from 2011 onward– Cooperate with universities and colleges worldwide– Diverse challenges and professional developmentopportunities
<strong>BASF</strong> <strong>Report</strong> 2009Management’s <strong>Analysis</strong>Employees and society Employees87measures quickly. Our employees regularly provide feedbackfor their managers via anonymous online questionnaires. Inworkshops, they work together to develop goals and ways toimprove cooperation. More than 80% of managers had takenpart in this global leadership feedback as of March 31, 2009.Balancing career and familyIn the competition for the best employees, we are respondingworldwide to changing life situations. To help employees balancetheir work and family lives, we offer support that goes farbeyond flexible working hours and child care. According to theindividual’s needs, we make use of models such as telecommuting,flexitime, part-time positions and leaves of absence. Thepercentage of employees working part-time for <strong>BASF</strong> SE is9.9%. At the end of 2009, 488 <strong>BASF</strong> SE employees were onparental leave, of whom 5.3% were fathers.In host communities that lack childcare facilities, <strong>BASF</strong>offers supplementary programs. For example, in 2009, around1,000 children of our employees took part in the holiday childcareschemes offered at our German Group companies.Employees who care for relatives benefit from the opportunityto share experiences as well as attend counseling and coursesfor caregivers. Our “dual career” assistance offers worldwide supportto delegated employees’ partners to help them find a job.In 2009, our commitment was once again rewarded withrecognition as a family friendly company by the Hertie Foundation.For more information, see basf.com/worklife_balanceVocational trainingFor <strong>BASF</strong>, sustainable human resource management meanscontinuously offering apprenticeships and recruiting qualifiedyoung professionals, even in times of low personnel requirements.<strong>BASF</strong> is currently training 2,401 young people in morethan 50 occupations in 16 countries. In 2009, 1,083 young peoplestarted apprenticeships and traineeships at <strong>BASF</strong>’s Germancompanies and in the <strong>BASF</strong> Training Verbund. Since 2004, the<strong>BASF</strong> Training Verbund, which today has around 700 partnercompanies, has created additional apprenticeship positions inGermany and is currently training 3,274 young people. Afterpassing their final examination, 93% of the apprentices and traineesat <strong>BASF</strong> SE received a job offer in 2009. In the <strong>BASF</strong> TrainingVerbund, 77% of the apprentices were offered a job. Thenumber of dual work-study degree programs offered in Germanyrose to 17. Together with Bingen University of AppliedSciences in Bingen, Germany, <strong>BASF</strong> began offering a degree inProcess Technology in 2009. We invested around €68.8 millionin our apprentices and trainees worldwide in 2009. In addition,as part of our social commitment, we invested approximately€24.5 million in the Training Verbund.Further trainingDespite the difficult economic environment, we have continuedto offer a high level of further training opportunities. In annualperformance reviews, we determine every employee’s need forprofessional development and further training. In addition toseminars and workshops, we offer extensive opportunities forindependent learning, some of which are available worldwidevia electronic media. Our employees made intensive use of thesetraining opportunities in 2009. The <strong>BASF</strong> Learning Center inLudwigs hafen received over 50,000 visits in its fifth year – a newrecord. We also extended our European Learning Portal to aglobal portal in 2009. The platform is currently being used in fiveprojects throughout the world, for example, by the ConstructionChemicals Academy. We support our managers in their developmentthroughout their careers. For example, in leadershipworkshops and seminars, they have the opportunity to discussthe latest management topics. In 2009, <strong>BASF</strong> invested around€134 million (2008: €129.6 million) in vocational training andfurther training. More than 86,000 employees participated intraining programs throughout the world. On average, eachemployee spent 3.5 days at training events (2008: 3.9 days).Balancing career and family– Flexible working models available– Childcare offered at sites where demand is high– Worldwide “dual career” assistance– Services for employees who are caring for relatives– Recognized as a family-friendly company by theHertie FoundationVocational and further training– Level of vocational and further training maintained,even in economically challenging environment– Around €134 million invested in vocational andfurther training– Worldwide, 2,401 apprentices in over 50 occupations– More than 86,000 employees participated in trainingprograms worldwide
88Management’s <strong>Analysis</strong> <strong>BASF</strong> <strong>Report</strong> 2009Employees and societyEmployeesCompetitive advantages through diversityThe diversity of our employees creates opportunities for <strong>BASF</strong>.It helps us to react to changing markets and tap into new customersegments. The goal of our Diversity + Inclusion initiativeis to recruit and support employees worldwide who bring avariety of social and specialized skills to our company and contributeto <strong>BASF</strong>’s success. We aim to encourage a corporateculture in which everyone plays a part and is appreciated. Furthermore,we respond to expectations regarding careeradvancement and work-life balance. Our Best Team approachfocuses on the inclusion of varying competencies and backgrounds,but without setting an overall project goal such as quotas.All divisions and regions define their goals based on theirown business strategies and situations, and implementindividual measures to achieve them. Anchoring these values inour business is the basis of our strategy. In 2009, we analyzedsuccess factors and potential for improvement in pilot projectsin Europe, North America and Asia: In this way, we examinewhich project measures lead to improvements. As a result, weare implementing Diversity + Inclusion measures globally in furtherareas.In 2009, the percentage of women in senior executivepositions in the <strong>BASF</strong> Group was 6.5%. The percentage of non-German senior executives was 32.7% in 2009, while 76.8% ofsenior executives had international experience. We provideequal opportunities for all employees and are committed to theequal treatment of both men and women. We do not make anydistinction between male and female employees when it comesto setting salaries.For more on this topic, see basf.com/diversityDialogue with employee representativesCooperation with our employee representatives in a spirit of partnershipis firmly established at <strong>BASF</strong>. Using established procedures,we involve the employee representatives in decision-makingprocesses and procedures in the Group companies, inaccordance with legal regulations. For cross-border issues, the<strong>BASF</strong> Europa Betriebsrat (Europe Works Council) has beenresponsible for employees in Europe since 2008. In the otherregions, platforms for cooperation have also demonstrated theirvalue. For example, for the past ten years, the South Americannetwork meeting “diálogo social” has provided a platform for managementand employee representatives to meet directly.For more information, see page 16 andbasf.com/employeerepresentationEmployee participation in the company’s successWe want employees to share in the company’s success and berewarded for their individual performance. We pursue this goalby means of variable remuneration systems which follow thesame basic principles for all employees. As a rule, a salary consistsof a fixed and variable component. The variable componentis determined by two factors: the economic success ofthe <strong>BASF</strong> Group measured by the return on assets, and theemployee’s individual performance. Thanks to the clear relationshipbetween economic success and the variable remunerationsystem, our employees have noticeably participated in <strong>BASF</strong>’ssuccess in recent years. In the economically difficult year of2009, these systems led to cost reductions for the company.Share programs for employeesOur employees can invest a portion of their remuneration in<strong>BASF</strong> shares. The “Plus” share program promotes the long-termparticipation of our employees through incentive shares, thusfostering their interest in the company’s success and its performance.In 2009, 20,852 employees purchased 1,187,620 sharesunder the Plus program.Since 1999, <strong>BASF</strong> has offered its senior executives theopportunity to participate in the <strong>BASF</strong> stock option program(BOP). The program ties a proportion of their compensation tothe long-term performance of <strong>BASF</strong> shares. In 2009, 90% of theapproximately 1,100 senior executives eligible participated inBOP worldwide, investing up to 30% of their variable compensationin shares.Strategic initiative Diversity + Inclusion– Goal: expand our range of skills– Values anchored in our business– All divisions and regions define their goals andindividual measures– Pilot projects in 2009 show which projectmeasures lead to improvementsEmployee participation and share programs– Variable remuneration systems led to reducedcosts in 2009– 20,852 employees purchased 1,187,620 shares underthe Plus program– <strong>BASF</strong> stock option program (BOP) ties a part of remunerationto the development of the <strong>BASF</strong> share price– 90% of approximately 1,100 senior executives eligibleparticipated in BOP program
<strong>BASF</strong> <strong>Report</strong> 2009Employees and societyManagement’s <strong>Analysis</strong>Occupational safety and health protection89Occupational safety and health protectionThe safety and health of our employees play a key rolein <strong>BASF</strong>’s success. We have made significant achievementsas a result of our high standards. Over the years,we have been able to considerably reduce the number ofaccidents, benefiting both our employees and thecompany.We have set ourselves ambitious goals and we aim to continueimproving our performance in the areas of occupational safetyand health protection, thanks to comprehensive precautionarymeasures and the active participation of our employees.2020 GoalOccupational safety and health protectionReduce work-relatedaccidents 1 (baseline year 2002)– 80%1per million working hoursReduce occupationaldiseases 1 (baseline year 2004)– 80%High priority on occupational safetyWe promote 100% safety at work through risk assessments,safety regulations, seminars and training courses. Accidentsand near-misses are analyzed in order to eliminate potentialweak points. Furthermore, in 2008 we started a global safetyinitiative that aims to go beyond the traditional technical andorganizational measures. This initiative aims to strengthenevery individual’s safety awareness relating to themselves andothers, and thus to achieve behavioral changes. So far, morethan 14,000 employees at 36 sites throughout the world haveattended events relating to this initiative. The initiative supportsour occupational safety goal: By 2020, we want to reduce ourlost-time injury rate per million working hours by 80% worldwidecompared with 2002. In 2009, a total of 1.7 such accidentsoccurred at <strong>BASF</strong> sites (2008: 1.8). This represents a reductionof 46% compared with 2002. Unfortunately, in 2009, we experiencedfatal accidents for the first time since 2005. At theLudwigshafen site, one employee died in a traffic accident anda second was killed in a conveying system for transport pallets.In Indonesia, a third employee died as a result of an accidentwith a fork lift truck. For companies contracted to work at <strong>BASF</strong>sites, the number of occupational accidents decreased to2.6 per million working hours (2008: 3.4). In order to achievefurther improvements, these companies are included in oursafety initiative.Innovative health protectionOur global Occupational Medicine and Health Protection Programintegrates health topics into the organization, defines professionalstandards and bundles expert knowledge regarding medicalissues relating to work and the environment. <strong>BASF</strong> also makesthis knowledge available to its neighbors and customers. Forexample, we have developed and published medical guidelinesfor the treatment of acute exposure to chemical substances.We have set a goal of reducing cases of occupationaldiseases in the <strong>BASF</strong> Group by 80% in comparison with 2004;in this baseline year, 0.4 new cases of occupational diseases werereported per million working hours. This figure includes preventablediseases such as noise-induced hearing damage. In 2009,there were 0.4 new cases of occupational diseases per millionworking hours at <strong>BASF</strong>. This is the same level as in the baselineyear and reflects increased awareness for individual occupationalillnesses within the regions. In order to achieve our health goal,we also carry out preventive measures. Preventive medicalexaminations and plant inspections help us determine occupationalhealth measures. Regular audits help us to improve our performanceworldwide. We also foster health-conscious behavior:More than 22,000 employees took part in our global healthcampaign to encourage greater daily physical activity in 2009.<strong>BASF</strong> has had a company-specific pandemic preparednessplan in place for many years. It consists of medical, hygienic andorganizational measures.For more on preventive health care, see page 86Key issues in occupational safety andhealth protectionLost time injury rate per million working hours(reduction compared with baseline 2002: –46%)2009 1.72008 1.82007 2.22006 1.72005 1.82002 1 3.3– Successful health management including modern occupationalmedicine methods for prevention, emergencymedicine and health promotion– Success factors for occupational safety: clear rules,safety-conscious behavior, open dialogue– Reduction of 46% in lost time injury rate compared with2002; rate of occupational diseases at the level of thebaseline 2004For more, see basf.com/occupational_safety andbasf.com/health_protection; for more on audits, see page 981baseline
90Management’s <strong>Analysis</strong> <strong>BASF</strong> <strong>Report</strong> 2009Employees and societySocial commitmentSocial commitmentWe aim to be an attractive employer, reliable partnerand good neighbor. That is why we take on social responsibilityand actively support diverse projects worldwidein the host communities where our sites are located.Our focus is on education and science – in this way,we promote innovative capacity and make regions fitfor the future.In 2009, the <strong>BASF</strong> Group spent a total of €48.1 million onsupporting projects (2008: €64.7 million). Of this total amount,we donated 27.7% (2008: 38.6%).We primarily support projects that improve access to education.In addition, we actively support social, sports and culturalactivities. We have a strong focus on our host communities. Afterall, <strong>BASF</strong>’s economic success also depends on the trust thatemployees and neighbors place in us. In our corporate strategy,we commit to conducting business sustainably. We also followthis principle for our social commitments. We support initiativesthat reach a lot of people and have long-lasting effects. In orderto achieve this, we work with reliable partners who have thenecessary expertise and experience. For example, <strong>BASF</strong>Sozialstiftung (“<strong>BASF</strong> Social Foundation”) implements internationaldonation projects together with U.N. organizations. It is<strong>BASF</strong> policy not to fund political parties. In the United States,our employees have made use of their right to establish a PoliticalAction Committee (PAC), a non-partisan, federally registeredgroup of employees that supports candidates for political postsat federal, state and local levels.For information on our social business <strong>BASF</strong> Grameen Ltd.,see page 25 onwardSupporting education and scienceOur focus is on projects where we can incorporate our core competenciesand experience. We offer Kids’ Labs at our sites in 15countries. A total of 52,171 children and young people participatedin 2009. In Germany, <strong>BASF</strong> is a founding member of theKnowledge Factory, and together with around 70 other companies,supports education projects, young entrepreneurs andpeople starting new businesses. Since it was founded in 2005,the Knowledge Factory has entered into more than 1,600 educationalpartnerships with schools, reaching around 120,000children. In the area of early childhood education, <strong>BASF</strong> hassupported more than 15,000 children and approximately 1,200educators in the Rhine-Neckar Metropolitan region with itsinvolvement in the “Action on Education” initiative. The initiativereceived awards from World Vision Deutschland and the GermanCommission for UNESCO. In Brazil, <strong>BASF</strong>, the UnitedNations and the city of São Paulo set up a youth educationcenter with residents in the impoverished Vila Brasilândianeighborhood.For more on the Knowledge Factory, seewww.wissensfabrik-deutschland.de<strong>BASF</strong> Group donations, sponsoring and own projects in 2009(million €)1 Science 4.3 (8.9%)2 Society 2.6 (5.5%)3 Culture 5.6 (11.7%)4 Sports 1.8 (3.7%)5 Education 31.5 (65.4%)6 Other 2.3 (4.8%)International donation projectsIn 2009, the <strong>BASF</strong> team continued to support international projects.<strong>BASF</strong> Social Foundation’s Christmas donation campaigncontributes to improving the drinking water supply in theUmzimvubu region of South Africa. <strong>BASF</strong> SE made a donationof €100,000 to the project as starting capital. <strong>BASF</strong> employeesin Germany and South Africa together also donated more than€100,000. Our partner for this project is the United NationsEnvironment Program (UNEP). A further joint project in Guatemalaplans to teach people in mountain regions how to produceclean drinking water from rainwater. In the area of long-termreconstruction aid, <strong>BASF</strong> Social Foundation also supports a UN-HABITAT aid project for flood victims in India and Nepal, as wellas a disaster relief community project in the Philippines.For more information, see basf.com/international-donations561€48.1million234Principles and criteria for support– We focus our support on education and science– We mainly support projects in our host communities– We promote projects that bring long-term benefits– We work together with expert partners such asthe United Nations– <strong>BASF</strong> does not fund political partiesHighlights– Kids’ Labs in 15 countries– We have reached more than 15,000 children withAction on Education– Knowledge Factory has reached around 120,000 childrenwith more than 1,600 educational partnerships– Successful major projects with the United Nationsin 12 countries
<strong>BASF</strong> <strong>Report</strong> 2009Management’s <strong>Analysis</strong>Environment and safety Climate protection91Climate protectionIndustry, science, politics and society are being called onto curb global greenhouse gas emissions and make moreefficient use of available resources. <strong>BASF</strong>’s contributionto these aims takes a two-fold approach: We are constantlyworking to reduce greenhouse gas emissions inour production. Furthermore, we offer our customersproducts for climate friendly technologies which reduceemissions when they are used. For us, these are the driversof profitable growth with climate protection.StrategyClimate protection is one of the main challenges faced by society.<strong>BASF</strong> is committed to ambitious global climate protectionthat rapidly implements existing, economically-viable solutions.We invest in research and development in order to improve thecost-effectiveness of new climate protection solutions. At thesame time, solutions need to be developed for adapting to theunavoidable consequences of climate change. Against thisbackdrop, we are committed to initiatives such as “Seal the Deal”and the U.N.’s Nairobi Work Program.Climate protection is part of our sustainability strategy. Wehave set ourselves specific implementation goals which we arerigorously pursuing. These are based on a worldwide action planfor energy efficiency and climate protection. In 2008, <strong>BASF</strong> wasthe first globally operating industrial company to appoint aClimate Protection Officer.We seize market opportunities with our climate protectionproducts – product groups that when used save at least twiceas much CO 2as is emitted during their production and disposal.In 2008, these products accounted for around €6 billion, or 10%,of <strong>BASF</strong>’s sales. Our climate protection strategy was once againrecognized with a listing in the prestigious Carbon DisclosureLeadership Index (CDLI) in 2009, ranking <strong>BASF</strong> first in the materialssector.For information on emissions certificates, see page 109Corporate carbon footprintGreenhouse gas emissions in the chemical business(1,000 metric tons of CO 2equivalent per year)GWPfactor*Baseline2002 2006 2007 2008 2009CO 2** 1 18,236 20,250 21,433 20,727 19,622N 2O 310 6,407 4,602 5,963 6,294 9,553CH 421 10 12 21 15 12HFC*** 140 – 11,700 61 121 96 69 74PFC*** 6,500 – 9,200 0 0 0 0 0SF 623,900 0 2 1 2 124,714 24,987 27,514 27,107 29,262spec. GHG-factor**** 0.897 0.786 0.749 0.770 0.898*GWP factor: global warming potential of the individual gases compared with CO 2**Energy-related CO 2emissions cover both direct emissions arising from thegeneration of electricity and steam as well as indirect emissions from theacquisition and sale of electricity and steam.***Halogenated fluorocarbons (HFC) and perfluorocarbons (PFC); calculatedusing the GWP factors of the individual components (IPCC 1995)****Specific greenhouse gas factor = metric tons of greenhouse gases permetric ton of sales productUpdate of our corporate carbon footprint<strong>BASF</strong> is the only industrial company to regularly present a comprehensivecorporate carbon footprint for its chemical businessand have the calculations verified externally. This shows theopportunities and risks that we associate with climate change.The result for 2008 again showed that, when used by customers,<strong>BASF</strong> climate protection products save three times moregreenhouse gas emissions than are released in the productionand disposal of all products made by <strong>BASF</strong>. This corporate carbonfootprint covers the entire life cycle of the products. A totalof 90 million metric tons CO 2equivalent emissions from the rawmaterials, precursors, production and disposal is offset by savingsof 287 million metric tons of CO 2equivalents. Our aim is tomaintain or even improve this factor of 3:1 in the long term. Weactively support global standards for compiling corporate carbonfootprints through our commitment to the World Business Councilfor Sustainable Development and the World Resources Institute’sGreenhouse Gas Protocol Initiative. We have also madeour method for compiling a corporate carbon footprint availableto the International Council of Chemical Associations (ICCA) soit can draw up a study for the global chemical industry.287 million metric tonsTotal savings from use ofproducts through entirelife cycle3:190 million metric tonsEmissions from rawmaterials, productionand disposal of all <strong>BASF</strong>productsSavings ofCO 2equivalentper year 1Emissions of CO 2equivalent peryear 1– <strong>BASF</strong> is the only industrial company worldwide to regularlypresent a comprehensive corporate carbon footprint– Results of the carbon footprint show <strong>BASF</strong> products savethree times more greenhouse gas emissions than arereleased in the production and disposal of all products– <strong>BASF</strong> wants to maintain or even improve this factor of 3:1in the long term to secure competitive advantages andachieve its ambitious climate protection goalsMore information at basf.com/corporate_carbon_footprint1from products produced in 2008
92Management’s <strong>Analysis</strong> <strong>BASF</strong> <strong>Report</strong> 2009Environment and safetyClimate protection2020 GOALReduce greenhouse gas emissions– 25%By2020, we aim to reduceour specific greenhousegas emissions per metricton of sales product by25% compared with 2002.Global climate protection goalsIn 2009, emissions of greenhouse gases from <strong>BASF</strong>’s chemicaloperations worldwide totaled 29.3 million metric tons (2008: 27.1million metric tons). This increase was primarily due to theacquisition of Ciba and extensive repair and installation work onthe nitrous oxide decomposer for our plants in Ludwigshafen.In addition, the efficiency of our plants declined in 2009 due tosignificantly lower capacity utilization. Therefore, our specificgreenhouse gas emissions were at the same level as in 2002(2008: –14%). However, we remain committed to our long-term2020 climate protection goal. We are developing measures topermanently reduce emissions of carbon dioxide and nitrousoxide, and implementing them in stages. At the end of 2009, weinstalled proprietary catalysts at our Ludwigshafen site whichare even more efficient at breaking down the greenhouse gasnitrous oxide from the adipic acid and nitric acid plants. Theadditional nitrous oxide decomposers can also be used in thefuture to prevent emissions when the existing decomposer isundergoing repairs and maintenance work. These and othermeasures will lead to reductions of several million metric tonsof greenhouse gas emissions per year. We started up a newinland ship terminal in Antwerp in 2009, and will complete theconstruction of our new intermodal transportation terminal atthe beginning of 2010, which will also reduce emissions fromour logistics operations. From 1990 to 2002, <strong>BASF</strong> alreadyreduced greenhouse gas emissions in the chemical businessby 38% in absolute terms, and specifically by 61%.In 2009, emissions of greenhouse gases from oil and gasproduction totaled 1.8 million metric tons (2008: 1.4 million metrictons). <strong>BASF</strong>’s subsidiary Wintershall has set itself the goal ofstopping the continuous flaring of gases associated with crudeoil production in routine operations at all its oil production sitesby <strong>2012</strong>. At our site in Emlichheim, Germany, we started up acombined heat and power plant in 2009. This created thenecessary infrastructure to make use of the associated gases.To achieve our goal, we only have to stop flaring at one remainingsite, for which we will develop a technical solution by <strong>2012</strong>.Overall, utilization of gas associated with oil production reducesgreenhouse gas emissions in Libya and Germany by around twomillion metric tons per year.<strong>2012</strong> GOALStop the flaring of associated gases100%Wewant to stop theflaring of associated gasesthat are released duringcrude oil production byWintershall.Since the end of 2008, we have assigned greenhouse gas emissionsto individual production areas. The division heads and ourenergy efficiency and climate protection specialists discuss howto increase energy efficiency and reduce greenhouse gas emissionsand subsequently introduce the necessary measures.For information on transfer of climate protection technology toemerging economies, see basf.com/partnerships_climateInnovation for climate protectionProducts and processes that improve energy and raw materialefficiency or contribute towards the use of renewable energiesrepresent an important area of innovation for <strong>BASF</strong>. For example,our spray-applied membrane MASTERSEAL ® 345 is beingused in a tunnel construction project in Hindhead, U.K. With theuse of this <strong>BASF</strong> product, the construction method requires lessconcrete and our customer reduces CO 2emissions by around1,600 metric tons and saves approximately €3.8 million.We expanded our collaboration with centrotherm photovoltaicsAG, a leading technology provider for the production ofsolar cells, in 2009. The aim is to develop chemical solutions toincrease the efficiency of crystalline solar cells and reduceproduction costs.Climate protectionReduction of specific greenhouse gas emissions 1per metric ton of sales product (in %)2002baseline2020 Goal–25%2003–7.22004–1.42005–10.92006 2007 2008–12.4–16.6–14.22009+0.1– Climate protection products account for 10% of<strong>BASF</strong>’s sales– Activities to reduce greenhouse gas emissions alongthe entire value-adding chain– An energy efficiency program and the Verbund helpus achieve climate protection goalsFor more on climate protection research and technology, see page31; for more on climate protection at <strong>BASF</strong>, see pages 54, 60 and 66and basf.com/climateprotection1reduction compared with baseline 2002
<strong>BASF</strong> <strong>Report</strong> 2009Management’s <strong>Analysis</strong>Environment and safety Energy93EnergyEnergy efficiency is the most important means ofcombining climate protection, resource conservationand economic benefits. <strong>BASF</strong> takes a three-prongedapproach to responsible use of energy, focusing on efficientenergy generation, reducing energy consumptionin our production facilities and developing products andtechnologies for the efficient use of energy.Strategy and goalsThe careful use of resources is a fundamental economic principlefor <strong>BASF</strong>. Energy efficiency is the key to lowering energy consumption.In 2008, we set ourselves a new goal to improve ourenergy efficiency. We are pursuing this goal using three methods:efficiency in energy generation, savings through ourEnergy Verbund, and our energy management, which includesall those activities we use to analyze and further increase energyefficiency at <strong>BASF</strong> plants. In this way, we develop integratedenergy concepts that are tailored to the conditions at the site,combine competitive prices with supply reliability and make acontribution to climate protection.2020 GOALIncrease energy efficiency+ 25%We want to improve theenergy efficiency of ourproduction processes by25% compared with 2002.The drop in demand in 2009 led to reduced production volumesin the <strong>BASF</strong> Group’s chemicals business and therefore to adecrease in energy consumption. This decrease was significantlygreater than the additional energy consumed by theintegrated Ciba sites. Compared with the previous year, energyconsumption declined by a total of 1.5 million MWh. Due to necessaryshut down and start up processes and the lower capacityutilization rates at plants, the energy efficiency – measured asthe volume of sales products produced in relation to the energyrequired – declined compared with 2008. Compared with thebaseline 2002, the figure in 2009 was only 15.7% higher.Despite the difficult economic environment, we continueto focus on measures that increase our energy efficiency andto adhere to our energy goal for 2020.Furthermore, we offer solutions that save energy andreduce CO 2emissions. We are present on renewable energymarkets with products such as organic semiconductor materialsfor solar panels and system solutions for wind turbines.For more on energy-efficient processes and products,see pages 28 and 94Energy managementWorldwide, we analyze energy consumption and costs, identifypotential savings and use this information to develop measures.Our production plants are already very energy efficient. Thestructured exchange of experience at regional and Group-widelevels helps us to apply methods that have proved successfulat one site to other locations. In 2009, energy efficiency investigationsat our Ludwigshafen site identified a total of morethan €10 million worth of energy-saving potential in more than50 plants. We identified around €25 million worth of annualenergy-saving potential at our seven largest production sites inAsia. Measures implemented in North America in 2009 reduceenergy costs by around €4 million annually.Energy production at <strong>BASF</strong>To supply our production sites with energy, we use combinedheat and power (CHP) plants to generate both power and steam.They achieve overall fuel efficiency of almost 90%, and are usedto meet around 75% of <strong>BASF</strong>’s electricity demand. Since theend of 2009, <strong>BASF</strong> subsidiary Wintershall has been using gas,which previously could not be economically used, to produceelectricity and steam at a combined heat and power plant inEmlichheim, Germany.Thanks to the environmentally friendly CHP technology,<strong>BASF</strong> saves almost 1 million metric tons of oil equivalent worldwideeach year, thus reducing CO 2emissions by around 2.2 mil-Energy efficiency at <strong>BASF</strong> Key issues in 2009– Strategy: efficient energy generation, savings through theEnergy Verbund and successful energy management– Quantitative goal to increase energy efficiency– Products and technologies for increased energyefficiency– Energy consumption and energy efficiency decreased– Savings of almost 1 million metric tons of oil equivalentthrough the use of CHP technology to produce electricityand steam in <strong>BASF</strong> power plants– Identification of energy savings potential of over €10 millionin Ludwigshafen and around €25 million in Asia– Measures in North America in 2009 reduce energy costsby about €4 million annually
94Management’s <strong>Analysis</strong> <strong>BASF</strong> <strong>Report</strong> 2009Environment and safetyEnergyEnergy supply of the <strong>BASF</strong> Group 2009Electricity supply1 Self generated 66%2 Purchased 34%2Electricity14.2 millionMWhelFossil and residual fuels used for power generation in<strong>BASF</strong>’s own power plants85%Natural gas28.9 million MWh11%Heating oil0.3 million MWhSteam supply1 Self generated 47%2 Waste heat 43%3 Purchased 10%23Steam50.7 millionmetric tons11%13%Total:Coal0.4 million MWhResidual fuels4.4 million MWh34.0 million MWhlion metric tons. Compared to conventional electricity and steamgeneration, <strong>BASF</strong> saved approximately 11 million MWh of fossilfuels in 2009 thanks to this technology. The amount of primaryfuel used to generate energy and steam (29.6 million MWh) correspondsto 63% of the total of primary fuel used in the <strong>BASF</strong>Group.Energy efficiency through the VerbundOur Verbund system links our production and energy demands,thus making a major contribution to energy efficiency. Heat fromproduction processes is not discharged into the environment;rather it is captured to be used at other production plants.Thanks to the Verbund system, <strong>BASF</strong> saves up to 1.5 millionmetric tons of oil equivalent per year, equal to a 3.4 million tonannual reduction in CO 2emissions. Furthermore, networkingseveral production facilities at one site reduces fuel consumptionas less transportation is required.For more on the Verbund, see page 22Use of fuels and sources of raw materialsWe focus on the sustainable use of conventional fuels for ourenergy supply. At 85%, the majority of our energy is supplied bylow-emission natural gas. We are also examining the use ofrenewable energy sources. These will make up a significantcomponent of our energy mix only when they become competitivein terms of costs and supply security.When choosing raw materials, we identify the bestresources in terms of sustainability in order to use these asefficiently as possible. For some applications, <strong>BASF</strong> replacesfossil raw materials with renewables provided they offerecological and economic advantages. Our crop protection productsand plant biotechnology contribute to raising the yields andquality of renewable raw materials.<strong>BASF</strong>, Wintershall and WINGAS worked with BIS E.M.S.in 2009 to develop a new process for treating biogas. Treatmentusing PuraTreat ® R+ purifies biogas to natural gas quality.The first biogas plants are expected to be using this technologyby 2011.For more on energy efficiency, see basf.com/resource_conservationEnergy VerbundFuels and raw materials– Contribution to the efficient use of energy– Linking of production and energy demands– Savings of up to 1.5 million metric tons of oil equivalentper year with the Energy Verbund– Sustainable use of conventional fuels– Use of renewable sources of energy if theyare competitive– Use of renewable materials when they offereconomic and environmental benefitsFor more on research on energy efficiency, see page 31 onward
<strong>BASF</strong> <strong>Report</strong> 2009Management’s <strong>Analysis</strong>Environment and safety Water95WaterThe sustainable use of water and the conservation ofwater resources worldwide are important concernsfor <strong>BASF</strong>. Our water conservation activities involve ourproduction and our products: We have decreased specificwater use in our production, reduced emissions towater and we are evaluating water protection and supplyconcepts at our sites. Our products contribute towater catchment and help our customers to save waterand reduce emissions to water.The availability and quality of water varies regionally and locally.We therefore employ different methods for using water sustainablyat our sites. To do so, we develop criteria to evaluatewhether water at our production sites is sourced sustainably.Most of our large sites are located close to rivers which guaranteea good water supply. Nevertheless, we analyze whetherany sites are located in regions in which water shortages canbe expected, and whether there are any risks related to longtermwater supply. In 2009, we developed a new water supplyconcept at our Verbund site in Antwerp. Until now, the site hasalso been using drinking water in production. From 2011 onward,the water used will be drawn from surface water in a tidalfresh water area in the southern part of the Netherlands.We already use the Eco-Efficiency <strong>Analysis</strong> to evaluateproducts and processes with respect to their emissions towater. In 2009, we also started incorporating new criteria suchas local water scarcity into the methodology. We contribute ourknow-how about sustainable water management to partnershipsand international initiatives, for instance as a strategic partnerof the European Water Partnership.<strong>BASF</strong>’s water use<strong>BASF</strong> uses water in the production of products, for cooling andcleaning and as a means of transportation. In 2009, <strong>BASF</strong> used1,977 million cubic meters (2008: 2,058 million cubic meters) ofwater worldwide. Of this amount, 95% was drawn from riversand lakes. Groundwater accounted for 4% and drinking waterfor about 1%. The majority of the water is used for cooling.We have decreased our specific water use in recent years, forinstance, by intensively recirculating water as much as possible.However, we do not want the recirculation of water to result inan increase in energy use, for instance when the water has tobe recooled, or in other negative impacts on the environment.The catchment, processing and transport of water requiresenergy. At our Ludwigshafen site, we have been able to reducethe specific energy use of our cooling water supply by 11% since2005 thanks to technical measures and optimized operatingmethods such as improved pump networks.2020 GOALReduce emissions to waterWe aim to reduce emissions of both organic substancesand nitrogen to water by 80% and of heavy metals by60% (baseline 2002).Emissions to waterOne tenth of the water used at <strong>BASF</strong> comes into contact withproducts when used for washing or as a solvent or a reactionmedium, for example. The resulting wastewater is treatedappropriately and biologically purified in wastewater treatmentplants.In 2009, <strong>BASF</strong> discharged a combined total of around185 million cubic meters of wastewater at all its production sites.We reduced emissions of organic substances to water by 80%compared with 2002. Emissions of organic substances – calculatedas chemical oxygen demand (COD) – amounted toaround 18,600 metric tons (2008: 20,600 metric tons). Emissionsto water of nitrogen (N total) were 3,600 metric tons (2008:4,400 metric tons). This amounts to a reduction of 84% comparedwith the baseline year 2002. Emissions of phosphorouswere 355 metric tons (2008: 376 metric tons). Our wastewatercontained 24 metric tons of heavy metals (2008: 27 metric tons).Heavy metal emissions were cut by 61% compared with 2002.Emissions to water 1Organic substances (in %)Nitrogen (in %)Heavy metals (in %)2002baseline200520062007200820092002baseline200520062007200820092002baseline20052006200720082009–26.22020 Goal–80%–51.7–64.2–65.9–77.5 –79.72020 Goal–80%–60.5–73.1–76.3 –80.3–83.92020 Goal–60%–42.6–44.3–55.9 –61.41reduction compared with baseline 2002
96Management’s <strong>Analysis</strong> <strong>BASF</strong> <strong>Report</strong> 2009Environment and safetyWaterWater balance of the <strong>BASF</strong> Group in 2009(Million cubic meters per year)SupplyUseDischarge2 31 Surface water 1,873(95%)2 Groundwater 79 (4%)3 Drinking water 25 (1%)91%9%Cooling2,426(of which 688are reusedrepeatedly)Production 12491 Cooling water 1,737(uncontaminated) (90%)2 Wastewater from 167production (9%)3 Graywater 18(1%)231Total:2,67511Total from production processes, graywater, rinsing and purification in productionThus, we significantly beat some of our goals for emissions towater in 2009. These represent absolute goals that are alsorelated to production volumes. Therefore the improvements arealso a result of the decline in production volumes. We will continueto adhere to our goals despite the Ciba integration andeven when production volumes rise.Our water protection concepts aim to ensure that nounforeseen emissions are able to enter natural water reservoirs.Despite our existing protection systems, 7.2 metric tons ofhydroxypivalic acid neopentylglycolester (HPN) entered theRhine river from the cooling water network at <strong>BASF</strong>’s site inLudwigshafen in June 2009. The unintentional release of thiseasily biodegradable intermediate product was caused by atechnical fault which was immediately corrected. In 2009, westarted a global project that will review the water protection conceptsat our major production sites by 2015.Business opportunitiesWe offer our customers solutions which save water or improveits quality. Our products make new technologies for water treatmenteconomically viable. In a new portable water purificationsystem, our product Luvitec ® and the plastic Ultrason ® are usedin a special filter membrane to help remove harmful bacteria andviruses from drinking water. <strong>BASF</strong> flocculants are used in wastewatertreatment facilities and effluent treatment. We have considerablyexpanded our portfolio of water treatment chemicalswith the acquisition of Ciba – for applications ranging fromagriculture, oil refineries, and mining to municipal drinking andwastewater treatment.Water conservationHighlights 2009– Reduce specific water use at our production sites– Optimize water protection concepts at majorproduction sites– Products to promote sustainable use of water bycustomers– Emissions to water reduced– Developed new water supply concept at Antwerp site– Expanded portfolio of water treatment products throughthe Ciba acquisitionFor more on our water treatment products, see page 59For more on this topic, see basf.com/water
<strong>BASF</strong> <strong>Report</strong> 2009Environment and safetyManagement’s <strong>Analysis</strong>Environmental and safety management97Environmental and safety managementEnvironmental protection and safety are important managementresponsibilities, for which we set ourselvesambitious goals. With globally applicable standards, weset out clear rules and make our employees aware ofthese values in the workplace. Our Responsible Care ®Management System and global directives ensure theimplementation of our voluntary commitments, which weregularly review. We focus on prevention and learn frompast incidents so that we can continuously improveour performance in terms of environmental protectionand safety.Responsible Care ManagementWe constantly work on improving our existing environment andsafety management system. Our overriding aim is to protect ouremployees and neighbors, as well as to safeguard our productivity.We support the global Responsible Care initiative of theInternational Council of Chemical Associations; in 2006,we co-initiated its Responsible Care Global Charter.The foundations of our environmental and safety work areset out in our corporate guidelines. Our Responsible Care ManagementSystem ensures that globally applicable standardsform the basis of our daily work: We have defined requirementsand responsibilities, as well as assessment methods for theimplementation of our standards. We have also created proceduresfor measuring and documenting our progress toward ourgoals. This forms the framework for the safe production of chemicalsand the responsible use and secure transportation of ourproducts. We will continue to develop guidelines for environmentaland safety management in the next few years. In annualmanagement reviews, our managers assess <strong>BASF</strong>’s environmentaland safety performance, achievement of goals, resultsof audits and changes to underlying conditions. We includeinformation from our stakeholder dialogue.In 2009, three new Group directives were adopted as partof our Responsible Care Management. Topics included globalincident reporting, corporate and information security, and abinding directive on toll manufacturing. With the latter, weensure that our environmental, health and safety standards arealso adhered to by firms who produce <strong>BASF</strong> products on ourbehalf.The new Group directive on reporting forms the basis ofour global incident database, in which we record all accidentsas well as near-misses and other incidents. It covers our sitesand transportation routes. We include incidents involvingemployees of <strong>BASF</strong>, personnel leasing companies and contractors.In this way, we analyze weak points that could potentiallyaffect the environment, the safety of our employees or our hostcommunities. In addition, the database helps us to systematicallylearn from mistakes so that we can pursue our goals forenvironmental protection and safety. This requires open communicationabout mistakes and challenges, which we supportthrough activities such as our new safety initiative. Informationabout incidents that may help us to avoid similar occurrencesin the future is communicated throughout the <strong>BASF</strong> Group.<strong>BASF</strong>’s commitment to environment and safety wasrecognized in 2009. For example, our subsidiary <strong>BASF</strong>Chemicals Co., Ltd. was honored by the Shanghai ChemicalIndustry Park for outstanding safety management for the thirdconsecutive year.For more on our guidelines, see page 15; for more on occupationalsafety and health protection, see page 89; for more on productstewardship, see page 101 onward; for more on stakeholderdialogue, see page 29. For more on Responsible Care,see basf.com/responsible-care_eSafeguarding plants, employees and know-howWe have global concepts in place to protect our employees andneighbors as well as <strong>BASF</strong>’s plants and company intellectualproperty. At the same time, these enable us to prevent productionstoppages and environmental damage. We train our safetyexperts regularly, not only in occupational safety, but also inplant safety such as explosion protection and the use of our riskmatrix. Using this matrix, we assess possible risks in <strong>BASF</strong>’splants according to estimated probability and potential impactand we develop appropriate protective measures. At the Ludwigshafensite alone, more than 500 employees took part inResponsible Care Management– Coordinates activities in the areas of environmentalprotection, health and safety– Three new Group directives adopted in 2009: on globalincident reporting, corporate and information securityand toll manufacturingSafety concepts– Global concepts for the protection of employees,neighbors, plants and intellectual property– Regional Security Managers coordinate protectivemeasures– Over 500 employees participated in training coursesin process safety at the Ludwigshafen site– More than 20,000 employees trained in informationprotection
98Management’s <strong>Analysis</strong> <strong>BASF</strong> <strong>Report</strong> 2009Environment and safetyEnvironmental and safety managementtraining courses in process safety in 2009. We introduced a fivestagesystem for the planning of plants, to prevent the unintentionalrelease of products, explosions or fires. It includes themost important aspects for environmental protection, safety andhealth protection, from design through to production.Our new, Group-wide security directive contains measuresfor early recognition of corporate and information protectionrisks, site-specific precautions to combat internal and externalcrime, as well as provisions to protect employees travelling onbusiness. We specifically provide information to our employeesabout current dangers; for example, in approximately 1,000cases in 2009, on country-specific high security risks related tobusiness trips. In 2009, we trained more than 20,000 employeesin how to correctly handle confidential information. In every<strong>BASF</strong> region, a regional security manager is responsible forcoordinating all protective measures.At <strong>BASF</strong>, respect for human rights in our security work isunquestionable. We integrate this topic into training for <strong>BASF</strong>security officers in Germany. In 2010, we will set out globalcorporate security requirements relating to this.For more on process safety, see basf.com/process_safety. For moreon occupational safety and our safety initiative, see page 89AuditsOur regular audits are a key component of the ResponsibleCare Management System. They ensure consistently high standardswithin the <strong>BASF</strong> Group in all areas of environmental protection,safety and health protection. Criteria include emissionsmonitoring, occupational and distribution safety, emergencyresponse and preventive health care. On behalf of the Board ofExecutive Directors, our audit teams for safety and environmentas well as for occupational medicine and health protectioninvestigate the implementation of Responsible Care at <strong>BASF</strong>sites and at our majority-owned subsidiaries. The tasks andspecifications for carrying out the inspections are set out in the<strong>BASF</strong> Group Directive Responsible Care Audits. These includea defined procedure to be followed if standards are not adheredto. Together with operating divisions, we develop and implementmeasures to bring about improvements. These audits are basedon <strong>BASF</strong> directives and regulations as well as applicable legalstandards. Our internal audit system complies with standardsfor external auditing procedures (ISO 19011 and OHSAS 1900).Worldwide, 154 <strong>BASF</strong> production sites are certified in accordancewith ISO 14001.In 2009, 99 safety and environment audits were carried outin the <strong>BASF</strong> Group at 63 sites. <strong>BASF</strong> carried out audits relatingto occupational medicine and health protection at 43 sites.For more information on certified sites, see basf.com/certifiedEmergency responseWith our emergency response, we are prepared for potentialincidents. We create specific emergency response plans for ourproduction facilities. If necessary, we include joint ventures, suppliers,neighboring companies, as well as cities and communitiesand their facilities into these plans and other emergency concepts.Furthermore, <strong>BASF</strong>’s central emergency responsesupports local emergency response units around the clock. Thiswas extended to sites acquired from Ciba in 2009. Includingassistance for third parties, we provided this sort of assistancein around 250 cases in 2009 – for example, our experts providedadvice at short notice on toxicology, environmental protectionand process safety. A Group-wide directive on emergencyresponse is planned for 2010. Our existing emergency systemsare checked regularly, for example in drills with our employeesand local authorities.A swift response is essential whenever accidents occurwhile chemicals are being transported. This is why we activelysupport networks that quickly provide information and assist inemergencies. These include the International Chemical Environmental(ICE) initiative and the German Transport Accident Informationand Emergency Response System (TUIS), which <strong>BASF</strong>coordinates. In recent years, we have expanded our engagementin China and set up a new network for chiefs of our Chinesefire departments. On average, we currently provide assistancein cases of accidents on transportation routes in the GreaterChina region every two to three days.For more information, see basf.com/emergency_responseResponsible Care auditsEmergency response– 99 audits on safety and environment, 43 audits onoccupational medicine and health protection– A total of 154 of our production sites worldwide arecertified in accordance with ISO 14001– Audits are based on <strong>BASF</strong> directives and regulationsas well as applicable legal standards– Local emergency response and global emergencyassistance available 24 hours a day– Commitment to emergency systems such as the InternationalChemical Environmental initiative and TUIS– Commitment in China expanded: new network of Chinesefire departments, assistance provided for accidents ontransportation routes in Greater China every two to threedays on average
<strong>BASF</strong> <strong>Report</strong> 2009Environment and safetyManagement’s <strong>Analysis</strong>Environmental and safety management992020 GOALReduce transportation accidents– 70%Weaim to reduce the rateof transportation accidentsworldwide per 10,000 shipmentsby 70% comparedwith 2003.Transportation, distribution and warehouse safetyThrough our specifications and measures for transportation anddistribution safety, we minimize risks to people and the environment.Our rules apply to all modes of transportation and includethe delivery and distribution of chemicals between all <strong>BASF</strong> sitesand their suppliers and customers. In our directives, we haveset out uniform standards for the transportation and storage ofchemical products in rented warehouse facilities. On this basis,we look beyond the relevant national provisions in inspectingthe structural and technical condition of existing warehousesand assess the safety of new warehouses. We also share ourexperience with others. For example, in 2009, we advised theGrand Duchy of Luxembourg on a safety and fire preventionconcept.If an incident occurs despite all of our preventivemeasures, we provide swift assistance and our transportationsafety advisors subsequently evaluate all of the information.Based on their reports, we develop measures to preventsimilar incidents in the future. For example, we have selecteda new cargo securing system that we are gradually introducingin Europe.We have reduced the number of transportation accidentsfrom 0.56 per 10,000 shipments in 2003 to 0.24 in 2009 (2008:0.36). These figures reflect accidents reported to us by ourlogistics partners. Product spillages during transportation arerecorded and assessed separately.We also assess our transportation partners regularly withregard to safety and quality. To do this, we use approved instrumentssuch as the Safety Quality Assessment System (SQAS).This assessment system was developed under the leadershipof the European Chemical Industry Association (CEFIC). It providesinformation regarding issues such as the training level ofthe transport company’s employees and its accident response.<strong>BASF</strong> is also a member of the Chemical Distribution Institute(CDI), which aims to improve the safety and quality assessmentof marine transportation using liquid bulk parcel tankers. Independentspecialists assess the condition of ships and theiroperation worldwide. We consider CDI’s safety reports whendeciding which vessels to use for transportation.For more on this topic, see basf.com/distribution_safetyReduction of emissions of air pollutantsOur environmental management includes monitoring emissionsfrom our plants. In addition to measuring greenhouse gas emissions,we also measure emissions of air pollutants. Air pollutantsinclude inorganic compounds such as carbon monoxide (CO),sulfur dioxide (SO 2), nitrogen oxides, ammonia and otherinorganic compounds, dust, heavy metals and non-methanevolatile organic compounds (NMVOCs).Even when the size of our portfolio grows, we will remaincommitted to our goal of reducing absolute emissions: By 2020,we aim to further reduce air pollutants from our chemical plantsby 70%. This target does not include emissions from oil and gasproduction as these are subject to substantial fluctuations duringexploration phases. Together with the operating divisions, weevaluate our progress in annual management talks.Transportation and distribution safety measuresTransportation accidents per 10,000 shipments(reduction compared with baseline 2003: –57%)2009 0.242008 0.36– Consistent standards for the transportation and storageof chemical products– Continuous monitoring of carriers with regard to safetyand quality2007 0.282006 0.452005 0.472003 1 0.561baseline
100Management’s <strong>Analysis</strong> <strong>BASF</strong> <strong>Report</strong> 2009Environment and safetyEnvironmental and safety management2020 GOALReduce emissions of air pollutants– 70%Weaim to reduce air pollutantsfrom our chemicalplants by 70% comparedwith 2002.In 2009, emissions to air in <strong>BASF</strong>’s chemical operations worldwidetotaled 31,300 metric tons (2008: 36,500 metric tons).This reduction was a result of technical measures as well asstructural changes and reduced production volumes, and morethan compensated for additional emissions from the integratedCiba sites. Due to increased use of production facilities, emissionsof ozone-depleting substances as defined by the MontrealProtocol totaled 108 metric tons in 2009 (2008: 63 metrictons), while emissions of heavy metals totaled 4 metric tons(2008: 8 metric tons).Emissions to airAir pollutants 1 (reduction compared with baseline 2002)2002baseline2003–4.0200420052006 2007 20082009Waste<strong>BASF</strong>’s fundamental principles for handling waste are “avoid,reduce, recycle”. We only dispose of waste after all recoveryoptions have been exhausted, and we do so in a correct andenvironmentally compatible manner. <strong>BASF</strong>’s own landfill sitesare continuously monitored. We inform the responsible specialistand approval authorities of the findings. When we makeacquisitions, we apply the same standards for responsible managementof landfill sites and contaminated sites in accordancewith our legal obligations – this also applies to the integration ofCiba. We regularly carry out audits of external waste managementcompanies.Worldwide, <strong>BASF</strong>’s production, including all former Cibasites, generated 1.69 million metric tons of waste in 2009 (2008:1.77 million metric tons). Oil and gas exploration accounted for0.19 million metric tons of this waste. Around 42% of our wastewas recycled or subjected to thermal recovery (2008: 43%); weaim to continue to increase this rate. The residual waste wasdisposed of by underground storage (14%), through incineration(44%) and by landfill (42%). According to the customary internationalcategories, 554,500 metric tons of the waste we disposedof was classified as hazardous and 431,800 metric tons as nonhazardous.2020 Goal–70%–37.0–40.5–42.6 –40.9–57.31Consist of: CO, NO x(sum of NO 2+ NO, calculated as NO 2), NMVOC (nonmethanevolatile organic compounds), SO x, dust and NH 3/other inorganics–63.5We reduce emissions of air pollutants through end-of-pipeenvironmental technology such as exhaust gas scrubbingplants, while technical improvements also make a contribution.By installing a new thermoreactor for the phthalic acid plant atthe Ludwigshafen site, we have been able to reduce emissionsof air pollutants by 8,100 metric tons since 2007 – a reductionof more than 99%.Costs and provisions for environmental protectionThe overall costs of operating environmental protection facilitiesthroughout the <strong>BASF</strong> Group amounted to €669 million in 2009(2008: €706 million). <strong>BASF</strong> invested an additional €141 millionin new and improved environmental protection plants and facilities(2008: €165 million). These capital expenditures involvedboth end-of-pipe measures as well as integrated environmentalprotection measures.Provisions established for environmental protectionmeasures and remediation amounted to €598 million as ofDecember 31, 2009 (December 31, 2008: €377 million). Thefigures are higher compared with 2008 primarily as a result ofthe acquisition of Ciba.Emissions of air pollutantsCosts and provisions for environmental protection– Absolute reduction goal is independent of growth in theproduct portfolio and production volumes– Emissions of air pollutants in 2009 totaled 31,300 metrictons, a reduction of 63.5% since 2002– End-of-pipe environmental technology and technicalimprovements reduce emissions of air pollutants– €669 million in overall costs for operating environmentalprotection facilities– €141 million additional investment in new and improvedenvironmental protection plants and facilities– €598 million in provisions for environmental protectionmeasures and remediation costs
<strong>BASF</strong> <strong>Report</strong> 2009Environment and safetyManagement’s <strong>Analysis</strong>Product stewardship101Product stewardshipProduct safety is an important part of our risk management.We strive for uniformly high standards for productstewardship worldwide which go beyond mere compliancewith legal requirements. Our standards are basedon our risk assessments and product testing, as well ascomprehensive, up-to-date information about our productsand how to use them safely.2020 GOALRisk assessment of all products>99%Riskassessment of allproducts that we sell inquantities of more than onemetric ton per yearGlobal responsibility for productsWe ensure that our products pose no danger to people or theenvironment when they are used responsibly and in the mannerintended. The basis is provided by our global directives onproduct stewardship and product safety. Our directive on productstewardship contains our voluntary commitment with worldwidegoals and applies to all operative decision makers, whoare also responsible for its implementation. We review the safetyof our products along the entire value-adding chain – from ourraw materials suppliers to our own production and finally to ourcustomers’ use of the products. To tap market opportunities,we are working on products that have positive characteristicswithout undesired side effects, such as low-dust tile adhesivesand mortar or alternative plasticizers for plastics.For more on auditing of suppliers, see page 27GoalsBased on risk assessments, we want to review all substancesproduced or sold worldwide in the <strong>BASF</strong> Group in quantities ofmore than 1 metric ton per year. The risk posed by a substanceis based on the combination of its hazardous properties and thepotential impact on people and the environment. As part of thisprocess, we conduct studies, collect data with customers onproduct use, and carry out risk assessments. Furthermore, wewant to review our sales products, including mixtures, in thesame way, regardless of the volume of individual substancesthey contain. We are therefore going far beyond the legalrequirements.With our goals we are supporting the implementation of theGlobal Product Strategy (GPS) of the International Council ofChemical Associations (ICCA). GPS is to establish global standardsand practices to improve the safety of using chemical substancesworldwide and to implement the Responsible CareGlobal Charter. We are taking part in information and further trainingevents related to GPS around the world, and particularly inAsia. In addition to our commitment to GPS, we are also voluntarilyengaged in the United Nations’ Strategic Approach forInternational Chemicals Management (SAICM).Transparency for product safetyWe store data records for our substances and products that wehave evaluated in a global database, which allows us to providethis environmental, health and safety information at any time. Asour product portfolio is constantly changing, for example, dueto innovation and acquisitions, we continuously update thedatabase with new substances and products. Safety datasheets on all our sales products are available in 34 languages.Our global emergency hotline network provides information24 hours a day, seven days a week. If required, we offer our customerstraining courses on the safe use of our products.Implementation of REACH and GHSAs a further contribution to international chemical safety, <strong>BASF</strong>supports the goal of the Globally Harmonized System (GHS), forthe classification and labeling of chemicals. The new regulations,such as globally uniform hazard statements, will requirea lot of adaptations in <strong>BASF</strong>’s systems. In parallel to this, <strong>BASF</strong>is implementing the requirements of the European Union’sKey issues concerning product stewardshipTransparent product safety– Global directives on product safety and productstewardship– Global goals– Product safety reviewed for the entire value-adding chain– Business opportunities with products that have positivetechnical properties without undesired side effects– Global database containing environmental, health andsafety information on substances and products– Safety data sheets for all chemical sales products– Global network of emergency hotlines– Customer training on handling products
102Management’s <strong>Analysis</strong> <strong>BASF</strong> <strong>Report</strong> 2009Environment and safetyProduct stewardshipchemical regulation REACH. After the successful completion ofthe pre-registration phase, the first stage of registration is nowunderway. By the end of November 2010, all substancesproduced in annual quantities of over 1,000 metric tons, as wellas environmentally hazardous substances and substances withcarcinogenic, mutagenic or reprotoxic effects, have to be registered.In the Substance Information Exchange Forums (SIEFs),<strong>BASF</strong> participates in sharing data in order to reduce the numberof animal studies and costs. For many of our substances,we have taken on the role as lead registrant in the SIEFs.Our expertise gained in evaluating substances and ourexisting processes for the implementation of our product stewardshipgoals help us meet the REACH and GHS requirementsat the lowest possible cost. We work in close cooperation withour customers and suppliers on REACH. This allows us tostrengthen the supply security of our raw materials and fostercustomer retention. So far, it is estimated that REACH will cost<strong>BASF</strong> an average of €50 million a year until implementation iscompleted in 2018. However, we hope that we will be able toreduce these costs by taking appropriate measures. At present,it is unlikely that REACH will result in any major changes to ourportfolio. The decision whether to continue to produce a productin the future depends on a multitude of factors, of which REACHis just one.Ecological and toxicological testingBefore launching products on the market, we subject them tosubstantial ecological and toxicological testing and register themwith the authorities. Laws and regulations usually prescribe thetesting that must be carried out, which can also include animalstudies. REACH will require additional data on the properties ofchemical substances, which will lead to an increase in the numberof animal studies required by law. We are committed to theprinciples of animal welfare. We reduce the number of animalstudies wherever possible and develop and implement alternativeand complementary methods. <strong>BASF</strong> has been operating itsown laboratory for the development of animal-free methods(alternative methods) since 2004. In cases where alternativemethods cannot be applied or these are not approved by theauthorities, we aim to obtain better data through optimized tests.To date, very few alternative methods have been approved bythe authorities. We apply all of these methods – and are doingso with increasing frequency: In 2009, we used alternative methodsin over 35% of toxicological studies (2008: 30%). We alsomade a complete switch to alternative methods in our laboratoryfor skin tests. For over 20 years, <strong>BASF</strong> has been involvedin all relevant research projects to develop alternative andcomplementary methods to animal studies. We are currentlyinvolved in six national research projects focused on alternativemethods.Use of nanotechnologyNanotechnology provides opportunities for <strong>BASF</strong> and society,such as climate protection solutions or more efficient use of rawmaterials. We aim to use these opportunities responsibly. Thesame standards for product stewardship apply here as for allother <strong>BASF</strong> products. Our Code of Conduct Nanotechnologysets out principles for using nanomaterials. We make a recordof working areas that may have contact with nanomaterials andminimize this contact, even before substance-specific limit valueshave been defined. We have been involved in research onthe safety of nanomaterials for many years. We publish all resultsof our safety research online. For NanoCare, a project ofthe German Federal Ministry of Education and Research (BMBF)completed in 2009, we collaborated with partners from industry,universities and research institutes to develop methods thatallow for even more precise measurement of the biological effectof nanomaterials. The results support the OECD’s safetyevaluation activities. In 2009, we continued our Dialogue ForumNano, where we discuss the opportunities and risks of nanotechnologywith consumer protection organizations, environmentalassociations and churches.REACH implementation– First stage of registration until the end of November 2010– For many of its substances, <strong>BASF</strong> is lead registrant inthe SIEFs– Advantages through expertise and our existing processesfor the implementation of product stewardship goals– Striving to reduce estimated costs of €50 million annuallyNanotechnology at <strong>BASF</strong>– Dialogue with consumer protection organizations,environmental associations and churches– Code of Conduct Nanotechnology for usingnanomaterials– Publication of the results of our safety research– BMBF (German Ministry of Education and Research)NanoCare project with partners from industry andresearch institutes successfully completedFor more information on this topic, seebasf.com/dialogue-nanotechnology
<strong>BASF</strong> <strong>Report</strong> 2009Management’s <strong>Analysis</strong>Risk report103Risk reportIdentifying, evaluating and managing risksThe goal of <strong>BASF</strong>’s risk management is to identify andevaluate risks as early as possible and limit businesslosses by taking suitable measures. The aim here is toavoid risks that pose a threat to <strong>BASF</strong>’s continued existenceand take improved managerial decisions to createlasting value. We understand risk to be any event thatcan negatively impact the achievement of our short-termoperational or long-term strategic goals. We defineopportunities as possible successes that exceed ourdefined goals.Controlling unit conducts opportunity/risk analyses, togetherwith the respective business units. These analyses cover aten-year timeframe and are reviewed during the course of thestrategic controlling and are updated if necessary.Risk management processThe <strong>BASF</strong> Group’s risk management process is based on theinternational risk management standard COSO II EnterpriseRisk Management – Integrated Framework, and comprises thefollowing steps:Organization, responsibilities and toolsOperational opportunities and risks: Short and mediumtermplanning covers a period of one to three years. Within thisframework, <strong>BASF</strong>’s operating divisions, corporate units andcompetence centers decentrally identify and quantify opportunitiesand risks that may lead to positive or negative deviationsfrom the respective business plan. The results are regularlyreported to the Strategic Planning & Controlling unit, where theyare checked and aggregated by means of Monte Carlo simulation.In addition, operational opportunities and risks are discussedin the monthly management report which is producedby the Corporate Controlling unit. Furthermore, if an individualrisk is identified which has an impact on earnings of more than€10 million, this must be immediately reported to the Board ofExecutive Directors.The Strategic Planning & Controlling and Finance corporatedivisions are responsible for aggregated risk management.Both corporate divisions also provide the necessary risk managementtools and expertise, refine the methods and areresponsible for communicating these globally. The Legal, Taxes& Insurance division and the Chief Compliance Officer reportdirectly to the Board of Executive Directors on legal and tax risksas well as on compliance risks.Strategic opportunities and risks: As part of the strategydevelopment for our strategic business units and when majorinvestment decisions are to be made, the Strategic Planning &– Identification of opportunities and risksOperational divisions decentrally identify opportunities andrisks using a variety of tools, such as expert interviews andteam-based approaches. These are complemented by market,competitive and environmental analyses as well as statisticalevaluations.The above are based on internal and external risk informationsources, macroeconomic scenarios that evaluate importantfactors such as industry growth rates, and our companywiderisk catalog, which acts as a checklist and supports theidentification process.– Assessment and quantificationWhere possible, opportunities and risks are quantified as to theirprobability of occurrence and impact on profitability. Therespective business plan serves as the reference base. In addition,we quantify the dependence of the individual business unitson macroeconomic factors, such as exchange rates and rawmaterials prices.– AggregationOpportunities and risks as well as the dependence on macroeconomicfactors are aggregated on the division and group levelto determine the spectrum of possible effects on profit and theprobability distribution. Correlations between individual eventsand factors, as well as internal interactions within the Verbund,are taken into account.Strategy and goalRisk management process– Earliest possible detection of risks– Taking measures to limit business losses– Avoidance of risks that threaten the company’scontinued existence– Supporting managerial decisions– Identification of opportunities and risks– Assessment and quantification– Aggregation– Management, measures and control– Monitoring and further development of the process
104Management’s <strong>Analysis</strong> <strong>BASF</strong> <strong>Report</strong> 2009Risk reportOrganization of <strong>BASF</strong> Group’s risk managementSupervisory BoardCorporate AuditExternal auditorsBoard of Executive DirectorsCorporate Controlling:Monthly ManagementInformation Meetings(levels 1 and 2)FinanceCorporate UnitsStrategic Planning& ControllingLegal, Taxes& InsuranceChief Compliance OfficerDivisionsRegionsVerbund SitesCompetence Centers– Management, measures and controlThe management of opportunities and risks as well as the takingof measures takes place on the divisional level. Measuresare taken at the <strong>BASF</strong> Group level for certain risks, such as risksassociated with raw materials prices and exchange rates, whichare partially reduced by Group-wide hedging effects. Thedetails are governed by our risk management handbook, uponwhich divisional specific regulations are based. The Board ofExecutive Directors regularly receives reports on the risk situationof the <strong>BASF</strong> Group. If certain risk thresholds are reached,the Board is informed immediately.– Monitoring and developmentCorporate Audit regularly reviews our risk management system.As part of the annual audit, the external auditor assesses theproper functioning of the early risk detection system set up inaccordance with Section 91 (2) of the German Stock CorporationAct. In order to continuously develop our risk managementsystem, we regularly enter into discussions and share ideas withcomparable industrial companies and service providers in therisk management field. When <strong>BASF</strong> was once again included inthe Dow Jones Sustainability Index in September 2009, thecompany received special recognition from analysts, amongother things for its risk management system.Significant features of the internal control and riskmanagement system with regard to the Groupfinancial reporting process (Section 315 (2) No. 5 ofthe German Commercial Code (HGB))The Consolidated Financial Statements are prepared by a unitin the corporate division Finance. <strong>BASF</strong> Group’s accounting processis based on a uniform accounting guideline that sets outaccounting policies and the significant processes and deadlineson a Group-wide basis. There are binding directives for the internalreconciliations and other accounting operations. Standardsoftware is used to carry out the accounting processes forthe preparation of the individual financial statements as well asfor the Consolidated Financial Statements. There are clear rulesfor the access rights of each participant in these processes.Internal control and risk management system with regard to the Group financial reporting process– Consolidated Financial Statements are prepared by a unit in the Finance corporate unit– Uniform, group-wide guideline that sets accounting policies, processes and dates– Evaluation of the internal control system for financial reporting based on a central risk catalog– Selection of companies and units with regard to risks, material impact on the ConsolidatedFinancial Statements or provision of service processes
<strong>BASF</strong> <strong>Report</strong> 2009Management’s <strong>Analysis</strong>Risk report105Employees involved in the accounting process meet the qualitativerequirements and participate in training on a regular basis.There is a clear assignment of responsibilities between theinvolved specialist units, companies and regional service units.We strictly adhere to the principles of segregation of duties anddual control. Complex actuarial reports and evaluations areproduced by specialized service providers or specially qualifiedemployees.Our internal control system for financial reporting continuouslymonitors these principles. To this end, methods are providedfor the structured and Group-wide uniform evaluation ofthe internal control system in financial reporting.A centralized risk catalog covers the significant risks for the<strong>BASF</strong> Group regarding a reliable control environment and properfinancial reporting. The risk catalog is revised and updatedannually.In a centralized selection process, companies and units areidentified that are exposed to particular risks or that have amaterial impact on the Consolidated Financial Statements of the<strong>BASF</strong> Group or that provide service processes. All significant<strong>BASF</strong> sites as well as all regions and divisions are taken intoaccount. The selection process is conducted annually. In therelevant companies and units, one person is given responsibilityto coordinate and monitor the execution of the steps.– Identification of control activitiesIn order to mitigate the risks to the financial reporting processlisted in our central risk catalog, corresponding control activitiesare conducted. The control activities of the largest companiesand those with special risks are documented in a globalIT system.– Assessment of the control activitiesAfter documentation, a test is performed to verify whether thedescribed controls are capable of adequately mitigating therisks. In the subsequent test phase, samples are taken to testwhether the controls were effective in practice.– Monitoring of control weaknessesThe responsible managers receive reports on any control weaknessesand their resolution, and an interdisciplinary committeeinvestigates their relevance for the <strong>BASF</strong> Group. The Board ofExecutive Directors is informed once control weaknesses havebeen identified that have a considerable impact on the financialreporting.– Internal confirmation of the internal control systemThe responsible managing director and chief financial officer foreach consolidated Group company confirm to the Board ofExecutive Directors of the <strong>BASF</strong> Group at the end of the annualcycle the effectiveness of the internal control system overaccounting as well as the adequacy of financial reporting.The annual evaluation process consists of the followingsteps:– Evaluation of the control environmentThe adherence to internal and external guidelines that are relevantfor the maintenance of a reliable control environment ischecked by means of a standardized questionnaire. Theassessment is performed by checking the awareness of rulesand is supported by sample taking.Risks from operationsDevelopment of sales markets: Because <strong>BASF</strong>’s customersare active in numerous sectors, shifts in demand naturallyimply opportunities and risks. We expect the global economyto recover slowly in 2010. However, overall we expect volatilityand risks to remain high. There is also the risk that with thefading effects of government stimulus programs and a possiblerise in key interest rates, demand in target markets will growmore slowly.For more on the outlook for 2010, see our forecastfrom page 112 onwardAnnual evaluation processDevelopment of sales markets– Evaluation of the control environment– Identification of the control activities– Assessment of the control activities– Monitoring of control weaknesses– Internal confirmation of the internal control system– Greater planning uncertainty with regard to aneconomic recovery in 2010– Volatility and risks remain high– Our customers’ refinancing risks represent salesmarket risks for our business– Risks limited through operative measures, such asclose cooperation with customers and optimalproduction management
106Management’s <strong>Analysis</strong> <strong>BASF</strong> <strong>Report</strong> 2009Risk reportSeveral divisions are directly affected by restrained demand inkey customer sectors, such as the construction and automotiveindustries, and increasing competition in sales markets.Other divisions are indirectly affected by a decline in the growthof demand for basic chemical products.The margins for commodities, such as cracker products orplastics, are particularly exposed to product-specific supply anddemand cycles. When demand is low, there is the possibilitythat higher raw materials prices cannot be passed on to our customers,or only to a limited degree.The financial crisis also represents a risk for our sales markets.If our customers have less access to credit and thereforecannot refinance their businesses, this could have a negativeimpact on our business.Where possible, risks related to the development of salesmarkets are mitigated using operational measures, for example,through close cooperation with customers and optimized productionmanagement. Furthermore, our regional and industrialdiversification also contributes to minimizing risks.Risks from the creation of overcapacities: As a result ofthe price advantage for raw materials in the Middle East, a significantcapacity expansion is currently taking place there forbasic chemicals, such as ethylene and propylene. In addition,large petrochemical capacities are being started up in China,meaning China’s imports are expected to decline. On a globallevel, we anticipate growing overcapacities.We manage the construction and expansion of productionfacilities based on expected demand and we schedule maintenanceturnarounds accordingly. We divest businesses in whichwe do not see satisfactory opportunities to differentiate ourselvesfrom our competitors in the long term. In order to achievelasting profitable growth, we are committed to operationalexcellence, innovation and investment in growth markets. Weconcentrate our research and business on innovative businessareas, which we also develop through strategic partnershipswith important partners.Overall, risks associated with the global and regional growth ofour customer industries as well as the creation of overcapacities– together with volatility in raw materials prices andexchange rates – are three of the top drivers of potential divergencesfrom our business planning.Availability and price volatility of raw materials: Currently,we do not see risks arising from raw material availability. Giventhe current economic environment, however, the risk of failureof individual suppliers has increased.We minimize procurement risks through our wide portfolio,our global purchasing activities and optimized procedures forthe purchase of additional quantities of raw materials on spotmarkets. If possible, we avoid procuring raw materials from asingle supplier. Where this cannot be avoided, we try to fostercompetition or we knowingly enter into these relationships andassess the effects of possible availability problems. We continuouslymonitor the credit risk of important business partners,both customers as well as suppliers. We adopt a similarapproach regarding the purchasing of logistics and technicalservices.Using our supply chain management, we identify potentialhigh-risk suppliers with regard to environmental protection,occupational safety and social responsibility standards andagree on corrective measures.For more on supply chain management, see page 27Risks from the creation of overcapacities– Product-specific management of plant constructionand expansion– Divestitures of businesses that do not provide sufficientopportunity for differentiation from our competitors– Research focus on innovative business areas, whichwe also develop via strategic partnershipsAvailability and price volatility of raw materials– Broad portfolio and global purchasing activitiesminimize procurement risks– Reduced oil and gas price sensitivity due to thecontribution of <strong>BASF</strong>’s own Oil & Gas business– Use of commodity derivatives to minimize cost risks
<strong>BASF</strong> <strong>Report</strong> 2009Management’s <strong>Analysis</strong>Risk report107The price volatility of feedstocks, in particular oil-based chemicals,is one of the three main drivers of opportunity and risk at<strong>BASF</strong>. We assume that the volatility of raw materials prices, atleast in the short term, will be above the historical level.Our dependence on the oil price is reduced through thecontribution of our Oil & Gas business. Furthermore, we minimizecost risks by using commodity derivatives. These measureshelp to secure margins when sharply rising raw materialsprices are expected, which in times of low demand cannot bepassed on via product prices, or only to a limited extent. Thiscould lead to expenses if prices do not move as expected.Technical risks: Guaranteeing the quality and availability of ourproducts can require unforeseen technical measures. Moreover,there is the risk that unscheduled plant shutdowns will berequired for safety reasons or due to technical problems. Forexample, as a precaution we shut down plants at our sites onthe U.S. Gulf Coast in the event of hurricane warnings. We minimizetechnical risks through continuous monitoring and improvementof facilities and processes as well as through ourglobal production Verbund.Financial risksThe management of currency and interest rate risks is conductedin the Treasury department. The management of commodityprice risks takes place in the Global Procurement & Logisticscompetence center or in the appropriately authorizedGroup companies. Detailed guidelines and procedures exist fordealing with financial risks. Among other things, they provide forthe segregation of trading and back office functions.Exchange rate volatility: Competitiveness on global marketsis influenced by fluctuations in the exchange rate. This generatessales market risks for the <strong>BASF</strong> Group, especially when theU.S. dollar exchange rate fluctuates. On the production side, wemitigate foreign currency risks by having local production sitesin the respective currency zones.Financial foreign currency risks result from the translation ofreceivables, liabilities and other monetary items in terms ofIAS 21 at the closing rate into the functional currency of therespective Group company. In addition, we incorporate plannedpurchase and sales transactions in foreign currencies in ourfinancial foreign currency risk management. These risks arehedged using derivative instruments, if required. Exchange ratevolatility is one of the top three driving forces for opportunitiesand risks within the <strong>BASF</strong> Group.Interest rate risks: Interest rate risks result from potentialchanges in prevailing market interest rates, which can cause achange in the present value of fixed-rate instruments, andchanges in the interest payments of variable-rate instruments.To hedge these risks, interest rate swaps and combined interestrate and currency derivatives are used in individual cases.In addition, if our credit rating were to be downgraded bycredit rating agencies, this could lead to increased refinancingcosts. In the short to medium term, <strong>BASF</strong> is largely protectedfrom the possible effects on the interest result thanks to the wellbalancedmaturity profile of its financial debt.For more on the maturity profile, see Notes to the ConsolidatedFinancial Statements on page 184Risks from metal and raw materials trading: In the catalystsbusiness, <strong>BASF</strong> employs commodity derivatives for preciousmetals and trades precious metals on behalf of third parties andon its own account. In addition, we use our knowledge of themarkets for crude oil and oil products to generate earnings fromthe trade of raw materials within predetermined limits and exposureconstraints. These activities are subject to constantmonitoring.Financial risksExchange rate volatility– Exchange rate volatility– Risks associated with interest rate changes– Risks from metal and raw materials trading– Liquidity risks– Risk of default on receivables– Impairment risks– Risks from pension obligations– Risks from change in exchange rate parities minimizedby local production– Risks from the conversion of receivables and liabilitiesas well as purchase and sales transactions in foreigncurrencies; hedging with derivatives
108Management’s <strong>Analysis</strong> <strong>BASF</strong> <strong>Report</strong> 2009Risk reportLiquidity risks: Risks from cash flow fluctuations are recognizedin a timely manner as part of our liquidity planning. Uncertaintyregarding economic developments as a result of the globalfinancial crisis makes it difficult to reliably forecast liquidityrequirements. We take these uncertainties, as well as potentialadditional liquidity requirements that would arise in the case ofan upswing, into account by means of additional risk scenarios.We update our liquidity planning immediately in response toevents. This means we can promptly take the necessary measureswhen required.We have significantly reduced the risks of refinancing in2009 by issuing medium and long-term bonds. At the peak ofthe financial and economic crisis, issuing bonds was more costlythan in previous years. However, we have access to comprehensiveliquid funds thanks to our solid rating, the commercialpaper program and committed bank credit lines. The commercialpaper program constitutes a reliable and economic sourceof liquidity for <strong>BASF</strong>, also during the financial crisis. We thereforecurrently rate our liquidity risks as low.For more on financial risks, see Notes to the Consolidated FinancialStatements from page 189 onwardRisk of default on receivables: We limit country-specific risksby internally determining country ratings, which are continuouslyupdated to reflect changing environment conditions. We useexport credit insurance and investment guarantees as the maintools to limit specific country-related risks. We lower credit risksfor our financial investments by engaging in transactions onlywith business partners and banks with good credit ratings andby adhering to fixed limits. Monetary transactions are also conductedthrough such banks. Against the background of the currenteconomic crisis, we continuously check the creditworthinessof our partner banks. We reduce the risk of default onreceivables by continuously monitoring the creditworthiness andpayment behavior of our customers and by setting appropriatecredit limits. Thanks to the worldwide activities and diversifiedcustomer structure of the <strong>BASF</strong> Group, there is no large concentrationof credit default risk. Risks are also limited throughthe use of credit insurance and bank guarantees.Impairment risks: The risk of an asset impairment occurs if theassumed interest rate in an impairment test increases or theforecast cash flows decline. As a result of the economic crisisand the associated changes in our customer industries constructionand automotive, a reduction in margins and slower volumegrowth can be observed in certain markets. This results inan increased risk of impairment of individual assets such ascustomer relationships, technologies and brands, as well asgoodwill.Risks from pension obligations: We predominantly financecompany pension obligations externally through separate planassets. In addition to the large pension plans of our Group companiesin North America, the United Kingdom and Switzerland,this applies particularly to <strong>BASF</strong> Pensionskasse VVaG and the<strong>BASF</strong> Pensionstreuhand e.V. in Germany. To address the risk ofunderfunding due to market volatility of plan assets, we align theinvestment strategy in terms of return and risk optimization tothe structure of the pension obligations. Stress scenarios aresimulated regularly as part of the portfolio analyses. The ongoingreview of the investment strategy was further intensified inreaction to the financial and economic crisis. Furthermore, weare reducing this risk by increasingly offering employees definedcontribution schemes. In 2009, we converted our defined benefitpension plans in the United States into defined contributionschemes.Liquidity risksRisks of default on receivables– Risks from cash flow fluctuations are recognizedas part of our liquidity planning– Issuance of medium to long-term bonds in 2009considerably reduced refinancing risk– Access to comprehensive liquid funds thanks to oursolid ratings, our commercial paper program andcommitted lines of credit– Country-specific risks limited by internal country ratings– Use of export credit insurance and investment guarantees– Credit risks are limited by credit limits– Use of credit insurance and bank guarantees
<strong>BASF</strong> <strong>Report</strong> 2009Management’s <strong>Analysis</strong>Risk report109Other risk areasRegulatory and political risks: Due to the European chemicalsdirective REACH, which came into force on June 1, 2007,<strong>BASF</strong> and our European customers face the risk of being placedat a disadvantage to our non-European competitors due to thecost-intensive test and registration procedures.Within the framework of E.U. emissions trading, the<strong>BASF</strong> Group was allocated emission certificates for thesecond trading period from 2008 to <strong>2012</strong>. We do not currentlyexpect any shortage of certificates for our activities in Europein this second trading period. However, the concrete design ofthe European emissions trading from 2013 is still unclear.Depending on the final design of the implementing regulation,<strong>BASF</strong> may be required to purchase several million additionalcertificates annually. Depending on the quoted prices for CO 2certificates, this will affect our cost position and therefore ourglobal competitive situation.Due to the amendment of the E.U. directive on industrialemissions (IED), scheduled for 2010/11, additional costs couldarise for reporting and for the conversion of existing plants.Additional risks are associated with an intensification ofgeopolitical tensions, the destabilization of political systemsand the erection of trade barriers (customs duties, embargomeasures). Overall, we regard the probability that regulatory andpolitical risks will occur as low; the financial impact canbe classified as low in the short term and elevated in themedium term.Research and development: Due to the high degree of complexityand uncertainty involved in chemical and biologicalresearch, there is a risk that projects might be discontinued,budgets may be exceeded or developed products will notreceive regulatory approval for sale. Our global Know-how Verbund,our collaboration with partners and customers as well asour innovation process reduce this risk. Within our project managementframework, we continuously review the efficiency,chances of success and the operating environment of researchprojects; this review includes all phases from idea generation toproduct launch. The trust of customers and consumers isessential for the introduction of new technologies. That is whywe enter into dialogue with stakeholders at an early stage of development.A significant contribution to long-term risk managementis made by the alignment of strategic goals and theresearch portfolio as part of both strategic planning and strategiccontrolling.For more on the stakeholder dialogue, see page 29Exploration: There are also opportunities and risks in oil andgas exploration. Geological uncertainties can result in varyingdegrees of success in the search for and development of oil andnatural gas reserves. We lessen such risks by means of a balancedexploration portfolio.Personnel: Dedicated and competent employees are essentialfor <strong>BASF</strong>’s sustainable success. Our goal is to form the bestteam in industry. Due to global competition for highly-qualifiedspecialist and management candidates, which is intensified bydemographic change, there is a risk that job vacancies cannotbe filled with suitable applicants, or only with a significant delay.The loss of expertise due to the high number of retirements inNorth America and Europe and the comparatively high level ofundesired turnover in Asia may have negative effects on business.Following the difficult economic situation in 2009, theintensification of competition for specialists and managers willquickly resume. In Europe, this affects the engineering and scientificprofessions in particular; a noticeable talent shortage canalready be observed.We address these risks with our global programs Generations@Workand Diversity + Inclusion, the further developmentof our employer brand and an emphasis on personnel developmentas well as additional regional initiatives. These measuresare aimed at both effective personnel recruitment andretention.For more on the individual initiatives and our aims,see page 85 onwardRegulatory and political risksResearch and development risks– REACH: cost-intensive testing and registration procedure– Emissions trading: risk of undersupply from 2013– E.U. directive on industrial emissions might requireconversion of plants– Know-how Verbund and close collaboration withcustomers minimize risks that projects will be stoppedprematurely, budgets exceeded or products notapproved for sale– Dialogue with customers and consumers about newtechnologies at an early stage
110Management’s <strong>Analysis</strong> <strong>BASF</strong> <strong>Report</strong> 2009Risk reportOverall, we rate the risk of a negative impact on our businessdue to the loss of managers and employees as significant.In addition, we expect this risk to increase in the medium to longterm, and are already working to counter these developmentsusing the above-mentioned methods as well as increasedinvestment in human resources marketing and personneldevelopment.Risks from acquisition and investment decisions: Implementingacquisition and investment decisions involves complexrisks. The evaluation of risks and opportunities already plays asignificant role during the assessment of potential acquisitiontargets. A detailed analysis and quantification are conducted aspart of due diligence. Examples of risks are: increased staff turnover,delayed realization of synergies or the assumption ofobligations that could not be quantified exactly in advance.Therefore implementation and follow-up assessments takeplace along defined processes. By nature, the acquired businessesare subject to general market risks and business-specificrisks. For this reason, acquired businesses are promptlyintegrated into <strong>BASF</strong>’s risk management process. This hasalready been carried out for most of the business activities ofthe recent Ciba acquisition.Legal risks: In order to assess the risks from current legal disputesand proceedings and any requirement to recognize provisions,we consider the results of comparable proceedings andindependent legal opinions as well as assumptions regardingthe probability of occurrence and the range of potential claimsin individual cases. In addition, we use our own analyses andassessments of the circumstances and claims asserted. Theactual costs can deviate from these estimates.We limit risks from potential wrongdoing or legal infringementsby using a centralized contract management and a Group-widecompliance program.For more on our Group-wide compliance program, see page 16and page 120 onwardIn addition, the Global Intellectual Property unit at <strong>BASF</strong> SE,together with the appropriate units of the U.S.-based <strong>BASF</strong> Corporationand <strong>BASF</strong> Coatings in Münster, Germany, monitors allthe intellectual property rights of <strong>BASF</strong>. We aim to avoid patentand licensing disputes whenever possible with the help ofextensive clearance research.Based on the measures taken, we classify the risk of damagesas low and the potential of an impact on earnings asmedium.Sustainability: <strong>BASF</strong> is committed to integrating environmentalprotection and socially responsible conduct into its businessactivities. Contraventions to our voluntary commitment to sustainabilityor to laws represent a reputational risk and could leadto operational or strategic risks. We have set up a global issuemanagement system for sustainability to enable us to promptlyrecognize risks and opportunities related to sustainability. Theresults are then used to initiate change processes in the companyin order to be prepared for any risks and to exploit opportunitiesaccordingly. We have established global monitoring systemsto enable us to ensure the adherence to laws and ourvoluntary commitments in the areas of environment, health andsafety as well as to labor and social standards. These systemsinclude our entire supply chain.In order to assure society’s acceptance of our businessactivities, we remain in continuous dialogue with relevant stakeholders.For more on monitoring tools, see page 25 onwardPersonnel– Addressing demographic change with theGenerations@Work program– Developing the employer brand to competeinternationally for highly-qualified specialist andmanagement candidates– Diversity + Inclusion initiative to encourageinternationality and diversityLegal risks– Central contract management and Group-widecompliance program– Monitoring of patents, licences and trademarksby Global Intellectual Property unit
<strong>BASF</strong> <strong>Report</strong> 2009Management’s <strong>Analysis</strong>Risk report111Information technology: Risks are caused primarily by thenon-availability of IT systems and applications, delayed provisionof important data, loss or manipulation of data and thedisclosure of confidential information. This can have negativeconsequences for the respective business processes.To minimize such risks, <strong>BASF</strong> has a stable and redundantlydesigned IT system, back-up processes, virus and accessprotection and encoding systems as well as integrated,Group-wide-standardized IT infrastructures and applications.The systems used for information security are tested andupdated on an ongoing basis. In addition, all our employeesreceive regular training on information and data protection.Risk management is conducted by using Group-wide regulationsfor organization and application, as well as an internalcontrol system based on this.Due to the measures taken, we regard the probability of arisk to our IT system as low. However, the potential impact wouldbe high.However, the volatility of raw materials prices and exchangerates remains high as does uncertainty regarding the overalleconomy and the performance of key customer industries.Nevertheless, based on our assessment, there are currentlyno significant individual risks that pose a threat to the continuedexistence of the <strong>BASF</strong> Group. The same applies to the sum ofindividual risks.Significant areas of opportunity and riskDevelopment of the economic situation andsales marketsAvailability and price volatility ofraw materialsCreation of overcapacitiesExchange rate volatilityMeasurementHigh contribution tooverall volatilityHigh contribution tooverall volatilityLong-term effects, strategicsignificanceHigh contribution tooverall volatilityRelative contribution to earnings from opportunities, risksand volatilityRemaining financial risksLow contribution tooverall volatilityDevelopment of the economic situation andsales marketsAvailability and price volatility of raw materials– Planning value +Regulatory and political risksSpecific opportunities and risks in theindividual divisionsLong-term effects, strategicsignificanceMedium contribution; highdiversificationExchange rate volatilityRemaining financial risksSpecific opportunities and risks in theindividual divisionsFurther risk areas (human resources, R&D, IT,acquisitions, etc.)Long-term effects, strategicsignificanceOverall assessmentCompared with the previous year, we expect the <strong>BASF</strong> Groupto be exposed to a lower overall risk in 2010. The situation atthe beginning of 2009 was characterized by significant uncertaintiesregarding the future impact of the recession. Althoughit currently appears that economic recovery remains weak andstill susceptible to temporary setbacks, we judge the extent ofrisks related to sales volumes, currencies, margins and financialmarkets to be lower than in the previous year.SustainabilityOverall assessment– Voluntary commitment to environmental protectionand socially responsible conduct– Adherence to standards assured by monitoring systems– Global management system for early identification ofimportant topics– Ongoing dialogue with stakeholders– No threat to the continued existence of the <strong>BASF</strong> Group– Highly volatile currencies and raw materials prices– Uncertainty regarding the economic environment andkey customer industries
112Management’s <strong>Analysis</strong> <strong>BASF</strong> <strong>Report</strong> 2009Forecast Economic environment in 2010Economic environment in 2010In the second half of 2008 and over the course of 2009,the global economy suffered its worst recession sincethe end of the Second World War. Leading indicators atthe end of 2009 were increasingly suggesting that thisslump has bottomed out. For 2010, we expect an averageoil price of $75 per barrel, and an average exchangerate of $1.40 per euro. A recovery of the world economyand a moderate rise in global gross domestic product(+2.7%) will characterize the year. Government stimulusprograms proved effective in 2009 and will be largelyphased out in 2010. In the industrialized countries, economicgrowth for 2010 will still be weak (+1.8%). Weexpect a significant global recovery from 2011 onward.From <strong>2012</strong>, we expect that the previous growth trend ofover 3% can be achieved again.Europe will continue to feel the effects of the financial crisis dueto continued difficulties in obtaining credit, higher unemploymentand low consumer spending. We forecast weak overallgrowth in 2010 (+1.1%). In comparison, the German economywill recover relatively well (+1.7%), as the demand for exportsrises against the backdrop of gradually increasing investments.Spain and Ireland will still be in recession in 2010. Despite theimproved economic outlook, there will be continued weaknessin the European construction and automotive industries. In themedium term, we expect moderate average growth for theEuropean Union (+1.4%).Outlook for gross domestic product 2010(Real change compared with previous year)World +2.7%E.U. +1.1%United States +2.6%Asia (excl. Japan) +7.0%Japan +1.3%South America +3.7%Trends in gross domestic product 2010 – <strong>2012</strong>(Average annual real change)World +3.0%E.U. +1.4%United States +2.8%Asia (excl. Japan) +7.1%Japan +1.5%South America +3.6%In the United States, the economy will begin to grow again in2010 after the recession has ended (+2.6%). However, privatedomestic consumption will contribute less to this growth thanbefore the crisis because of negative wealth effects due to thefall in real estate and share prices, and higher unemployment.The U.S. government’s massive economic stimulus plan andlow interest rates will support the recovery. Future options forfurther expansive fiscal policy will however be limited due to thesharp increase in national debt. As a result of a recovery in consumptionand investing activities, we expect solid economicgrowth in the medium term (+2.8%).For the year 2010, we expect the following economic conditions:– Recovery of the global economy; moderate rise in globalgross domestic product (+2.7%)– Weak growth in the industrialized countries (+1.8%)– Weak growth in the European Union (+1.1%); growth in theUnited States (+2.6%); moderate growth in Japan (+1.3%)– Clear positive economic growth in Asia (excluding Japan)(+7.0%) and in South America (+3.7%)– An average exchange rate of $1.40 per euro– An average annual oil price of $75 per barrel
<strong>BASF</strong> <strong>Report</strong> 2009Management’s <strong>Analysis</strong>Forecast Economic environment in 2010113The economy in Asia (excluding Japan) will experience stronggrowth again in 2010 (+7.0%). This recovery will be driven byenormous government demand in China and private demandin India. Foreign trade should also provide positive impetus forthe region. In the medium term, we expect strong annual growthin the regional gross domestic product (+7.1%). Constructionactivity and industrial production are growing especially fast.In Japan, growth in 2010 will be moderate (+1.3%). AlthoughJapanese businesses still seem reluctant to invest, domesticdemand and exports will begin to grow more strongly again.In the medium term, we expect solid average growth (+1.5%).In South America, growth in gross domestic product willbe clearly positive in 2010 (+3.7%). Thanks to solid domesticdemand and the global economic recovery, the region willbenefit from rising raw materials prices through foreign trade.In the medium term, we expect strong annual economic growth(+3.6%).Outlook for key customer industriesFollowing the sharp decline, global industrial production willexperience above-average growth in 2010 (+4.9%). While weexpect a moderate increase for industrialized countries, weforecast a significant rise in industrial production in Asia’semerging economies.Production in the automotive industry on a per-unit basiswill rise again worldwide, but will still not come close toreaching levels seen before the crisis. Despite structural problems,automotive production will increase significantly in theUnited States in 2010 while European production will continueto be weak.The construction industry will grow slightly worldwide in2010. However, despite support from state construction programs,it may shrink again slightly in some European countriesand in the United States due to weak private and commercialconstruction activity. The construction industry in these countrieswill only begin to grow again in subsequent years.The electrical industry will grow again worldwide. Following aglobal slump in 2009, production in the information and communicationtechnology industry (ICT) will be stimulated bythe return to increased industrial investment. We expect growthimpetus to come mainly from Asia (excluding Japan), whilegrowth will be weaker in Europe and Japan. We anticipate productionin the paper industry will increase worldwide, primarilyas a result of growth in emerging markets. The textilesindustry will also grow worldwide. We particularly expect relativelyhigh growth in emerging economies and developingcountries, where the majority of global production takes place.For the food industry and agriculture, we expect steady productiongrowth at a global level in the coming years.Outlook for the chemical industryAfter the sharp decline in 2008 and 2009, worldwide chemicalproduction (excluding pharmaceuticals) will recover. We expectabove-average growth in 2010 (+5.3%). We expect solid averagegrowth until <strong>2012</strong> (+4.6%). At a global level, we currentlyexpect that chemical production will require two years of growthto return to production levels seen before the crisis. In theindustrialized countries, severe declines in production as aresult of the global financial and economic crisis will havelonger-lasting effects.For Europe, we forecast solid growth for the chemicalindustry in 2010 (+2.8%), but it will be accompanied by a reductionin overcapacities. In the European Union, key customer industrieswill recover more slowly than, for example, in the UnitedStates and this will also impact the demand for chemical productsin the medium term. Chemical production will stabilize withmoderate growth from 2011 onward as a result of the improvementin general economic conditions and rising demand forexports (+2.1%). We expect that Europe will need the longestto reach the levels seen before the crisis.Outlook for key customer industries in 2010– Growth in global industrial production of +4.9%– Automotive industry: number of units to increase,without reaching the pre-crisis levels– Construction industry: slight growth worldwide;continued decline in some European countries andthe United States due to weak construction activity– Electrical industry: global growthICT: – upturn in production; growth impetus to comemainly from Asia (excluding Japan)Paper industry: rising production due to growth in–emerging economiesTextiles industry: global growth; strong growth dynamic–in emerging economies and developing countriesAgriculture and food industry: stable production growth–at a global level
114Management’s <strong>Analysis</strong> <strong>BASF</strong> <strong>Report</strong> 2009Forecast Economic environment in 2010In the United States, chemical production will experienceabove-average growth in 2010 against the backdrop of the recoveryin domestic demand (+4.8%). We expect a significantlylower rate of growth for 2011 (+2.5%). In the medium term, thechemical sector’s key customer industries will develop moredynamically in the United States than in other industrializedcountries, and they will drive growth for the chemical industryin subsequent years.Asia (excluding Japan) already saw a recovery in chemicalproduction in 2009. We also expect strong growth in the regionin 2010 (+9.3%), driven primarily by the Chinese chemicalindustry (+12.2%). Rising demand for exports will also cause productionin key customer industries within the region to rise again,which will stimulate the chemical industry there. In the mediumterm, we expect strong average growth (+8.7%).In Japan, the chemical industry is likely to undergo furtherstructural changes over the coming years. Following the drop inproduction resulting from the economic crisis, the chemicalindustry will grow at an above average rate (+5.7%) in 2010 dueto the rapid recovery of the domestic economy as well asdemand for exports. From 2011, production will stabilize, withsignificantly lower growth rates (+2.2%).Chemical production in South America will again grow significantlyin 2010 (+4.7%). The chemical industry will benefit fromthe recovering global economy and an upturn in the key localcustomer industries. In the medium term, we anticipate stabilizationof growth rates and solid average growth (+3.8%).Outlook chemical production 2010 (excl. pharmaceuticals)(Real change compared with previous year)World +5.3%E.U. +2.8%United States +4.8%Asia (excl. Japan) +9.3%Japan +5.7%South America +4.7%Trends chemical production 2010–<strong>2012</strong> (excl. pharmaceuticals)(Average annual real change)World +4.6%E.U. +2.3%United States +3.4%Asia (excl. Japan) +8.7%Japan +3.4%South America +3.8%Outlook for the chemical industry in 2010– Recovery of global chemical production;significant growth (+5.3%)– Europe: solid growth (+2.8%) and reduction in overcapacities;slower demand-driven recovery in theEuropean Union than, for example, in the United States– United States: above-average growth rate (+4.8%)thanks to recovery in domestic demandAsia (excluding Japan): strong growth– (+9.3%), driven byChinese chemical industry and rising demand for exportsJapan: substantial year-on-year growth– (+5.7%) dueto a recovery in the domestic economy and demandfor exportsSouth America: significant growth– (+4.7%), due in partto an upturn in local customer industries
<strong>BASF</strong> <strong>Report</strong> 2009ForecastManagement’s <strong>Analysis</strong><strong>BASF</strong> Group outlook and opportunities115<strong>BASF</strong> Group outlook and opportunitiesEmerging stronger from the crisis thanks to the right strategyFollowing a significant downturn in the first half of 2009,the global economy recovered slightly over the courseof the year. The same was true for the chemical industry,which stabilized from a low level. In 2010, we expect theeconomy to recover further, but the recovery is likelyto be slow and uneven. Risks are associated, for example,with ongoing overcapacities, the winding down ofnational stimulus programs and rising unemployment,especially in Europe.After a very difficult year in 2009, we expect highersales and a significant increase in earnings in 2010.Overall, we expect to earn a premium on our cost ofcapital again.OpportunitiesIn crisis year 2009, we proved that we have the right strategy:Thanks to our quick and decisive action, we reached our goalof achieving a minimum EBITDA margin of 14% in the most challengingenvironment and we would have earned a premium onour cost of capital without the special charges arising from theCiba integration.The year 2010 may present us with opportunities from amore rapid recovery and inventory restocking by our customerindustries. In the medium and long term, opportunities will alsoarise from our strong position in research and in the mostimportant growth industries and regions.Asia, and China in particular, is driving the further growthof the global economy. Through 2020, we expect the Asianchemical market to grow 4% to 5% annually. With our strongpresence in the region, we will take part in this positive development.We aim to grow on average two percentage pointsfaster than the chemical market, both worldwide and especiallyin Asia, and thus to double our sales in the Asia Pacific regionby 2020.With the acquisition of Ciba Holding AG in April 2009, we havesignificantly strengthened our position in many specialtiesmarkets, in particular in plastic additives, and we now lead themarket in many business sectors. We expect the integration andrestructuring of Ciba to result in synergies of more than €450 millionannually from the end of <strong>2012</strong> onward. We expect to achieverecurring savings of €350 million by the end of 2010.With the greater liberalization of the European natural gasmarket, imports of Russian gas will play an increasingly importantrole in the long term. Our successful cooperation with Gazprom,the world’s largest natural gas producer, ensures ourstrong position. In a consortium with Gazprom, our subsidiaryWintershall is involved in the planned construction of the NordStream pipeline from Russia through the Baltic Sea to the coastof Germany. Construction on the pipeline is scheduled to beginin the first half of 2010. By providing an additional transport routeto Europe, the Nord Stream project will improve the long-termsupply security for natural gas.We have a number of innovative products and systemsolutions to address megatrends such as rising demand forenergy, increasing globalization and urbanization, climate protectionand the growing world population. <strong>BASF</strong>’s corporateresearch is a strategic tool we use to develop growth clustersand secure <strong>BASF</strong>’s long-term competence with regard to technologyand methods. Our growth clusters are therefore focusedon the markets and technologies of the future. In 2010, weexpect to generate sales of up to €6 billion with product innovations– new and improved products and applications that havebeen on the market for a maximum of five years. In 2015, weexpect sales of between €6 billion and €8 billion from productinnovations.Under the NEXT program that we initiated in 2008, weare further strengthening our operational excellence througha number of individual projects. With this program, we expectto improve earnings by more than €1 billion annually by <strong>2012</strong>.A large proportion of this amount will be achieved in 2010and 2011.Outlook 2010The stabilization of the global economy, which started in the second half of 2009, is expected to continue in 2010.However, economic recovery in 2010 will likely be slow and uneven. After a very difficult year in 2009, we expect highersales in 2010 and a significant increase in income from operations. These expectations are based on the change in theeconomic environment, further cost savings, and cost synergies from the integration of Ciba. In 2010, we expect to earna premium on our cost of capital again.
116Management’s <strong>Analysis</strong> <strong>BASF</strong> <strong>Report</strong> 2009Forecast<strong>BASF</strong> Group outlook and opportunitiesRisksRisks are associated with:– the continuing financial and debt crisis,– the winding down of national stimulus programs,– volatile raw materials markets,– industrial overcapacities,– increasing unemployment in some regions,– growing geopolitical tensions, and– protectionism.However, based on currently available information, there are nosubstantial individual risks at the present time or in the foreseeablefuture that endanger the continued existence of the <strong>BASF</strong>Group. The total sum of individual risks also does not pose athreat to the continued existence of the <strong>BASF</strong> Group.For more information, see the Risk report on pages 103 – 111ForecastFollowing a severe recession, the world economy stabilized inthe second half of 2009. In 2010, we anticipate a slow and uneveneconomic recovery. Worldwide, both general industrial productionand chemical production will grow. Nevertheless, risksremain, for example, significant overcapacities in the chemicalindustry. The rise in industrial production will be more pronouncedin emerging economies than in industrialized countries.We expect a significant increase in income from operations,mainly due to increasing volumes and cost synergies from theCiba integration. Furthermore, costs related to the integrationof Ciba will be considerably lower in 2010 than they were in2009. In 2010, we expect to earn a premium on our cost ofcapital again.For more on the outlook for sales and earnings in the individualsegments and divisions, see the chapter <strong>BASF</strong>’s Segments frompage 47 onward.Assuming that the global economy continues to recover oncenational stimulus programs have expired, we expect <strong>BASF</strong>’ssales, income from operations and the premium on our cost ofcapital to grow further in 2011.DividendEven in very difficult economic times, we aim to offer our shareholdersan attractive dividend yield. We aim to increase ourdividend each year, or at least maintain it at the previousyear’s level.Significant events subsequent to thebalance sheet dateSince the beginning of the financial year 2010, there have notbeen any significant changes affecting <strong>BASF</strong>’s situation andcompetitive environment.For more on the forecast for the economic environment in 2010,see pages 112 – 114Based on our forecast for the economic environment, weexpect our sales to grow again in 2010 and outpace globalchemical production. We expect improved capacity utilization,a relatively stable U.S. dollar, and oil prices around the level seenat the end of 2009. As the economic situation is still weak, wewill maintain our cost discipline and will continue to adjust ourinvestment plans to the current market conditions. We will continueto rigorously implement our efficiency and restructuringprograms.Planned capital expenditures by segment 2010 – 2014Planned capital expenditures by region 2010 – 20141 Chemicals 13%2 Plastics 14%711 Europe 68%2 North America 13%34 53 Performance Products 10%4 Functional Solutions 7%5 Agricultural Solutions 5%6 Oil & Gas 42%7 Other (infrastructure, R&D) 9%6€11.8billion54323 Asia Pacific 14%45South America, Africa,Middle East 2%Alternative sitesunder review 3%2€11.8billion1