New Thinking in Response to Intervention - Renaissance Learning
New Thinking in Response to Intervention - Renaissance Learning
New Thinking in Response to Intervention - Renaissance Learning

Create successful ePaper yourself
Turn your PDF publications into a flip-book with our unique Google optimized e-Paper software.
Screen<strong>in</strong>g with CAT<br />
STAR Early Literacy (STAR-EL), STAR Read<strong>in</strong>g (STAR-R), and STAR Math (STAR-M) by <strong>Renaissance</strong> Learn<strong>in</strong>g<br />
are a suite of CAT measures that meet the requirements of RTI. STAR generates screen<strong>in</strong>g reports <strong>to</strong> assist<br />
data teams <strong>in</strong> determ<strong>in</strong><strong>in</strong>g which students appear <strong>to</strong> be on track and off track <strong>to</strong>ward grade-level goals.<br />
STAR’s Screen<strong>in</strong>g report can be run with standard RTI categories (benchmark, on watch, <strong>in</strong>tervention, and<br />
urgent <strong>in</strong>tervention) or a state’s AYP categories. Both represent important po<strong>in</strong>ts <strong>in</strong> the distribution that are<br />
predictive of future success or failure.<br />
The STAR Screen<strong>in</strong>g Reports <strong>in</strong> STAR-EL, STAR-R, and STAR-M provide educa<strong>to</strong>rs with clear <strong>in</strong>formation<br />
about the stand<strong>in</strong>g of any s<strong>in</strong>gle student relative <strong>to</strong> his/her peers. The reports also provide a list<strong>in</strong>g of the<br />
specific students <strong>in</strong> the grade who fall <strong>in</strong><strong>to</strong> each category, mak<strong>in</strong>g decisions from the data useful for group<strong>in</strong>g<br />
students dur<strong>in</strong>g data team meet<strong>in</strong>gs. These data are the basis upon which teams <strong>in</strong> an RTI model identify<br />
students <strong>in</strong> need of <strong>in</strong>tervention.<br />
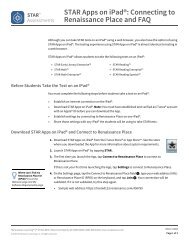
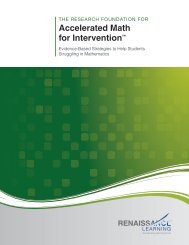
STAR Screen<strong>in</strong>g Reports can also be used <strong>to</strong> exam<strong>in</strong>e changes over time <strong>in</strong> grade-level performance. For<br />
example, Figure 2 shows the outcomes of a fall and w<strong>in</strong>ter STAR Read<strong>in</strong>g benchmark assessment of grade<br />
5. In Scenario A, there is an <strong>in</strong>crease of students mov<strong>in</strong>g <strong>in</strong><strong>to</strong> the benchmark area (green) and a reduction<br />
<strong>in</strong> those at the highest level of risk (red). Scenario B shows the opposite outcome with overall scores mov<strong>in</strong>g<br />
<strong>in</strong> the opposite direction of what would be desired. This type of report gives educa<strong>to</strong>rs <strong>in</strong>sight <strong>in</strong><strong>to</strong> the<br />
effectiveness of <strong>in</strong>tervention and also the effectiveness of Tier 1 core <strong>in</strong>struction.<br />
Fall<br />
1 of 7<br />
Screen<strong>in</strong>g Report<br />
District Benchmark<br />
Pr<strong>in</strong>ted Friday, January 13, 2012 4:13:04 PM<br />
School: Lake View School Report<strong>in</strong>g Period: 1/09/2012-1/13/2012<br />
(W<strong>in</strong>ter Screen<strong>in</strong>g)<br />
Grade: 5<br />
950<br />
900<br />
850<br />
800<br />
750<br />
700<br />
650<br />
600<br />
550<br />
500<br />
450<br />
STAR Read<strong>in</strong>g Scaled Score<br />
W<strong>in</strong>ter<br />
400<br />
350<br />
300<br />
250<br />
200<br />
Students<br />
Benchmark<br />
Students<br />
Categories / Levels<br />
Scaled Score Percentile Rank Number Percent<br />
At/Above Benchmark<br />
At/Above Benchmark<br />
At/Above 520 SS At/Above 40 PR<br />
146 69%<br />
Category Total<br />
146 69%<br />
Below Benchmark<br />
On Watch<br />
Below 520 SS Below 40 PR<br />
25 12%<br />
<strong>Intervention</strong><br />
Below 452 SS Below 25 PR<br />
36 17%<br />
Urgent <strong>Intervention</strong><br />
Below 356 SS Below 10 PR<br />
4 2%<br />
Category Total<br />
65 31%<br />
Students Tested<br />
211<br />
1 of 7<br />
Screen<strong>in</strong>g Report<br />
District Benchmark<br />
Pr<strong>in</strong>ted Friday, September 23, 2011 4:13:04 PM<br />
School: Lake View School Report<strong>in</strong>g Period: 9/19/2011-9/23/2011<br />
(Fall Screen<strong>in</strong>g)<br />
Grade: 5<br />
850<br />
800<br />
750<br />
700<br />
650<br />
600<br />
550<br />
500<br />
450<br />
400<br />
STAR Read<strong>in</strong>g Scaled Score<br />
350<br />
300<br />
250<br />
200<br />
Students<br />
Benchmark<br />
Students<br />
Categories / Levels<br />
Scaled Score Percentile Rank Number Percent<br />
At/Above Benchmark<br />
At/Above Benchmark<br />
At/Above 479 SS At/Above 40 PR<br />
125 59%<br />
Category Total<br />
125 59%<br />
Below Benchmark<br />
On Watch<br />
Below 479 SS Below 40 PR<br />
36 17%<br />
<strong>Intervention</strong><br />
Below 414 SS Below 25 PR<br />
41 19%<br />
Urgent <strong>Intervention</strong><br />
Below 326 SS Below 10 PR<br />
9 4%<br />
Category Total<br />
86 41%<br />
Students Tested<br />
211<br />
Key questions <strong>to</strong> ask based on this and other <strong>in</strong>formation: Are you satisfied with the number of students at the highest<br />
level of performance Next, consider the level or score that <strong>in</strong>dicates proficiency. Which students just above proficiency are<br />
you "worried about" and what support with<strong>in</strong> or beyond core <strong>in</strong>struction is warranted What support is needed for students<br />
just below Do all students represented by your lowest level need urgent <strong>in</strong>tervention<br />
1 of 7<br />
Screen<strong>in</strong>g Report<br />
District Benchmark<br />
Pr<strong>in</strong>ted Friday, January 13, 2012 4:13:04 PM<br />
School: Lake View School Report<strong>in</strong>g Period: 1/09/2012-1/13/2012<br />
(W<strong>in</strong>ter Screen<strong>in</strong>g)<br />
Grade: 5<br />
950<br />
900<br />
850<br />
800<br />
750<br />
700<br />
650<br />
600<br />
550<br />
500<br />
450<br />
STAR Read<strong>in</strong>g Scaled Score<br />
W<strong>in</strong>ter<br />
400<br />
350<br />
300<br />
250<br />
200<br />
Students<br />
Benchmark<br />
Students<br />
Categories / Levels<br />
Scaled Score Percentile Rank Number Percent<br />
At/Above Benchmark<br />
At/Above Benchmark<br />
At/Above 520 SS At/Above 40 PR<br />
85 40%<br />
Category Total<br />
85 40%<br />
Below Benchmark<br />
On Watch<br />
Below 520 SS Below 40 PR<br />
70 33%<br />
<strong>Intervention</strong><br />
Below 452 SS Below 25 PR<br />
47 22%<br />
Urgent <strong>Intervention</strong><br />
Below 356 SS Below 10 PR<br />
9 4%<br />
Category Total<br />
126 60%<br />
Students Tested<br />
211<br />
Key questions <strong>to</strong> ask based on this and other <strong>in</strong>formation: Are you satisfied with the number of students at the highest<br />
level of performance Next, consider the level or score that <strong>in</strong>dicates proficiency. Which students just above proficiency are<br />
you "worried about" and what support with<strong>in</strong> or beyond core <strong>in</strong>struction is warranted What support is needed for students<br />
just below Do all students represented by your lowest level need urgent <strong>in</strong>tervention<br />
Scenario A<br />
This report shows a positive w<strong>in</strong>ter scenario.<br />
Some students have moved out of <strong>in</strong>tervention<br />
and <strong>in</strong><strong>to</strong> above benchmark between the fall<br />
and w<strong>in</strong>ter screen<strong>in</strong>g periods.<br />
Key questions <strong>to</strong> ask based on this and other <strong>in</strong>formation: Are you satisfied with the number of students at the highest<br />
level of performance Next, consider the level or score that <strong>in</strong>dicates proficiency. Which students just above proficiency are<br />
you "worried about" and what support with<strong>in</strong> or beyond core <strong>in</strong>struction is warranted What support is needed for students<br />
just below Do all students represented by your lowest level need urgent <strong>in</strong>tervention<br />
Scenario B<br />
This report shows a negative w<strong>in</strong>ter<br />
scenario. Fewer students are at<br />
benchmark and the ‘on watch’ category<br />
has expanded.<br />
Figure 2. Screen<strong>in</strong>g Reports for STAR Read<strong>in</strong>g <strong>in</strong> fall and w<strong>in</strong>ter, compar<strong>in</strong>g positive and negative scenarios.<br />
12