Carbon-Based Supercapacitors Produced by Activation of Graphene ...
Carbon-Based Supercapacitors Produced by Activation of Graphene ...
Carbon-Based Supercapacitors Produced by Activation of Graphene ...

You also want an ePaper? Increase the reach of your titles
YUMPU automatically turns print PDFs into web optimized ePapers that Google loves.
REPORTS<br />
<strong>Carbon</strong>-<strong>Based</strong> <strong>Supercapacitors</strong><br />
<strong>Produced</strong> <strong>by</strong> <strong>Activation</strong> <strong>of</strong> <strong>Graphene</strong><br />
Yanwu Zhu, 1 Shanthi Murali, 1 Meryl D. Stoller, 1 K. J. Ganesh, 1 Weiwei Cai, 1 Paulo J. Ferreira, 1<br />
Adam Pirkle, 2 Robert M. Wallace, 2 Katie A. Cychosz, 3 Matthias Thommes, 3 Dong Su, 4<br />
Eric A. Stach, 4 Rodney S. Ru<strong>of</strong>f 1 *<br />
<strong>Supercapacitors</strong>, also called ultracapacitors or electrochemical capacitors, store electrical charge on<br />
high-surface-area conducting materials. Their widespread use is limited <strong>by</strong> their low energy storage<br />
density and relatively high effective series resistance. Using chemical activation <strong>of</strong> exfoliated<br />
graphite oxide, we synthesized a porous carbon with a Brunauer-Emmett-Teller surface area <strong>of</strong> up<br />
to 3100 square meters per gram, a high electrical conductivity, and a low oxygen and hydrogen<br />
content. This sp 2 -bonded carbon has a continuous three-dimensional network <strong>of</strong> highly curved,<br />
atom-thick walls that form primarily 0.6- to 5-nanometer-width pores. Two-electrode<br />
supercapacitor cells constructed with this carbon yielded high values <strong>of</strong> gravimetric capacitance<br />
and energy density with organic and ionic liquid electrolytes. The processes used to make this<br />
carbon are readily scalable to industrial levels.<br />
<strong>Supercapacitors</strong> store energy <strong>by</strong> forming a<br />
double layer <strong>of</strong> electrolyte ions on the surface<br />
<strong>of</strong> conductive electrodes. <strong>Supercapacitors</strong><br />
are not limited <strong>by</strong> the electrochemical<br />
charge transfer kinetics <strong>of</strong> batteries and thus can<br />
operate at very high charge and discharge rates<br />
and can have lifetimes <strong>of</strong> over a million cycles<br />
(1). However, the energy stored in supercapacitors<br />
is currently an order <strong>of</strong> magnitude lower than<br />
that <strong>of</strong> batteries, which limits their adoption to<br />
those applications that require high cycle life<br />
and power density. The energy density <strong>of</strong> existing<br />
state-<strong>of</strong>-the-art supercapacitor devices, which<br />
are mainly based on porous activated carbon (AC),<br />
is about 4 to 5 watt-hour (Wh)/kg, whereas that<br />
<strong>of</strong> lead acid batteries is in the range <strong>of</strong> 26 to<br />
34 Wh/kg (2). A typical AC material, with a<br />
Brunauer-Emmett-Teller (BET) specific surface<br />
area (SSA) in the range <strong>of</strong> 1000 to 2000 m 2 /g and<br />
a pore size distribution in the range <strong>of</strong> 2 to 5 nm,<br />
has a gravimetric capacitance <strong>of</strong> 100 to 120 F/g in<br />
organic electrolytes (3). Research has thus been<br />
focused on increasing energy density without sacrificing<br />
cycle life or high power density (4). An<br />
increased capacitance in the organic electrolyte<br />
tetraethylammonium tetrafluoroborate (TEA BF 4 )<br />
in acetonitrile (AN) <strong>by</strong> using carbide-derived carbons<br />
(CDCs) has been reported (5). Metal oxides<br />
such as RuO 2 or MnO 2 (6), MoO 3 (7), and<br />
electronically conducting polymers (8), or their<br />
composites, have been used to increase specific<br />
1 Department <strong>of</strong> Mechanical Engineering and Materials<br />
Science and Engineering Program, University <strong>of</strong> Texas at<br />
Austin, One University Station C2200, Austin, TX 78712, USA.<br />
2 Department <strong>of</strong> Materials Science and Engineering, University<br />
<strong>of</strong> Texas at Dallas, 800 West Campbell Road, Richardson, TX<br />
75080, USA. 3 Quantachrome Instruments, 1900 Corporate<br />
Drive, Boynton Beach, FL 33426, USA. 4 Center for Functional<br />
Nanomaterials, Brookhaven National Laboratory, Upton, NY<br />
11973, USA.<br />
*To whom correspondence should be addressed. E-mail:<br />
r.ru<strong>of</strong>f@mail.utexas.edu<br />
capacitance via pseudo-capacitive redox reactions.<br />
Although capacitances <strong>of</strong> up to 1300 F/g (such as<br />
with MnO 2 ) have been reported in aqueous electrolytes<br />
(9), the low electrical conductance, poor<br />
compatibility with organic electrolytes, and short<br />
cycle life have limited the practical application<br />
<strong>of</strong> these pseudo-capacitive materials. <strong>Carbon</strong><br />
nanotubes (CNTs), especially single-walled CNTs<br />
(SWNTs), have an ideal limit SSA <strong>of</strong> 1300 m 2 /g<br />
(10), can have high electrical conductance along<br />
the tubes, and demonstrate good performance in<br />
organic electrolyte (11). However, the high cost<br />
for mass production <strong>of</strong> high-quality SWNTs is a<br />
challenge for the commercialization <strong>of</strong> SWNTbased<br />
supercapacitors.<br />
<strong>Graphene</strong> has a theoretical SSA <strong>of</strong> 2630 m 2 /g<br />
and a very high intrinsic electrical conductivity in<br />
plane as well as high mechanical strength and<br />
chemical stability (12). <strong>Graphene</strong>-based material<br />
derived from graphite oxide (GO) is now being<br />
manufactured in ton quantities at low cost (13).<br />
We have previously demonstrated supercapacitors<br />
that were based on reduced graphene oxide<br />
with capacitance values <strong>of</strong> approximately 130 and<br />
100 F/g in aqueous KOH and organic electrolytes,<br />
respectively (14). With a low equivalent<br />
series resistance (ESR), the supercapacitor performance<br />
did not show much degradation with<br />
an increase in the scan rate. Various graphenebased<br />
materials derived from GO have reported<br />
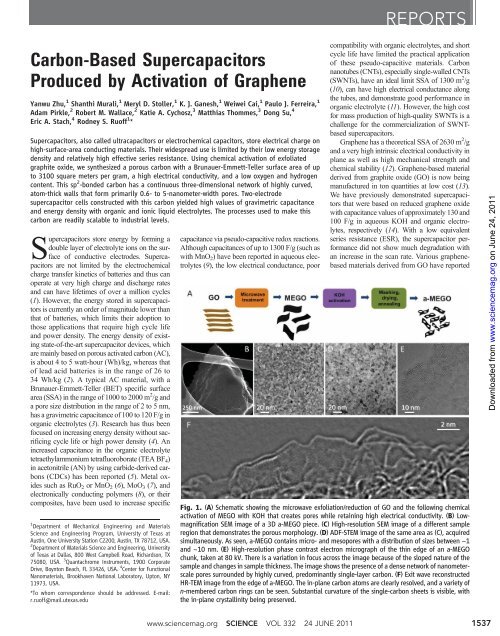
Fig. 1. (A) Schematic showing the microwave exfoliation/reduction <strong>of</strong> GO and the following chemical<br />
activation <strong>of</strong> MEGO with KOH that creates pores while retaining high electrical conductivity. (B) Lowmagnification<br />
SEM image <strong>of</strong> a 3D a-MEGO piece. (C) High-resolution SEM image <strong>of</strong> a different sample<br />
region that demonstrates the porous morphology. (D) ADF-STEM image <strong>of</strong> the same area as (C), acquired<br />
simultaneously. As seen, a-MEGO contains micro- and mesopores with a distribution <strong>of</strong> sizes between ~1<br />
and ~10 nm. (E) High-resolution phase contrast electron micrograph <strong>of</strong> the thin edge <strong>of</strong> an a-MEGO<br />
chunk, taken at 80 kV. There is a variation in focus across the image because <strong>of</strong> the sloped nature <strong>of</strong> the<br />
sample and changes in sample thickness. The image shows the presence <strong>of</strong> a dense network <strong>of</strong> nanometerscale<br />
pores surrounded <strong>by</strong> highly curved, predominantly single-layer carbon. (F)Exitwavereconstructed<br />
HR-TEM image from the edge <strong>of</strong> a-MEGO. The in-plane carbon atoms are clearly resolved, and a variety <strong>of</strong><br />
n-membered carbon rings can be seen. Substantial curvature <strong>of</strong> the single-carbon sheets is visible, with<br />
the in-plane crystallinity being preserved.<br />
Downloaded from www.sciencemag.org on June 24, 2011<br />
www.sciencemag.org SCIENCE VOL 332 24 JUNE 2011 1537
REPORTS<br />
high-end capacitance values <strong>of</strong> ~200 F/g in aqueous<br />
electrolytes (15, 16),~120F/ginorganicelectrolytes<br />
(16, 17),and~75F/ginanionicliquid<br />
(18). Recently, supercapacitors using oriented<br />
graphene grown on nickel <strong>by</strong> means <strong>of</strong> chemical<br />
vapor deposition were reported (19) that demonstrated<br />
efficient filtering <strong>of</strong> 120 Hz current with a<br />
resistance capacitance (RC) time constant <strong>of</strong> less<br />
than 0.2 ms, but at the cost <strong>of</strong> effective energy<br />
storage because <strong>of</strong> the very low density <strong>of</strong> the<br />
electrode material.<br />
To date, the reported SSA values <strong>of</strong> carbon<br />
materials derived from GO have been well below<br />
2630 m 2 /g. Here, we report a simple activation<br />
with KOH <strong>of</strong> microwave exfoliated GO (MEGO)<br />
and thermally exfoliated GO (TEGO) to achieve<br />
SSA values up to 3100 m 2 /g. As described in<br />
(20), we prepared MEGO powders <strong>by</strong> irradiating<br />
GO in a microwave oven. The as-made MEGO<br />
powder was then placed in KOH solution, followed<br />
<strong>by</strong> filtration and drying, to form a series <strong>of</strong><br />
MEGO/KOH mixtures for chemical activation.<br />
Each MEGO/KOH mixture was put in a tube<br />
furnace under flowing argon at a pressure <strong>of</strong> about<br />
400 torr and heated at 800°C for 1 hour. A schematic<br />
<strong>of</strong> this activation process is shown in Fig.<br />
1A. Chemical activation has been extensively<br />
used to obtain porous ACs (21). KOH activation<br />
has been used on CNTs (22), carbon nan<strong>of</strong>ibers<br />
(23), and polyacrylonitrile-carbon nanotube composites<br />
(24), and improved porosity and enhanced<br />
supercapacitor performance were reported. It is<br />
suggested that the activation <strong>of</strong> carbon with KOH<br />
(25) proceeds as 6KOH + C ↔ 2K + 3H 2 +<br />
2K 2 CO 3 , followed <strong>by</strong> decomposition <strong>of</strong> K 2 CO 3<br />
and/or reaction <strong>of</strong> K/K 2 CO 3 /CO 2 with carbon.<br />
The activation with KOH generated nanoscale<br />
pores in the product carbon. The SSA <strong>of</strong> the<br />
activated MEGO (a-MEGO) could be readily<br />
controlled <strong>by</strong> the ratio <strong>of</strong> KOH versus MEGO (fig.<br />
S1). The scanning electron microscopy (SEM) image<br />
in Fig. 1B shows the morphology <strong>of</strong> a typical<br />
a-MEGO piece. Figure 1 shows high-resolution<br />
SEM (Fig. 1C), annular dark field scanning transmission<br />
electron microscopy (ADF-STEM) (Fig.<br />
1D), and high-resolution TEM (HR-TEM) (Fig.<br />
1, E and F) images <strong>of</strong> the microstructure. These<br />
images [and additional images (fig. S2 and movie<br />
S1)] clearly indicate that the activation process<br />
etches the MEGO and has generated a threedimensional<br />
(3D) distribution <strong>of</strong> what are referred<br />
to as meso- and micropores in the porous materials<br />
literature. The activation with KOH yields<br />
a continuous 3D network <strong>of</strong> pores <strong>of</strong> extremely<br />
smallsize,rangingfrom~1nmto~10nm.Thus,it<br />
appears that the chemical activation is not merely<br />
digesting the MEGO but also dramatically restructuring<br />
it. (The 3D nature <strong>of</strong> these very small<br />
pores makes a statistically accurate quantitative<br />
analysis with EM <strong>of</strong> the distribution <strong>of</strong> pore sizes<br />
difficult because not all pores are visible in a<br />
given image.) The spherical aberration–corrected<br />
HR-TEM image presented as Fig. 1E (taken at<br />
80 kV so as to prevent electron beam damage)<br />
further corroborates a dense pore structure with a<br />
continuous three-dimensional network <strong>of</strong> highly<br />
curved, predominantly atom-thick walls. An exitwave<br />
reconstructed image (Fig. 1F) taken with<br />
the Transmission Electron Aberration-Corrected<br />
Microscope (TEAM) instrument (spherical and<br />
chromatic aberration correction, at 80 kV) clearly<br />
resolves the individual carbon atoms in the<br />
structure. This image shows that a-MEGO is<br />
composed <strong>of</strong> n-membered rings in plane, with n<br />
varying between 5 and 8. Additionally, it is clear<br />
that even as the walls bend through high degrees<br />
<strong>of</strong> curvature the in-plane crystallinity is<br />
preserved.<br />
Electron paramagnetic resonance (EPR) data<br />
(fig. S3) indicate an unpaired spin count at the<br />
parts-per-million level. This—in hand with the<br />
very low H and O content in the a-MEGO indicated<br />
<strong>by</strong> elemental analysis—shows that a-MEGO<br />
has a small fraction <strong>of</strong> edge atoms. (If a large<br />
fraction <strong>of</strong> the C were edge atoms, they would<br />
either be functionalized or would be present as<br />
“dangling bonds” that would register an EPR<br />
signal.)<br />
Characterization <strong>of</strong> a sample <strong>of</strong> a-MEGO <strong>by</strong><br />
means <strong>of</strong> synchrotron powder x-ray diffraction<br />
(XRD) and x-ray photoelectron spectroscopy<br />
(XPS) is shown in Fig. 2, A and B. Comparison<br />
with MEGO indicates that the (002) peak<br />
<strong>of</strong> a-MEGO has a markedly reduced intensity<br />
and is dramatically broadened. These results are<br />
consistent with the observations from HR-TEM,<br />
which indicate that a-MEGO is composed <strong>of</strong> predominantly<br />
single-carbon sheets: Thus, a strong<br />
decrease in the (002) peak would be expected.<br />
A large increase in the low-angle scatter from<br />
a-MEGO versus MEGO is also noted, which is<br />
consistent with the presence <strong>of</strong> a high density <strong>of</strong><br />
pores. In the XPS C1s spectrum <strong>of</strong> MEGO shown<br />
in Fig. 2B, the tail between 286 and 290 eV is due<br />
to C-O groups and energy loss “shake-up” features<br />
(26). These oxygen-containing groups were<br />
strongly suppressed after activation, with two new<br />
peaks appearing between 292 and 296 eV in the<br />
a-MEGO sample that were assigned as K2p peaks.<br />
The K2p peaks (
REPORTS<br />
coupling high-resolution nitrogen (77.4 K) and<br />
argon (87.3 K) adsorption/desorption experiments<br />
with advanced methods based on density<br />
functional theory (DFT) (28). In addition, CO 2<br />
adsorption at 273.2 K has been performed to assess<br />
the ultramicropores (pores <strong>of</strong> width
REPORTS<br />
for large-scale AC-based supercapacitors—a<br />
practical energy density <strong>of</strong> above 20 Wh/kg for<br />
a packaged device is expected. This is four times<br />
higher than existing AC-based supercapacitors,<br />
two times higher than that reported for carbonoxide<br />
hybrid electrochemical devices (2), and<br />
nearly equal to the energy density <strong>of</strong> lead acid batteries.<br />
At the same current density (5.7 A/g), the<br />
power density is also very high at ~250 kW/kg,<br />
as estimated <strong>by</strong> using the voltage drop and ESR<br />
obtained from the discharge curve. For a packaged<br />
cell, the power density <strong>of</strong> ~75 kW/kg is one<br />
order higher than the values from commercial<br />
carbon supercapacitors that have energy density<br />
values <strong>of</strong> 4 to 5 Wh/kg (2). This material is<br />
also very stable. After 10,000 constant current<br />
charge/discharge cycles at a current density <strong>of</strong><br />
2.5 A/g in neat BMIM BF 4 electrolyte (fig. S9),<br />
97% <strong>of</strong> its capacitance was retained. We reasoned<br />
that this carbon might perform even better with<br />
smaller-diameter ions (35). With neat ethyl-methylimidazolium<br />
bis(trifluormethylsulfonyl)imide<br />
(EMIM TFSI) as electrolyte (fig. S10), the measured<br />
gravimetric capacitance <strong>of</strong> a-MEGO (SSA ~<br />
3100 m 2 /g) at 3.5 V and a current density <strong>of</strong><br />
0.7 A/g is 200 F/g, with an ESR <strong>of</strong> 8.6 ohms.<br />
However, the curves in fig. S10 are not as ideal as<br />
those from a-MEGO in either BMIM BF 4 /AN<br />
or TEA BF 4 /AN electrolyte. Other carbons (such<br />
as CDCs) using the EMIM TSFI electrolyte have<br />
been reported with comparable performance values,<br />
although the measurements were performed<br />
at an elevated temperature (60°C) (36).<br />
The high powder conductivity <strong>of</strong> ~500 S/m, a<br />
C/O atomic ratio <strong>of</strong> up to ~35, the very low H content,<br />
and the essential absence <strong>of</strong> dangling bonds<br />
in the a-MEGO suggest that it has a high content<br />
<strong>of</strong> sp 2 -bonded carbon and very few edge atoms<br />
for the samples with SSA <strong>of</strong> above 2500 m 2 /g.<br />
This along with the SEM, TEM, STEM, EELS,<br />
EPR, XPS, XRD, and adsorption isotherm data<br />
thus support a highly porous carbon comprised<br />
almost entirely <strong>of</strong> single sheets <strong>of</strong> sp 2 -bonded<br />
carbon. This suggests that a large fraction <strong>of</strong><br />
“negative curvature carbon” (37–39) could be<br />
present.<br />
The excellent performance obtained for various<br />
electrolytes opens the possibility to engineer<br />
supercapacitor electrodes based on this form <strong>of</strong><br />
carbon in order to target a wide range <strong>of</strong> applications,<br />
such as high energy, high power, or low<br />
cost. Unlike other carbon materials, no special<br />
substrates or transfer procedures are required for<br />
synthesis. For supercapacitor manufacturing, this<br />
material can be treated the same as current commercial<br />
ACs. Electrodes used for testing were <strong>of</strong><br />
the same thickness used in commercial cells, and<br />
testing was performed using commercial collectors,<br />
separators, binders, and electrolytes. As previously<br />
stated, the processes used to synthesize<br />
this carbon electrode material are readily scalable<br />
to industrial levels. For example, we have<br />
demonstrated that this simple activation process<br />
Downloaded from www.sciencemag.org on June 24, 2011<br />
Fig. 4. Supercapacitor performance <strong>of</strong> a-MEGO (SSA ~ 2400 m 2 /g) in the<br />
BMIM BF 4 /AN electrolyte. (A) CV curves for different scan rates. Rectangular<br />
shapes indicate the capacitive behavior. (B) Galvanostatic charge/discharge<br />
curves <strong>of</strong> a-MEGO–based supercapacitor under different constant currents.<br />
(C) Nyquist plot, showing the imaginary part versus the real part <strong>of</strong> impedance.<br />
(Inset) The data at high-frequency ranges, with frequency values<br />
corresponding to the transition <strong>of</strong> the curves marked. (D) Frequency response<br />
<strong>of</strong> the gravimetric capacitance <strong>of</strong> the a-MEGO supercapacitor. Capacitances<br />
<strong>of</strong> 35 and ~8.8 mF remain at the frequencies <strong>of</strong> 10 and 100 Hz,<br />
respectively.<br />
1540<br />
24 JUNE 2011 VOL 332 SCIENCE www.sciencemag.org
REPORTS<br />
also can be applied to TEGO (figs. S11 and S12),<br />
which is already being manufactured in ton quantities<br />
(13). By use <strong>of</strong> this type <strong>of</strong> simple activation<br />
process already commercially demonstrated for<br />
ACs, scaled a-MEGO and a-TEGO production<br />
for advanced energy/power electrochemical electrical<br />
energy storage devices may be realized in a<br />
short period.<br />
References and Notes<br />
1. J. R. Miller, P. Simon, Science 321, 651 (2008).<br />
2. A. Burke, Electrochim. Acta 53, 1083 (2007).<br />
3. J. A. Fernandez et al., J. Power Sources 175, 675<br />
(2008).<br />
4. P. Simon, Y. Gogotsi, Nat. Mater. 7, 845 (2008).<br />
5. J. Chmiola et al., Science 313, 1760 (2006).<br />
6. N. L. Wu, Mater. Chem. Phys. 75, 6 (2002).<br />
7. T. Brezesinski, J. Wang, S. H. Tolbert, B. Dunn,<br />
Nat. Mater. 9, 146 (2010).<br />
8. A. Rudge, J. Davey, I. Raistrick, S. Gottesfeld,<br />
J. P. Ferraris, J. Power Sources 47, 89 (1994).<br />
9. M. Toupin, T. Brousse, D. Belanger, Chem. Mater. 16,<br />
3184 (2004).<br />
10. A. Izadi-Najafabadi et al., Adv. Mater. 22, E235 (2010).<br />
11. D. N. Futaba et al., Nat. Mater. 5, 987 (2006).<br />
12. Y. Zhu et al., Adv. Mater. 22, 3906 (2010).<br />
13. M. Segal, Nat. Nanotechnol. 4, 612 (2009).<br />
14. M. D. Stoller, S. J. Park, Y. W. Zhu, J. H. An, R. S. Ru<strong>of</strong>f,<br />
Nano Lett. 8, 3498 (2008).<br />
15. Y. Wang et al., J. Phys. Chem. C 113, 13103 (2009).<br />
16. W. Lv et al., ACS Nano 3, 3730 (2009).<br />
17. Y. Zhu et al., ACS Nano 4, 1227 (2010).<br />
18. S. R. C. Vivekchand, C. S. Rout, K. S. Subrahmanyam,<br />
A. Govindaraj, C. N. R. Rao, J. Chem. Sci. 120, 9(2008).<br />
19. J. R. Miller, R. A. Outlaw, B. C. Holloway, Science 329,<br />
1637 (2010).<br />
20. Y. Zhu et al., <strong>Carbon</strong> 48, 2118 (2010).<br />
21. H. Marsh, F. Rodriguez-Reinoso, Activated <strong>Carbon</strong>.<br />
(Elsevier, London, 2006).<br />
22. E. Raymundo-Pinero et al., <strong>Carbon</strong> 43, 786 (2005).<br />
23. V. Barranco et al., J. Phys. Chem. C 114, 10302 (2010).<br />
24. T. Liu, T. V. Sreekumar, S. Kumar, R. H. Hauge,<br />
R. E. Smalley, <strong>Carbon</strong> 41, 2440 (2003).<br />
25. M. A. Lillo-Rodenas, D. Cazorla-Amoros, A. Linares-Solano,<br />
<strong>Carbon</strong> 41, 267 (2003).<br />
26. J. A. Leiro, M. H. Heinonen, T. Laiho, I. G. Batirev,<br />
J. Electron Spectrosc. Relat. Phenom. 128, 205 (2003).<br />
27. S. D. Berger, D. R. McKenzie, P. J. Martin, Philos. Mag.<br />
Lett. 57, 285 (1988).<br />
28. P. I. Ravikovitch, A. Vishnyakov, R. Russo, A. V. Neimark,<br />
Langmuir 16, 2311 (2000).<br />
29. K. S. W. Sing et al., Pure Appl. Chem. 57, 603 (1985).<br />
30. J. C. Groen, L. A. A. Peffer, J. Perez-Ramirez, Microporous<br />
Mesoporous Mater. 60, 1 (2003).<br />
31. A. V. Neimark, Y. Lin, P. I. Ravikovitch, M. Thommes,<br />
<strong>Carbon</strong> 47, 1617 (2009).<br />
32. M. D. Stoller, R. S. Ru<strong>of</strong>f, Energy Environ. Sci. 3, 1294<br />
(2010).<br />
33. P. L. Taberna, P. Simon, J. F. Fauvarque, J. Electrochem.<br />
Soc. 150, A292 (2003).<br />
34. C. Portet, M. A. Lillo-Ródenas, A. Linares-Solano,<br />
Y. Gogotsi, Phys.Chem.Chem.Phys.11, 4943 (2009).<br />
35. C. O. Ania, J. Pernak, F. Stefaniak, E. Raymundo-Pinero,<br />
F. Beguin, <strong>Carbon</strong> 44, 3126 (2006).<br />
36. C. Largeot et al., J. Am. Chem. Soc. 130, 2730 (2008).<br />
37. S. J. Townsend, T. J. Lenosky, D. A. Muller, C. S. Nichols,<br />
V. Elser V, Phys. Rev. Lett. 69, 921 (1992).<br />
Disorder-Enhanced Transport in<br />
Photonic Quasicrystals<br />
Liad Levi,* Mikael Rechtsman,* Barak Freedman, Tal Schwartz, Ofer Manela, Mordechai Segev†<br />
Quasicrystals are aperiodic structures with rotational symmetries forbidden to conventional<br />
periodic crystals; examples <strong>of</strong> quasicrystals can be found in aluminum alloys, polymers, and<br />
even ancient Islamic art. Here, we present direct experimental observation <strong>of</strong> disorder-enhanced<br />
wave transport in quasicrystals, which contrasts directly with the characteristic suppression <strong>of</strong><br />
transport <strong>by</strong> disorder. Our experiments are carried out in photonic quasicrystals, where we find<br />
that increasing disorder leads to enhanced expansion <strong>of</strong> the beam propagating through the<br />
medium. By further increasing the disorder, we observe that the beam progresses through a<br />
regime <strong>of</strong> diffusive-like transport until it finally transitions to Anderson localization and the<br />
suppression <strong>of</strong> transport. We study this fundamental phenomenon and elucidate its origins <strong>by</strong><br />
relating it to the basic properties <strong>of</strong> quasicrystalline media in the presence <strong>of</strong> disorder.<br />
Anderson localization (1), a fundamental<br />
concept in solid-state physics, describes<br />
how introducing disorder can transform<br />
a conducting crystal into an insulator. This prediction<br />
and subsequent experiments have shown<br />
that, generally, disorder works to arrest transport<br />
in periodic systems containing disorder<br />
(2–5), as well as in fully random potentials (6–10).<br />
However, some systems still pose fundamental<br />
challenges to this concept—most notably,<br />
Department <strong>of</strong> Physics and Solid State Institute, Technion,<br />
Haifa 32000, Israel.<br />
*These authors contributed equally to this work.<br />
†To whom correspondence should be addressed. E-mail:<br />
msegev@tx.technion.ac.il<br />
quasicrystals. Quasicrystals (QCs) (11, 12) constitute<br />
an intermediate phase between fully periodic<br />
and fully disordered media: They do not<br />
have a unit cell and do not exhibit translation<br />
symmetry; nevertheless, they possess noncrystallographic<br />
rotational symmetry and long-range<br />
order and display Bragg diffraction. Although<br />
many <strong>of</strong> the properties <strong>of</strong> QCs are now well understood,<br />
some fundamental questions remain. Perhaps<br />
one <strong>of</strong> the most intriguing questions related<br />
to QCs has to do with transport. Opposite to crystals<br />
containing disorder, which exhibit Anderson<br />
localization, it has been suggested that disorder<br />
can enhance transport in QCs (13, 14). Indirect<br />
experiments have indicated that in some regimes,<br />
increasing disorder could enhance transport (14).<br />
38. H. Terrones, A. L. Mackay, Prog. Cryst. Growth Charact.<br />
Mater. 34, 25 (1997).<br />
39. E. Barborini et al., Appl. Phys. Lett. 81, 3359 (2002).<br />
Acknowledgments: We appreciate funding support from<br />
NSF under award DMR-0907324, the U.S. Department<br />
<strong>of</strong> Energy (DOE) under award DE-SC001951, and the<br />
Institute for Advanced Technology. The research <strong>by</strong><br />
E.A. and D.S. has been carried out at the Center for<br />
Functional Nanomaterials, Brookhaven National Laboratory,<br />
which is supported <strong>by</strong> the DOE, Office <strong>of</strong> Basic Energy<br />
Sciences, under contract DE-AC02-98CH10886. We thank<br />
P. Stephens for XRD data collection, which is supported <strong>by</strong><br />
DOE under contract DE-AC02-98CH10886, and P. Ercius<br />
for data collection on the TEAM instrument, supported<br />
<strong>by</strong> DOE contract DE-AC02-05CH11231. We thank<br />
M. Nilges for help with EPR. We thank J. Potts for<br />
providing graphite oxide samples. We appreciate use<br />
<strong>of</strong> equipment in K. Johnston’s lab. R.M.W. and A.P.<br />
acknowledge the partial support <strong>of</strong> the GRC-NRI SWAN<br />
Center for the XPS data collection and analysis. R.S.R.,<br />
Y.Z., M.D.S., and S.M. have filed a U.S. patent application<br />
(application no. PCT/US2011/036164) regarding work<br />
in this paper.<br />
Supporting Online Material<br />
www.sciencemag.org/cgi/content/full/science.1200770/DC1<br />
SOM Text<br />
Figs. S1 to S12<br />
References<br />
Movie S1<br />
22 November 2010; accepted 2 May 2011<br />
Published online 12 May 2011;<br />
10.1126/science.1200770<br />
The electronic structure <strong>of</strong> atomic QCs has<br />
been shown to have multifractal eigenstates<br />
(15, 16), which may or may not be normalizable<br />
(thus, localized), depending on the critical exponent<br />
associated with the given state. The transport<br />
properties <strong>of</strong> QCs are directly related to the critical<br />
nature <strong>of</strong> their eigenstates, in particular, in the<br />
presence <strong>of</strong> disorder (17). QCs have been shown<br />
to exhibit counterintuitive transport properties,<br />
including extremely low conductivity that increases<br />
with both temperature (inverse Matheisen<br />
rule) and spatial disorder arising from structural<br />
defects (14). Both <strong>of</strong> these effects have been<br />
attributed (16, 18) to hopping between critical<br />
states <strong>of</strong> different spatial extents near the Fermi<br />
energy (due to inelastic electron-phonon scattering<br />
for the former and elastic scattering from<br />
structural defects for the latter). This increase in<br />
transport with disorder is directly opposite to the<br />
characteristic behavior <strong>of</strong> crystals, wherein transport<br />
is reduced with increasing disorder.<br />
Thus far, experiments on transport in atomic<br />
QCs were carried out <strong>by</strong> the study <strong>of</strong> macroscopic<br />
conductivity. However, conductivity experiments<br />
are problematic for addressing some basic questions<br />
on QCs. First, the mechanisms proposed to<br />
explain the unusual transport in QCs assume noninteracting<br />
electrons; however, conductivity measurements<br />
inevitably incorporate electron-electron<br />
interactions. Second, conductivity measurements<br />
do not allow direct observation <strong>of</strong> wave packets,<br />
which could be a key property in unraveling the<br />
mechanisms underlying transport. With the recent<br />
progress in photonic lattices (19), manifesting analogies<br />
between light propagating in a waveguide<br />
Downloaded from www.sciencemag.org on June 24, 2011<br />
www.sciencemag.org SCIENCE VOL 332 24 JUNE 2011 1541
www.sciencemag.org/cgi/content/full/science.1200770/DC1<br />
Supporting Online Material for<br />
<strong>Carbon</strong>-<strong>Based</strong> <strong>Supercapacitors</strong> <strong>Produced</strong> <strong>by</strong> <strong>Activation</strong> <strong>of</strong> <strong>Graphene</strong><br />
Yanwu Zhu, Shanthi Murali, Meryl D. Stoller, K. J. Ganesh, Weiwei Cai, Paulo J.<br />
Ferreira, Adam Pirkle, Robert M. Wallace, Katie A. Cychosz, Matthias Thommes, Dong<br />
Su, Eric A. Stach, Rodney S. Ru<strong>of</strong>f*<br />
*To whom correspondence should be addressed. E-mail: r.ru<strong>of</strong>f@mail.utexas.edu<br />
This PDF file includes:<br />
Published 12 May 2011 on Science Express<br />
DOI: 10.1126/science.1200770<br />
SOM Text<br />
Figs. S1 to S12<br />
References<br />
Other Supporting Online Material for this manuscript includes the following:<br />
(available at www.sciencemag.org/cgi/content/full/science.1200770/DC1)<br />
Movie S1
Supporting Online Materials for<br />
<strong>Carbon</strong>-based <strong>Supercapacitors</strong> <strong>Produced</strong> <strong>by</strong> <strong>Activation</strong> <strong>of</strong> <strong>Graphene</strong><br />
Yanwu Zhu, 1 Shanthi Murali, 1 Meryl D. Stoller, 1 K. J. Ganesh, 1 Weiwei Cai, 1<br />
Paulo J. Ferreira, 1 Adam Pirkle, 2 Robert M. Wallace, 2 Katie A. Cychosz, 3 Matthias<br />
Thommes, 3 Dong Su, 4 Eric A. Stach, 4 Rodney S. Ru<strong>of</strong>f 1,*<br />
1 Department <strong>of</strong> Mechanical Engineering and Materials Science and Engineering Program, The<br />
University <strong>of</strong> Texas at Austin, One University Station C2200, Austin, TX 78712<br />
2 Department <strong>of</strong> Materials Science and Engineering, The University <strong>of</strong> Texas at Dallas, 800 W.<br />
Campbell Rd, Richardson, TX 75080<br />
3 Quantachrome Instruments, 1900 Corporate Drive, Boynton Beach, FL 33426<br />
4 Center for Functional Nanomaterials, Brookhaven National Laboratory, Upton, NY 11973<br />
* E-mail: r.ru<strong>of</strong>f@mail.utexas.edu<br />
Table <strong>of</strong> Contents<br />
1. Synthesis <strong>of</strong> a-MEGO and a-TEGO from MEGO and TEGO<br />
2. Characterization methods<br />
3. Supercapacitor measurements<br />
4. Fig. S1: dependence <strong>of</strong> a-MEGO SSA on ratio <strong>of</strong> KOH to MEGO<br />
5. Fig. S2: SEM/STEM images <strong>of</strong> a-MEGO<br />
6. Fig. S3: EPR measurements <strong>of</strong> a-MEGO<br />
7. Fig. S4: XPS data for a-MEGO and analysis<br />
8. Fig. S5: Raman and FTIR analysis <strong>of</strong> a-MEGO<br />
9. Fig. S6: Comparison <strong>of</strong> N 2 BET data for MEGO and a-MEGO<br />
10. Fig. S7: QSDFT pore size distribution <strong>of</strong> a-MEGO<br />
11. Fig. S8: Supercapacitor performance <strong>of</strong> a-MEGO with TEA BF 4 /AN electrolyte<br />
12. Fig. S9: Stability testing <strong>of</strong> supercapacitor having a-MEGO with BMIM BF 4<br />
electrolyte<br />
13. Fig. S10: Supercapacitor performance <strong>of</strong> a-MEGO with EMIM TFSI electrolyte<br />
14. Fig. S11: N 2 adsorption results for a-TEGO<br />
15. Fig. S12: Supercapacitor performance <strong>of</strong> a-TEGO with BMIM BF 4 /AN electrolyte<br />
16. Movies S1<br />
17. References<br />
1
1. Synthesis <strong>of</strong> a-MEGO and a-TEGO from MEGO and TEGO<br />
The synthesis <strong>of</strong> microwave exfoliated graphite oxide (MEGO) followed the method<br />
described in Ref (1). Briefly, graphite oxide (GO) powders made from the modified<br />
Hummers’ method were irradiated in a domestic microwave oven (GE, JES0736SM1SS)<br />
operated at 1100 W for 1 minute. During the irradiation, a large volume expansion <strong>of</strong> the<br />
GO powder occurred and the black, fluffy MEGO powder obtained was collected for<br />
activation. Typically, 400 mg MEGO powder was dispersed in 20 ml 7M aqueous KOH<br />
solution and stirred for 4 hours at a speed <strong>of</strong> 400 rpm, followed <strong>by</strong> another 20 hours <strong>of</strong><br />
static soaking in ambient conditions. The extra KOH solution was removed <strong>by</strong> briefly<br />
filtering the mixture through a polycarbonate membrane (Whatman, 0.2 m); then the<br />
mixture was dried in the lab environment at 65 o C for 24 hours. A control MEGO sample,<br />
made with the same soaking-drying process but with no KOH was also prepared, and<br />
85% <strong>of</strong> the mass remained after drying. A KOH to MEGO ratio was calculated <strong>by</strong><br />
assuming the MEGO in the dry MEGO/KOH mixture gave the same mass yield, i.e.,<br />
85%.<br />
It was found that the KOH uptake (KOH/MEGO ratio) was linearly dependent on the<br />
molarity <strong>of</strong> the KOH solution, with other process parameters held constant (such as the<br />
amount <strong>of</strong> MEGO from the same batch <strong>of</strong> GO and the volume <strong>of</strong> KOH solution). For the<br />
MEGO soaked in 20 ml 7M KOH as described above, the KOH/MEGO ratio was<br />
8.90.3. The dry MEGO/KOH mixture was heated at 800 o C for 1 hour in a horizontal<br />
tube furnace (50-mm diameter), with an argon flow <strong>of</strong> 150 sccm and working pressure <strong>of</strong><br />
~ 400 Torr. The temperature was ramped from room temperature to 800 o C at 5 o C/min.<br />
After cooling down in vacuum, the sample was repeatedly washed <strong>by</strong> de-ionized water<br />
until a pH value <strong>of</strong> 7 was reached. Then the sample was dried at 65 o C in ambient for 2<br />
hours, followed <strong>by</strong> thermal annealing at 800 o C in vacuum (0.1 Torr) for 2 hours, to<br />
generate ‘activated MEGO’ (a-MEGO) powders. Thermally exfoliated graphite oxide<br />
(‘TEGO’), made <strong>by</strong> ‘thermal shocking’ <strong>of</strong> GO at 250 o C in ambient (2), was activated<br />
following the same process. The a-MEGO and a-TEGO so obtained were characterized in<br />
a variety <strong>of</strong> ways, and supercapacitor measurements were made, as described in the main<br />
text and below.<br />
2
2. Characterization methods<br />
The a-MEGO was analyzed <strong>by</strong> scanning electron microscopy (SEM, Hitachi S5500, 30<br />
kV), transmission electron microscopy (TEM, JEOL 2010F, 200 kV at UT-Austin; TEM,<br />
spherical aberration corrected FEI Titan 80/300, 80 kV at BNL; the spherical and<br />
chromatic aberration corrected TEAM instrument at LBNL, see: ncem.lbl.gov/TEAMproject/)<br />
and scanning TEM (Aberration corrected Hitachi HD2700C at BNL). The exit<br />
wave reconstructed image shown in Figure 1F was processed using the MacTempas Exit<br />
Wave Reconstruction Package (totalresolution.com) from a series <strong>of</strong> 41 images, ranging<br />
from 28 nm above Gaussian to 28 nm below Gaussian and with 1.4 nm focal step size.<br />
The measurement <strong>of</strong> the nitrogen adsorption isotherms was done with a Quantachrome<br />
Nova 2000 at 77.4 K to obtain the surface areas <strong>of</strong> a-MEGO samples from different<br />
KOH/MEGO ratios, and for the comparison between MEGO control and a-MEGO<br />
samples. Detailed adsorption experiments with nitrogen (77.4K), argon (87.3 K), and<br />
carbon dioxide (273.2 K) were also performed with a Quantachrome Autosorb iQ MP in<br />
order to assess surface area and pore characteristics <strong>of</strong> the a-MEGO. Nitrogen adsorption<br />
with the Quantachrome Autosorb iQ MP was also carried out on the a-TEGO. The<br />
samples were outgassed at 150 °C for 16 hours under turbomolecular vacuum pumping<br />
prior to the gas adsorption measurements.<br />
Samples were sealed into glass Lindemann capillaries and x-ray diffraction patterns<br />
collected at the X12A beamline <strong>of</strong> the National Synchrotron Light Source, using x-rays<br />
<strong>of</strong> 0.699 Angstrom wavelength, in parallel beam geometry. Background from the glass<br />
was normalized at high angles, and the data converted to Cu K for the plot shown in<br />
Fig. 2A.<br />
Micro Raman was done on a Witec Alpha 300 confocal Raman system with a laser<br />
wavelength <strong>of</strong> 532 nm. Lorentzian fitting was done to obtain the positions and widths <strong>of</strong><br />
the D and G bands in the Raman shift spectra. Fourier transform infrared spectroscopy<br />
(FTIR) was done with a Perkin Elmer Spectrum BX.<br />
3
X-ray photoelectron spectroscopy (XPS) was conducted with two separate systems<br />
equipped with monochromatic Al Ksources (Kratos AXIS Ultra DLD, Omicron<br />
Nanotechnology XM1000/EA 125 U7) to analyze the chemical composition <strong>of</strong> the<br />
samples.<br />
Combustion elemental analysis was done at Atlantic Microlab, Inc. (Georgia, USA) for<br />
determination <strong>of</strong> the C, O, and H content. Electron paramagnetic resonance (EPR)<br />
measurements <strong>of</strong> a-MEGO were done with a Bruker EMX Plus (X band, 295 K) with<br />
2,2-Di(4-tert-octylphenyl)-1-picrylhydrazyl (DPPH, Sigma Aldrich 257612) as a<br />
standard.<br />
Electron energy loss spectroscopy (EELS, Gatan) was carried out in a JEOL 2010 TEM<br />
on commercial graphite powder (SP-1 graphite, Bay <strong>Carbon</strong>, Inc. Michigan, USA; the<br />
same graphite used to make the GO that was converted to MEGO), MEGO, and a-MEGO<br />
samples, respectively. High resolution SEM, STEM and EELS were performed using a<br />
dedicated STEM Hitachi HD2700C, equipped with a cold-field emission gun, a CEOS<br />
aberration corrector and a high-resolution (0.35eV) EELS Spectrometer (Gatan, Enfina).<br />
As noted in the main text, it was necessary to ignore the large percentage <strong>of</strong> the a-MEGO<br />
on the TEM grid, as it was too thick to perform EELS measurements on. We were<br />
successful in finding some thin, plate-shaped a-MEGO with a porous structure that was<br />
identical to that observed in the more three-dimensional chunks, shown in Figure 1C <strong>of</strong><br />
the main text. It is possible to quantify the amount <strong>of</strong> sp 2 -bonding <strong>by</strong> measuring the ratio<br />
between π* bonding and π*+δ* bonding using EELS (3, 4). The relative amount <strong>of</strong> sp 2<br />
carbon atoms was calculated <strong>by</strong> using the formula:<br />
sp 2<br />
sp 2 sp 3 <br />
I u<br />
<br />
<br />
I g<br />
<br />
<br />
u<br />
I <br />
<br />
u<br />
I <br />
<br />
g<br />
I <br />
<br />
g<br />
I <br />
<br />
,<br />
where the I u and I g represent the integrated intensity for specific energy ranges <strong>of</strong> the<br />
spectra for the a-MEGO and graphite (assumed to be 100% sp 2 carbon), respectively (3,<br />
4). Comparisons were made between a-MEGO and graphite films <strong>of</strong> approximately the<br />
same thickness (as measured <strong>by</strong> comparing the intensity in the zero loss peak with the<br />
4
intensity in the low-loss region) (5). I <br />
* and I <br />
* are the peak intensities due to the 1s *<br />
and 1s * transitions, corresponding to sp 2 and sp 3 hybridized carbon atoms. Twowindows,<br />
283.2-287.2 eV and 292.5-312.5 eV for the 1s * and 1s * transitions,<br />
respectively, were integrated to generate the peak intensities. The resulting analyses<br />
reveal the fraction <strong>of</strong> sp 2 bonding for the a-MEGO is 98±2%. The statistical error <strong>of</strong> 2%<br />
is consistent with the values expected using this approach (3). Complementary XPS<br />
measurements were also taken <strong>of</strong> the a-MEGO powder material with the Omicron<br />
Nanotechnology system (analyzer acceptance angle ±8, take<strong>of</strong>f angle 45°, pass energy 15<br />
eV) to establish the relative amount <strong>of</strong> sp 2 carbon for comparison to the EELS<br />
measurements. The powder sample was supported on a surface that was nearly free <strong>of</strong><br />
carbon and oxygen and that consisted <strong>of</strong> a Pt thin film that had been evaporated on a Si<br />
wafer. XPS data was analyzed using the CasaXPS fitting package and an asymmetric<br />
Doniach-Sunjic (DS) peak shape was used to fit the sp 2 component, as required for<br />
conductive sp 2 carbon materials (6, 7).<br />
The powder conductivity <strong>of</strong> a-MEGO samples was obtained <strong>by</strong> the method described in<br />
Ref (1).<br />
3. Supercapacitor measurements<br />
A two-electrode cell configuration was used to measure the performance <strong>of</strong><br />
supercapacitors with the a-MEGO and a-TEGO materials. 5 wt% Polytetrafluoroethylene<br />
(PTFE; 60 wt% dispersion in water) was added to the a-MEGO and a-TEGO as a binder.<br />
Typically, the a-MEGO (or a-TEGO) and PTFE was mixed into a paste using a mortar<br />
and pestle, rolled into uniform thickness sheets whose thickness ranged 40 to 50 μm thick<br />
(from sheet to sheet) and punched into ~1-cm diameter electrodes. A pair <strong>of</strong> typical<br />
electrodes had a weight between 2.5 and 4.0 mg after drying overnight at a ~ 100 o C<br />
under vacuum. The two identical (<strong>by</strong> weight and size) electrodes were assembled in a test<br />
cell as shown in Ref (8), which consisted <strong>of</strong> two current collectors, two electrodes, and an<br />
ion-porous separator (Celgard ® 3501) supported in a test fixture consisting <strong>of</strong> two<br />
stainless steel plates. Conductive carbon coated aluminum foils (Exopack TM 0.5 mil 2-<br />
side coating) were used as current collectors. 1-butyl-3-methylimidazolium<br />
5
tetrafluoroborate (BMIM BF 4 ) was obtained commercially from Sigma Aldrich and<br />
diluted in acetonitrile (AN) with a weight ratio <strong>of</strong> 1:1 (with some testing done with neat<br />
BMIM BF 4 ). The tetraethylammonium tetrafluoroborate (TEA BF 4 , Sigma Aldrich) was<br />
prepared at 1.0 M in AN. The 1-Ethyl-3-methylimidazolium<br />
bis(trifluoromethylsulfonyl)imide (EMIM TFSI, Sigma Aldrich) was used as purchased.<br />
The assembly <strong>of</strong> the test cell was done in a glove box filled with Ar.<br />
Gravimetric capacitance from galvanostatic charge/discharge was calculated <strong>by</strong> using<br />
the formula<br />
4Icons<br />
Ccarbon<br />
<br />
mdV / dt ,<br />
where I is the constant current and m the total mass for both carbon electrodes, and dV/dt<br />
was calculated from the slope obtained <strong>by</strong> fitting a straight line to the discharge curve<br />
over the range <strong>of</strong> V max (the voltage at the beginning <strong>of</strong> discharge) to ½ V max . <strong>Based</strong> on a<br />
RC model, the capacitance was also calculated from the frequency response analysis, <strong>by</strong><br />
C 1/(2fZ ) , where f is frequency in Hz and Z” is the imaginary part <strong>of</strong> the<br />
impedance, to show the trend <strong>of</strong> changes in capacitance with frequency. The energy<br />
density was estimated <strong>by</strong> using the formula E cell<br />
CV max 2 /8, where the cell mass (two<br />
carbon electrodes) was normalized. Effective series resistance (ESR) was estimated using<br />
the voltage drop at the beginning <strong>of</strong> the discharge, V drop , at certain constant current I cons ,<br />
with the formula R ESR<br />
V drop<br />
/(2I cons<br />
). The power density, calculated from the discharge<br />
data at certain constant current I cons , and normalized with the weight <strong>of</strong> the carbon cell<br />
(two carbon electrodes) is given <strong>by</strong><br />
P (V max V drop )2<br />
4R ESR<br />
m<br />
.<br />
6
4. Dependence <strong>of</strong> a-MEGO SSA on ratio <strong>of</strong> KOH to MEGO<br />
Fig. S1 The BET specific surface area (SSA) <strong>of</strong> a-MEGO versus the KOH to MEGO<br />
loading ratio in the mixture before activation. For this series <strong>of</strong> samples, the highest SSA<br />
was about 2600 m 2 /g.<br />
7
5. SEM/STEM images <strong>of</strong> a-MEGO<br />
Fig. S2 (A) Low magnification SEM and (B) high magnification SEM and (C) ADF-<br />
STEM images <strong>of</strong> a-MEGO. (B and C) are simultaneously taken from the region 1 in<br />
(A). Larger pores <strong>of</strong> between 2-10 nm are clearly resolved. (D) Very high magnification<br />
SEM and (E) ADF-STEM images simultaneously taken from the region 2 in (A), with (F)<br />
being from the region outlined as a box in (E). These images indicate that the entire<br />
microstructure is composed <strong>of</strong> very small pores, <strong>of</strong> order <strong>of</strong> ~1 nm in size, as is evident in<br />
the magnified portion shown as (F).<br />
8
6. EPR measurements <strong>of</strong> a-MEGO<br />
Fig. S3 EPR data <strong>of</strong> a-MEGO with DPPH used as a standard. Samples <strong>of</strong> a-MEGO (SSA<br />
~2520 m 2 /g), and <strong>of</strong> DPPH diluted in KCl, were measured in 4 mm tubes under similar<br />
conditions except for the number <strong>of</strong> scans. 400 scans were run on a-MEGO to obtain<br />
sufficient signal/noise ratio; only 40 scans were run on DPPH to avoid saturation. Double<br />
integrated areas <strong>of</strong> as-measured curves were normalized with the number <strong>of</strong> scans and<br />
mass <strong>of</strong> each sample. A concentration <strong>of</strong> ~ 2 x 10 16 spins/g was estimated for this a-<br />
MEGO sample, corresponding to a concentration <strong>of</strong> 0.4 spins per million carbon atoms.<br />
9
7. XPS data for a-MEGO and analysis<br />
Fig. S4 Detailed XPS analysis <strong>of</strong> a-MEGO sample (SSA ~ 2520 m 2 /g). (A) Fit to the C<br />
1s region is shown, with detailed spectrum inset. The main sp 2 carbon peak is a Doniach-<br />
Sunjic line with asymmetry parameter α=0.20 and FWHM 0.78 eV, which are reasonably<br />
close to values for these parameters in fits to highly oriented pyrolytic graphite (HOPG)<br />
and glassy carbon (7). Multiple states are also present on the high binding energy side <strong>of</strong><br />
the main sp 2 peak. An sp 3 component, if present, is expected at +0.8 to +0.9 eV above the<br />
sp 2 component in the C 1s spectrum (9). Attempts to fit the spectral envelope with an sp 3<br />
component indicate that sp 3 carbon is below the limit <strong>of</strong> detection <strong>of</strong> XPS (approximately<br />
1 at. %). Two C 1s states are observed at +2.0 and +3.3 eV above the main sp 2 peak (with<br />
widths <strong>of</strong> 1.2 eV) and are attributed to C-O bonding with corresponding states observed<br />
in the O 1s And impurity K 2p spectra. Several shake-up features are also present at +4.4,<br />
+5.5, +6.5 and +7.9 eV above the main sp 2 peak (widths <strong>of</strong> 1.5, 1.3, 1.3 and 1.1 eV<br />
10
espectively) and are in good agreement with fits to the extended shake-up energy loss<br />
spectrum <strong>of</strong> glassy carbon and highly oriented pyrolytic graphite (HOPG) <strong>by</strong> Leiro et.<br />
al.(7). Residual potassium (< 2 at. %) from the KOH activation process is detected as a K<br />
2p doublet with the K 2p 3/2 state observed at 292.9 eV. (B) The O 1s region is shown and<br />
composed <strong>of</strong> three components at 530.6 eV (K 2 CO 3 ), 532.5 eV (KHCO 3 ) and 534.6 eV<br />
(KOH) (10-12). It is noted that the C 1s shake up features described above make the<br />
unequivocal deconvolution <strong>of</strong> a carbonate bond problematic. Residual peak fitting error is<br />
shown beneath all spectra.<br />
11
8. Raman and FTIR analysis <strong>of</strong> a-MEGO<br />
Fig. S5 (A) Raman <strong>of</strong> a-MEGO and MEGO control sample. The I d /I g slightly increases<br />
from ~1.16 in MEGO to ~1.19 in a-MEGO. From Lorentzian fitting, the D band FWHM<br />
increases from ~135 to ~183 cm -1 . (B) FTIR transmittance spectra. The following bands<br />
were observed: O-H stretching (3200-3400 cm -1 ), C-H aliphatic (2800-3000 cm -1 ), C=O<br />
and C-O stretching (1640-1750 cm -1 ), aromatic C=C stretching (1400-1600 cm -1 ) and<br />
bands related to aromatic content (700-920 cm -1 ) such as out <strong>of</strong> plane C-H bending (~910<br />
cm -1 ) with different degrees <strong>of</strong> substitution. Compared with the MEGO control sample,<br />
a-MEGO shows lower signals from the oxygen or hydrogen containing groups.<br />
12
9. Comparison <strong>of</strong> N 2 BET data for MEGO and a-MEGO<br />
Fig. S6 N 2 adsorption/desorption analysis <strong>of</strong> a-MEGO (~ 2520 m 2 /g) with MEGO as<br />
control. (A) N 2 isotherm curves at 77.4 K. (B) Cumulative pore volume versus pore<br />
diameter plots obtained from the adsorption isotherm in (A). NLDFT analysis for carbon<br />
with slit/cylindrical model was used on the adsorption data to obtain the pore volumes.<br />
13
10. QSDFT pore size distribution <strong>of</strong> a-MEGO<br />
Fig S7 ‘Quenched solid density functional theory’ (QSDFT) pore size distribution <strong>of</strong> a-<br />
MEGO. In addition to the NLDFT pore size distribution shown in Fig. 3B (which was<br />
based on NLDFT assuming a slit/cylindrical pore hybrid model), we also analyzed the<br />
nitrogen (77.4 K) and argon (87.3 K) adsorption isotherms <strong>by</strong> assuming a slit pore model<br />
and QSDFT, which quantitatively accounts for the surface geometrical inhomogeneity. It<br />
follows that this pore size distribution essentially resembles the distribution from the<br />
slit/cylindrical pore model shown in the manuscript (Fig. 3 B); however, the mesopore<br />
size is slightly smaller in the slit pore QSDFT model.<br />
14
11. Supercapacitor performance <strong>of</strong> a-MEGO with TEA BF 4 /AN electrolyte<br />
Fig. S8 Supercapacitor performance <strong>of</strong> a-MEGO (SSA ~ 3100 m 2 /g) with 1.0 M TEA<br />
BF 4 /AN electrolyte. (A) CV curves for different scan rates. Rectangular shapes indicate<br />
the capacitive behavior. (B) Galvanostatic charge/discharge curves <strong>of</strong> a-MEGO based<br />
supercapacitor under different constant currents. The specific capacitances calculated<br />
from the discharge curves are 154, 145 and 141 F/g, for the constant currents <strong>of</strong> 0.8, 1.9<br />
and 3.8 A/g, respectively. From the discharge data obtained at the constant current <strong>of</strong> 0.8<br />
A/g, the energy density and power density were estimated as 39 Wh/kg and 145 kW/kg,<br />
respectively, when normalized with the total weight <strong>of</strong> two a-MEGO electrodes. (C)<br />
Nyquist plot, displaying a similar resistance as that <strong>of</strong> a-MEGO in BMIM BF 4 /AN<br />
electrolyte. (D) Frequency response <strong>of</strong> the capacitance <strong>of</strong> the a-MEGO supercapacitor.<br />
15
12. Stability testing <strong>of</strong> supercapacitor having a-MEGO with BMIM BF 4 electrolyte<br />
Fig. S9 Testing <strong>of</strong> the a-MEGO (with surface area <strong>of</strong> ~ 3100 m 2 /g) based supercapacitor<br />
in neat BMIM BF 4 over 10000 cycles. Constant current cycles were run at a rate <strong>of</strong> 2.5<br />
A/g. Retention <strong>of</strong> 97% was obtained after 10000 cycles. Here the pure IL was used as<br />
electrolyte to minimize possible contamination.<br />
16
13. Supercapacitor performance <strong>of</strong> a-MEGO with EMIM TFSI electrolyte<br />
Fig. S10 Supercapacitor performance <strong>of</strong> a-MEGO (SSA ~ 3100 m 2 /g) in neat EMIM<br />
TFSI electrolyte. (A) CV curves under different scan rates. (B) Galvanostatic<br />
charge/discharge curves under different constant currents. The specific capacitances<br />
calculated from the discharge curves with maximum voltage <strong>of</strong> 3.5 V are 200, 192 and<br />
187 F/g for the currents <strong>of</strong> 0.7, 1.8 and 3.5 A/g, respectively. The normalized ESR is<br />
0.025 g. From the discharge data obtained at the constant current <strong>of</strong> 0.7 A/g, the energy<br />
density and power density were estimated as 85 Wh/kg and 122 kW/kg, when normalized<br />
with the total weight <strong>of</strong> the two a-MEGO electrodes.<br />
17
14. N 2 adsorption results <strong>of</strong> a-TEGO<br />
Fig. S11 N 2 adsorption/desorption analysis <strong>of</strong> a-TEGO. (A) High resolution, low<br />
pressure isotherm, from which a high BET SSA <strong>of</strong> 2675 m 2 /g (calculated in the linear<br />
relative pressure range from 0.1 to 0.3) is obtained. (B) Pore size distribution for N 2<br />
adsorption (calculated using a slit/cylindrical NLDFT model).<br />
18
15. Supercapacitor performance <strong>of</strong> a-TEGO with BMIM BF 4 /AN electrolyte<br />
Fig. S12 Supercapacitor performance <strong>of</strong> a-TEGO (SSA ~2700 m 2 /g) in the BMIM<br />
BF 4 /AN electrolyte. (A) CV curves for different scan rates. (B) Galvanostatic<br />
charge/discharge curves under different constant currents. The capacitance values<br />
calculated are 156, 154 and 154 F/g for the currents <strong>of</strong> 2.0, 3.9 and 7.8 A/g, respectively.<br />
From the discharge data obtained at the constant current <strong>of</strong> 2.0 A/g, the ESR, energy<br />
density and power density were estimated as 4.1 , 66 Wh/kg and 282 kW/kg,<br />
respectively. (C) Nyquist plot for the a-TEGO based supercapacitor. (D) Frequency<br />
response <strong>of</strong> the capacitance <strong>of</strong> the a-TEGO supercapacitor in BMIM BF 4 /AN electrolyte.<br />
19
16. Movies S1<br />
Movies S1 Through-focal series high resolution TEM images <strong>of</strong> the a-MEGO<br />
structure. The images were obtained at 80 kV on the aberration corrected FEI Titan, with<br />
a focal step <strong>of</strong> –4 nm per image. Initial focus is deliberately slightly over-focus, and scans<br />
through slightly under-focus, so that in a given frame some portion <strong>of</strong> the wedge-shaped<br />
sample is in exact / Scherzer defocus. The images show that the a-MEGO structure is<br />
composed <strong>of</strong> a high density <strong>of</strong> pores <strong>of</strong> very small size, with the pore walls being<br />
composed <strong>of</strong> single carbon sheets.<br />
17. References<br />
1. Y. Zhu et al., <strong>Carbon</strong> 48, 2118 (2010).<br />
2. H. C. Schniepp et al., Journal <strong>of</strong> Physical Chemistry B 110, 8535 (2006).<br />
3. S. D. Berger, D. R. Mckenzie, P. J. Martin, Philosophical Magazine Letters 57, 285<br />
(1988).<br />
4. H. Daniels, R. Brydson, B. Rand, A. Brown, Philosophical Magazine 87, 4073 (2007).<br />
5. R. Egerton, Electron energy loss spectroscopy in the electron microscope. (Plenum, New<br />
York, ed. 2nd, 1996).<br />
6. S. Doniach, M. Sunjic, Journal <strong>of</strong> Physics C: Solid State Physics 3, 285 (1970).<br />
7. J. A. Leiro, M. H. Heinonen, T. Laiho, I. G. Batirev, Journal <strong>of</strong> Electron Spectroscopy<br />
and Related Phenomena 128, 205 (2003).<br />
8. M. D. Stoller, R. S. Ru<strong>of</strong>f, Energy & Environmental Science 3, 1294 (2010).<br />
9. R. Haerle, E. Riedo, A. Pasquarello, A. Baldereschi, Physical Review B 65, 045101<br />
(2001).<br />
10. A. Shchukarev, D. Korolkov, Central European Journal <strong>of</strong> Chemistry 2, 347 (2004).<br />
11. P. M. Blass, X. L. Zhou, J. M. White, The Journal <strong>of</strong> Physical Chemistry 94, 3054<br />
(1990).<br />
12. D. V. Chakarov, et al., Journal <strong>of</strong> Physics: Condensed Matter 5, 2903 (1993).<br />
20