Breeding Programme
Breeding Programme
Breeding Programme

Create successful ePaper yourself
Turn your PDF publications into a flip-book with our unique Google optimized e-Paper software.
63<br />
65<br />
67<br />
69<br />
71<br />
73<br />
75<br />
77<br />
79<br />
81<br />
83<br />
85<br />
87<br />
89<br />
91<br />
93<br />
95<br />
97<br />
99<br />
01<br />
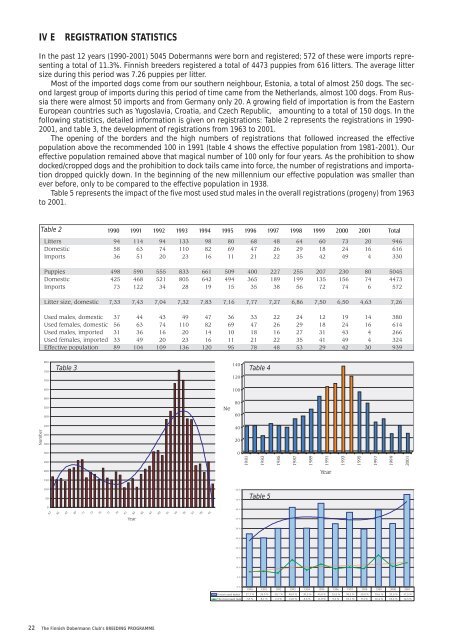
IV E REGISTRATION STATISTICS<br />
In the past 12 years (1990-2001) 5045 Dobermanns were born and registered; 572 of these were imports representing<br />
a total of 11.3%. Finnish breeders registered a total of 4473 puppies from 616 litters. The average litter<br />
size during this period was 7.26 puppies per litter.<br />
Most of the imported dogs come from our southern neighbour, Estonia, a total of almost 250 dogs. The second<br />
largest group of imports during this period of time came from the Netherlands, almost 100 dogs. From Russia<br />
there were almost 50 imports and from Germany only 20. A growing field of importation is from the Eastern<br />
European countries such as Yugoslavia, Croatia, and Czech Republic, amounting to a total of 150 dogs. In the<br />
following statistics, detailed information is given on registrations: Table 2 represents the registrations in 1990-<br />
2001, and table 3, the development of registrations from 1963 to 2001.<br />
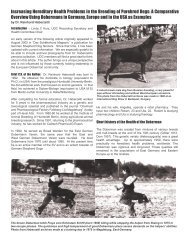
The opening of the borders and the high numbers of registrations that followed increased the effective<br />
population above the recommended 100 in 1991 (table 4 shows the effective population from 1981-2001). Our<br />
effective population remained above that magical number of 100 only for four years. As the prohibition to show<br />
docked/cropped dogs and the prohibition to dock tails came into force, the number of registrations and importation<br />
dropped quickly down. In the beginning of the new millennium our effective population was smaller than<br />
ever before, only to be compared to the effective population in 1938.<br />
Table 5 represents the impact of the five most used stud males in the overall registrations (progeny) from 1963<br />
to 2001.<br />
Table 2<br />
1990 1991 1992 1993 1994 1995 1996 1997 1998 1999 2000 2001 Total<br />
Litters 94 114 94 133 98 80 68 48 64 60 73 20 946<br />
Domestic 58 63 74 110 82 69 47 26 29 18 24 16 616<br />
Imports 36 51 20 23 16 11 21 22 35 42 49 4 330<br />
Puppies 498 590 555 833 661 509 400 227 255 207 230 80 5045<br />
Domestic 425 468 521 805 642 494 365 189 199 135 156 74 4473<br />
Imports 73 122 34 28 19 15 35 38 56 72 74 6 572<br />
Litter size, domestic 7,33 7,43 7,04 7,32 7,83 7,16 7,77 7,27 6,86 7,50 6,50 4,63 7,26<br />
Used males, domestic 37 44 43 49 47 36 33 22 24 12 19 14 380<br />
Used females, domestic 56 63 74 110 82 69 47 26 29 18 24 16 614<br />
Used males, imported 31 36 16 20 14 10 18 16 27 31 43 4 266<br />
Used females, imported 33 49 20 23 16 11 21 22 35 41 49 4 324<br />
Effective population 89 104 109 136 120 95 78 48 53 29 42 30 939<br />
800<br />
750<br />
Table 3<br />
140<br />
Table 4<br />
700<br />
120<br />
650<br />
100<br />
600<br />
550<br />
500<br />
Ne<br />
80<br />
60<br />
Number<br />
450<br />
400<br />
350<br />
40<br />
20<br />
300<br />
0<br />
250<br />
1981<br />
1983<br />
1985<br />
1987<br />
1989<br />
1991<br />
1993<br />
1995<br />
1997<br />
1999<br />
2001<br />
200<br />
Year<br />
150<br />
100<br />
50<br />
50 %<br />
45 %<br />
Table 5<br />
0<br />
40 %<br />
Year<br />
35 %<br />
30 %<br />
25 %<br />
20 %<br />
15 %<br />
10 %<br />
5%<br />
0%<br />
1990 1991 1992 1993 1994 1995 1996 1997 1998 1999 2000 2001<br />
5 most used males 27,3 % 25,3 % 30,1 % 40,9 % 30,3 % 43,0 % 32,5 % 38,3 % 29,8 % 39,6 % 32,6 % 47,5 %<br />
The most used male 7,8 % 8,1 % 7,2 % 14,0 % 8,6 % 11,8 % 9,3 % 10,1 % 9,4 % 16,4 % 10,4 % 12,5 %<br />
22 The Finnish Dobermann Club’s BREEDING PROGRAMME