Breeding Programme
Breeding Programme
Breeding Programme

Create successful ePaper yourself
Turn your PDF publications into a flip-book with our unique Google optimized e-Paper software.
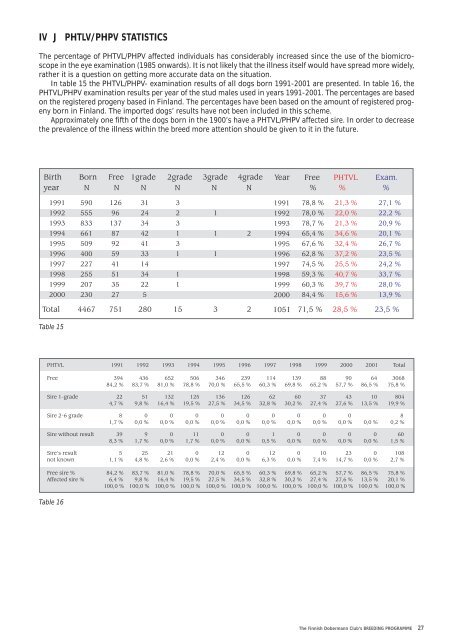
IV J PHTLV/PHPV STATISTICS<br />
The percentage of PHTVL/PHPV affected individuals has considerably increased since the use of the biomicroscope<br />
in the eye examination (1985 onwards). It is not likely that the illness itself would have spread more widely,<br />
rather it is a question on getting more accurate data on the situation.<br />
In table 15 the PHTVL/PHPV- examination results of all dogs born 1991-2001 are presented. In table 16, the<br />
PHTVL/PHPV examination results per year of the stud males used in years 1991-2001. The percentages are based<br />
on the registered progeny based in Finland. The percentages have been based on the amount of registered progeny<br />
born in Finland. The imported dogs’ results have not been included in this scheme.<br />
Approximately one fifth of the dogs born in the 1900’s have a PHTVL/PHPV affected sire. In order to decrease<br />
the prevalence of the illness within the breed more attention should be given to it in the future.<br />
Birth Born Free 1grade 2grade 3grade 4grade Year Free PHTVL Exam.<br />
year N N N N N N<br />
% % %<br />
1991 590 126 31 3 1991 78,8 % 21,3 % 27,1 %<br />
1992 555 96 24 2 1 1992 78,0 % 22,0 % 22,2 %<br />
1993 833 137 34 3 1993 78,7 % 21,3 % 20,9 %<br />
1994 661 87 42 1 1 2 1994 65,4 % 34,6 % 20,1 %<br />
1995 509 92 41 3 1995 67,6 % 32,4 % 26,7 %<br />
1996 400 59 33 1 1 1996 62,8 % 37,2 % 23,5 %<br />
1997 227 41 14 1997 74,5 % 25,5 % 24,2 %<br />
1998 255 51 34 1 1998 59,3 % 40,7 % 33,7 %<br />
1999 207 35 22 1 1999 60,3 % 39,7 % 28,0 %<br />
2000 230 27 5 2000 84,4 % 15,6 % 13,9 %<br />
Total 4467 751 280 15 3 2 1051 71,5 % 28,5 % 23,5 %<br />
Table 15<br />
PHTVL 1991 1992 1993 1994 1995 1996 1997 1998 1999 2000 2001 Total<br />
Free 394 436 652 506 346 239 114 139 88 90 64 3068<br />
84,2 % 83,7 % 81,0 % 78,8 % 70,0 % 65,5 % 60,3 % 69,8 % 65,2 % 57,7 % 86,5 % 75,8 %<br />
Sire 1-grade 22 51 132 125 136 126 62 60 37 43 10 804<br />
4,7 % 9,8 % 16,4 % 19,5 % 27,5 % 34,5 % 32,8 % 30,2 % 27,4 % 27,6 % 13,5 % 19,9 %<br />
Sire 2-6 grade 8 0 0 0 0 0 0 0 0 0 8<br />
1,7 % 0,0 % 0,0 % 0,0 % 0,0 % 0,0 % 0,0 % 0,0 % 0,0 % 0,0 % 0,0 % 0,2 %<br />
Sire without result 39 9 0 11 0 0 1 0 0 0 0 60<br />
8,3 % 1,7 % 0,0 % 1,7 % 0,0 % 0,0 % 0,5 % 0,0 % 0,0 % 0,0 % 0,0 % 1,5 %<br />
Sire’s result<br />
not known<br />
5 25 21 0 12 0 12 0 10 23 0 108<br />
1,1 % 4,8 % 2,6 % 0,0 % 2,4 % 0,0 % 6,3 % 0,0 % 7,4 % 14,7 % 0,0 % 2,7 %<br />
Free sire % 84,2 % 83,7 % 81,0 % 78,8 % 70,0 % 65,5 % 60,3 % 69,8 % 65,2 % 57,7 % 86,5 % 75,8 %<br />
Affected sire % 6,4 % 9,8 % 16,4 % 19,5 % 27,5 % 34,5 % 32,8 % 30,2 % 27,4 % 27,6 % 13,5 % 20,1 %<br />
100,0 % 100,0 % 100,0 % 100,0 % 100,0 % 100,0 % 100,0 % 100,0 % 100,0 % 100,0 % 100,0 % 100,0 %<br />
Table 16<br />
The Finnish Dobermann Club’s BREEDING PROGRAMME 27