Key Activities PAGE 6
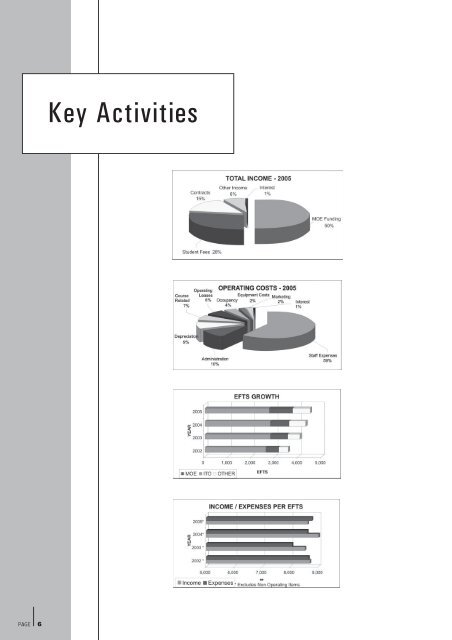
4 YEAR SUMMARY INFORMATION FOR THE YEAR ENDED 31 DECEMBER 2005* 2005 2004 2003 2002 Actual Actual Actual Actual $000 $000 $000 $000 STATEMENT OF FINANCIAL PERFORMANCE Grant income 19,343 19,031 18,428 16,742 Other income 19,421 20,135 16,241 14,212 Operating revenue 38,764 39,166 34,669 30,954 Operating expenses 39,456 37,079 32,759 30,750 Operating surplus (692) 2,087 1,910 204 Non operating items 581 700 968 1,038 Net surplus (deficit) (1,273) 1,387 942 (834) STATEMENT OF FINANCIAL POSITION Current assets 6,952 8,662 6,228 2,429 Non-current assets 40,580 39,411 35,715 36,366 Total assets 47,532 48,073 41,943 38,795 Current liabilities 12,344 11,547 9,774 7,029 Non-current liabilities 3,426 5,760 7,252 9,719 Total liabilities 15,770 17,307 17,026 16,748 Total equity 31,762 30,766 24,917 22,047 Total equity and liabilities 47,532 48,073 41,943 38,795 ENROLMENT INFORMATION No. <strong>of</strong> Students 12,350 11,489 10,946 10,086 MOE EFTS 2,747 2,806 2,794 2,596 Total EFTS 4,503 4,313 4,069 3,559 Student / EFTS ratio 2.7:1 2.6:1 2.7:1 2.8:1 EFTS : FTE academic staff 22:1 21:1 20:1 16:1 FINANCIAL INDICATORS Total assets to total EFTS 10,556 11,146 10,308 10,901 Total income to total EFTS 8,608 9,081 8,520 8,697 Total expenses to total EFTS 8,891 8,759 8,289 8,932 Net surplus to operating revenue (3.3%) 3.5% 2.7% (2.7%) Net surplus to total assets (2.7%) 2.9% 2.2% (2.1%) Net surplus to total equity (4.0%) 4.5% 3.8% (3.8%) Working capital % 56.3% 75.0% 63.7% 34.5% Debt as a % <strong>of</strong> total capital 18.4% 23.7% 34.7% 50.4% Operating surplus plus interest to interest ratio (1.1) 6.8 7.0 19.5 Operating surplus as a % <strong>of</strong> total debt (11.8%) 27.7% 21.9% ( 1.8%) * representing the financial years <strong>Wellington</strong> <strong>Institute</strong> <strong>of</strong> <strong>Technology</strong> has been operating as a consolidated entity PAGE 7