Chevron Corporate Responsibility Report 2009
Chevron Corporate Responsibility Report 2009
Chevron Corporate Responsibility Report 2009
You also want an ePaper? Increase the reach of your titles
YUMPU automatically turns print PDFs into web optimized ePapers that Google loves.
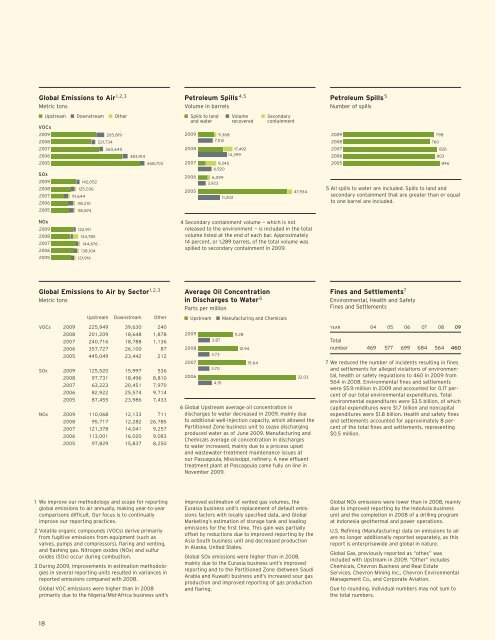
Global Emissions to Air<br />
1, 2, 3<br />
Metric tons<br />
<strong>2009</strong><br />
2008<br />
2007<br />
2006<br />
2005<br />
Upstream Downstream Other<br />
VOCs<br />
SOx<br />
<strong>2009</strong><br />
2008<br />
2007<br />
2006<br />
2005<br />
125,036<br />
91,644<br />
142,052<br />
118,210<br />
118,874<br />
221,734<br />
265,819<br />
260,640<br />
383,914<br />
468,703<br />
Petroleum Spills 4, 5<br />
Volume in barrels<br />
Spills to land Volume Secondary<br />
and water recovered containment<br />
<strong>2009</strong><br />
2008<br />
2007<br />
2006<br />
2005<br />
9,368<br />
7,512<br />
9,245<br />
6,920<br />
6,099<br />
3,923<br />
17,492<br />
14,399<br />
11,202<br />
47,934<br />
Petroleum Spills 5<br />
Number of spills<br />
<strong>2009</strong><br />
2008<br />
2007<br />
2006<br />
2005<br />
760<br />
798<br />
826<br />
803<br />
846<br />
5 All spills to water are included. Spills to land and<br />
secondary containment that are greater than or equal<br />
to one barrel are included.<br />
NOx<br />
<strong>2009</strong><br />
2008<br />
2007<br />
2006<br />
2005<br />
122,911<br />
134,785<br />
144,676<br />
138,104<br />
121,916<br />
4 Secondary containment volume — which is not<br />
released to the environment — is included in the total<br />
volume listed at the end of each bar. Approximately<br />
14 percent, or 1,289 barrels, of the total volume was<br />
spilled to secondary containment in <strong>2009</strong>.<br />
Global Emissions to Air by Sector<br />
1, 2, 3<br />
Metric tons<br />
Average Oil Concentration<br />
in Discharges to Water 6<br />
Parts per million<br />
Fines and Settlements 7<br />
Environmental, Health and Safety<br />
Fines and Settlements<br />
Upstream Downstream Other<br />
Upstream<br />
Manufacturing and Chemicals<br />
VOCs <strong>2009</strong> 225,949 39,630 240<br />
2008 201,209 18,648 1,878<br />
2007 240,716 18,788 1,136<br />
2006 357,727 26,100 87<br />
2005 445,049 23,442 212<br />
SOx <strong>2009</strong> 125,520 15,997 536<br />
2008 97,731 18,496 8,810<br />
2007 63,223 20,451 7,970<br />
2006 82,922 25,574 9,714<br />
2005 87,455 23,986 7,433<br />
NOx <strong>2009</strong> 110,068 12,133 711<br />
2008 95,717 12,282 26,785<br />
2007 121,378 14,041 9,257<br />
2006 113,001 16,020 9,083<br />
2005 97,829 15,837 8,250<br />
<strong>2009</strong><br />
2008<br />
2007<br />
2006<br />
3.87<br />
3.73<br />
3.70<br />
4.51<br />
11.28<br />
12.94<br />
15.64<br />
32.03<br />
6 Global Upstream average oil concentration in<br />
discharges to water decreased in <strong>2009</strong>, mainly due<br />
to additional well-injection capacity, which allowed the<br />
Partitioned Zone business unit to cease discharging<br />
produced water as of June <strong>2009</strong>. Manufacturing and<br />
Chemicals average oil concentration in discharges<br />
to water increased, mainly due to a process upset<br />
and wastewater-treatment maintenance issues at<br />
our Pascagoula, Mississippi, refinery. A new effluent<br />
treatment plant at Pascagoula came fully on line in<br />
November <strong>2009</strong>.<br />
YEAR 04 05 06 07 08 09<br />
Total<br />
number 469 577 699 684 564 460<br />
7 We reduced the number of incidents resulting in fines<br />
and settlements for alleged violations of environmental,<br />
health or safety regulations to 460 in <strong>2009</strong> from<br />
564 in 2008. Environmental fines and settlements<br />
were $5.9 million in <strong>2009</strong> and accounted for 0.17 percent<br />
of our total environmental expenditures. Total<br />
environmental expenditures were $3.5 billion, of which<br />
capital expenditures were $1.7 billion and noncapital<br />
expenditures were $1.8 billion. Health and safety fines<br />
and settlements accounted for approximately 8 percent<br />
of the total fines and settlements, representing<br />
$0.5 million.<br />
1 We improve our methodology and scope for reporting<br />
global emissions to air annually, making year-to-year<br />
comparisons difficult. Our focus is to continually<br />
improve our reporting practices.<br />
2 Volatile organic compounds (VOCs) derive primarily<br />
from fugitive emissions from equipment (such as<br />
valves, pumps and compressors), flaring and venting,<br />
and flashing gas. Nitrogen oxides (NOx) and sulfur<br />
oxides (SOx) occur during combustion.<br />
3 During <strong>2009</strong>, improvements in estimation methodologies<br />
in several reporting units resulted in variances in<br />
reported emissions compared with 2008.<br />
Global VOC emissions were higher than in 2008<br />
primarily due to the Nigeria/Mid-Africa business unit’s<br />
improved estimation of vented gas volumes, the<br />
Eurasia business unit’s replacement of default emissions<br />
factors with locally specified data, and Global<br />
Marketing’s estimation of storage tank and loading<br />
emissions for the first time. This gain was partially<br />
offset by reductions due to improved reporting by the<br />
Asia South business unit and decreased production<br />
in Alaska, United States.<br />
Global SOx emissions were higher than in 2008,<br />
mainly due to the Eurasia business unit’s improved<br />
reporting and to the Partitioned Zone (between Saudi<br />
Arabia and Kuwait) business unit’s increased sour gas<br />
production and improved reporting of gas production<br />
and flaring.<br />
Global NOx emissions were lower than in 2008, mainly<br />
due to improved reporting by the IndoAsia business<br />
unit and the completion in 2008 of a drilling program<br />
at Indonesia geothermal and power operations.<br />
U.S. Refining (Manufacturing) data on emissions to air<br />
are no longer additionally reported separately, as this<br />
report is enterprisewide and global in nature.<br />
Global Gas, previously reported as “other,” was<br />
included with Upstream in <strong>2009</strong>. “Other” includes<br />
Chemicals, <strong>Chevron</strong> Business and Real Estate<br />
Services, <strong>Chevron</strong> Mining Inc., <strong>Chevron</strong> Environmental<br />
Management Co., and <strong>Corporate</strong> Aviation.<br />
Due to rounding, individual numbers may not sum to<br />
the total numbers.<br />
18


