Bioequivalence evaluation of omeprazole 20-mg capsules - aensi
Bioequivalence evaluation of omeprazole 20-mg capsules - aensi
Bioequivalence evaluation of omeprazole 20-mg capsules - aensi

You also want an ePaper? Increase the reach of your titles
YUMPU automatically turns print PDFs into web optimized ePapers that Google loves.
Journal <strong>of</strong> Applied Sciences Research, 5(9): 1190-1194, <strong>20</strong>09<br />
© <strong>20</strong>09, INSInet Publication<br />
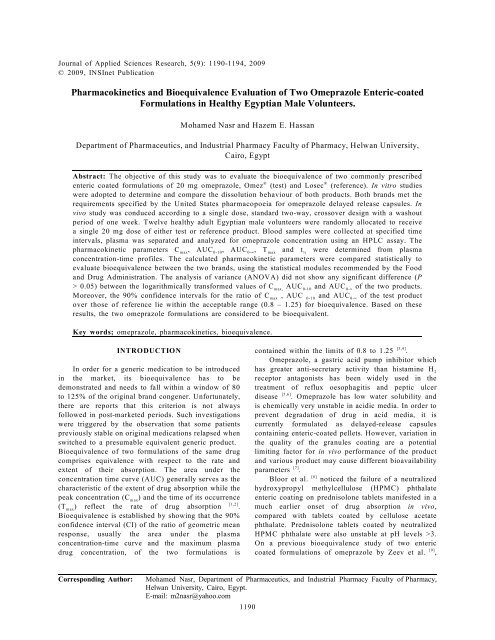
Pharmacokinetics and <strong>Bioequivalence</strong> Evaluation <strong>of</strong> Two Omeprazole Enteric-coated<br />
Formulations in Healthy Egyptian Male Volunteers.<br />
Mohamed Nasr and Hazem E. Hassan<br />
Department <strong>of</strong> Pharmaceutics, and Industrial Pharmacy Faculty <strong>of</strong> Pharmacy, Helwan University,<br />
Cairo, Egypt<br />
Abstract: The objective <strong>of</strong> this study was to evaluate the bioequivalence <strong>of</strong> two commonly prescribed<br />
® ®<br />
enteric coated formulations <strong>of</strong> <strong>20</strong> <strong>mg</strong> <strong>omeprazole</strong>, Omez (test) and Losec (reference). In vitro studies<br />
were adopted to determine and compare the dissolution behaviour <strong>of</strong> both products. Both brands met the<br />
requirements specified by the United States pharmacopoeia for <strong>omeprazole</strong> delayed release <strong>capsules</strong>. In<br />
vivo study was conduced according to a single dose, standard two-way, crossover design with a washout<br />
period <strong>of</strong> one week. Twelve healthy adult Egyptian male volunteers were randomly allocated to receive<br />
a single <strong>20</strong> <strong>mg</strong> dose <strong>of</strong> either test or reference product. Blood samples were collected at specified time<br />
intervals, plasma was separated and analyzed for <strong>omeprazole</strong> concentration using an HPLC assay. The<br />
pharmacokinetic parameters C max, AUC 0-10, AUC 0-�, T max and t ½ were determined from plasma<br />
concentration-time pr<strong>of</strong>iles. The calculated pharmacokinetic parameters were compared statistically to<br />
evaluate bioequivalence between the two brands, using the statistical modules recommended by the Food<br />
and Drug Administration. The analysis <strong>of</strong> variance (ANOVA) did not show any significant difference (P<br />
> 0.05) between the logarithmically transformed values <strong>of</strong> C max, AUC 0-10 and AUC 0-� <strong>of</strong> the two products.<br />
Moreover, the 90% confidence intervals for the ratio <strong>of</strong> C max , AUC 0-10 and AUC 0-� <strong>of</strong> the test product<br />
over those <strong>of</strong> reference lie within the acceptable range (0.8 – 1.25) for bioequivalence. Based on these<br />
results, the two <strong>omeprazole</strong> formulations are considered to be bioequivalent.<br />
Key words; <strong>omeprazole</strong>, pharmacokinetics, bioequivalence.<br />
INTRODUCTION<br />
In order for a generic medication to be introduced<br />
in the market, its bioequivalence has to be<br />
demonstrated and needs to fall within a window <strong>of</strong> 80<br />
to 125% <strong>of</strong> the original brand congener. Unfortunately,<br />
there are reports that this criterion is not always<br />
followed in post-marketed periods. Such investigations<br />
were triggered by the observation that some patients<br />
previously stable on original medications relapsed when<br />
switched to a presumable equivalent generic product.<br />
<strong>Bioequivalence</strong> <strong>of</strong> two formulations <strong>of</strong> the same drug<br />
comprises equivalence with respect to the rate and<br />
extent <strong>of</strong> their absorption. The area under the<br />
concentration time curve (AUC) generally serves as the<br />
characteristic <strong>of</strong> the extent <strong>of</strong> drug absorption while the<br />
peak concentration (C max)<br />
and the time <strong>of</strong> its occurrence<br />
[1,2]<br />
(T max)<br />
reflect the rate <strong>of</strong> drug absorption .<br />
<strong>Bioequivalence</strong> is established by showing that the 90%<br />
confidence interval (CI) <strong>of</strong> the ratio <strong>of</strong> geometric mean<br />
response, usually the area under the plasma<br />
concentration-time curve and the maximum plasma<br />
drug concentration, <strong>of</strong> the two formulations is<br />
Corresponding Author: Mohamed Nasr, Department <strong>of</strong> Pharmaceutics, and Industrial Pharmacy Faculty <strong>of</strong> Pharmacy,<br />
Helwan University, Cairo, Egypt.<br />
E-mail: m2nasr@yahoo.com<br />
1190<br />
[3,4]<br />
contained within the limits <strong>of</strong> 0.8 to 1.25 .<br />
Omeprazole, a gastric acid pump inhibitor which<br />
has greater anti-secretary activity than histamine H2<br />
receptor antagonists has been widely used in the<br />
treatment <strong>of</strong> reflux oesophagitis and peptic ulcer<br />
[5,6]<br />
disease . Omeprazole has low water solubility and<br />
is chemically very unstable in acidic media. In order to<br />
prevent degradation <strong>of</strong> drug in acid media, it is<br />
currently formulated as delayed-release <strong>capsules</strong><br />
containing enteric-coated pellets. However, variation in<br />
the quality <strong>of</strong> the granules coating are a potential<br />
limiting factor for in vivo performance <strong>of</strong> the product<br />
and various product may cause different bioavailability<br />
[7]<br />
parameters .<br />
[8]<br />
Bloor et al. noticed the failure <strong>of</strong> a neutralized<br />
hydroxypropyl methylcellulose (HPMC) phthalate<br />
enteric coating on prednisolone tablets manifested in a<br />
much earlier onset <strong>of</strong> drug absorption in vivo,<br />
compared with tablets coated by cellulose acetate<br />
phthalate. Prednisolone tablets coated by neutralized<br />
HPMC phthalate were also unstable at pH levels >3.<br />
On a previous bioequivalence study <strong>of</strong> two enteric<br />
[9]<br />
coated formulations <strong>of</strong> <strong>omeprazole</strong> by Zeev et al. ,
the authors reported inequivalence <strong>of</strong> tested products,<br />
as the two <strong>omeprazole</strong> products differed in dissolution<br />
behaviour in addition to their difference in both the<br />
rate and extent <strong>of</strong> absorption after a single or multiple<br />
doses administration.<br />
The objective <strong>of</strong> this study was to determine the<br />
pharmacokinetic parameters <strong>of</strong> two brands <strong>of</strong><br />
<strong>omeprazole</strong> <strong>20</strong>-<strong>mg</strong> enteric coated <strong>capsules</strong> and then to<br />
compare these parameters statistically to evaluate the<br />
bioequivalence between the two brands Omez ®<br />
(Pharonia Pharmaceuticals, Egypt) as a test product and<br />
®<br />
Losec (Astra Zenica, Sweden) as a reference product.<br />
MATERIALS AND METHODS<br />
®<br />
Study Products: Test product was Omez <strong>20</strong> <strong>mg</strong><br />
<strong>capsules</strong> (Pharonia pharmaceutical company, Egypt).<br />
®<br />
Reference product was Losec <strong>20</strong> <strong>mg</strong> <strong>capsules</strong><br />
(AstraZeneca, Sweden). Both brands are delayed-release<br />
<strong>capsules</strong> containing enteric-coated pellets.<br />
In Vitro Dissolution Studies:<br />
-Acid Resistance Stage: The dissolution studies were<br />
performed according to the United States Pharmacopeia<br />
for enteric-coated articles USP Pharmacopoeia XXIII<br />
rotating basket method (Varian, Inc., 1300 Weston<br />
Parkway, Cary North Carolina, USA), the dissolution<br />
medium was 500 ml <strong>of</strong> 0.1 N hydrochloric acid, the<br />
stirring speed was 100 rpm, and the temperature was<br />
maintained at 37°C ± 1°C for over 2 hrs.<br />
-Buffer Stage: After a pre-exposure <strong>of</strong> the <strong>capsules</strong> to<br />
simulated gastric fluid (pH 1.2) for 2 hours, disodium<br />
hydrogen phosphate was added to adjust the pH <strong>of</strong> the<br />
solution to pH 6.8. The amount <strong>of</strong> <strong>omeprazole</strong> released<br />
into 900 ml phosphate buffer solution (pH 6.8) after<br />
15, 30 and 45 minutes was determined by<br />
spectrophotometer-UV detection (Perkin Elmer, Type<br />
Lambda Ez <strong>20</strong>1, USA) at 302 nm.<br />
In Vivo Studies:<br />
-Study Design: The study was approved by the<br />
University Protection <strong>of</strong> Human Subjects Committee<br />
and the protocol complies with the declarations <strong>of</strong><br />
Helsinki and Tokyo for humans. Twelve healthy adult<br />
male volunteers between 17 and 47 years old (mean =<br />
24 years) and weighing from 62 to 90 kg (mean = 78<br />
kg) participated in the study after giving informed<br />
written consent. All were judged to be healthy and<br />
were not receiving any medications during the study<br />
period. The study was conduced according to a single<br />
dose, standard two-way, spilt groups, crossover design<br />
with 6 subjects in each <strong>of</strong> the two treatment groups<br />
and a washout period <strong>of</strong> one week between the two<br />
phases. The volunteers were randomly selected to<br />
® ®<br />
receive one <strong>20</strong> <strong>mg</strong> capsule <strong>of</strong> either Losec or Omez .<br />
J. App. Sci. Res., 5(9): 1190-1194, <strong>20</strong>09<br />
1191<br />
Both products were administered with 150 ml <strong>of</strong> water<br />
in the morning after a 12 hr over night fast. Food and<br />
drinks were withheld for at least 2 hours after dosing.<br />
For each session, a catheter was placed in an arm vein<br />
for blood sampling. A 4-ml blood samples were<br />
collected in heparinzed tubes for the measurement <strong>of</strong><br />
<strong>omeprazole</strong> concentration at 30 min pre-dose and at<br />
0.5, 1, 1.5, 2, 2.5, 3, 4, 6, 8, and 10 h post-dose. The<br />
blood samples were centrifuged at 3000 rpm for 10<br />
min, and the plasma was transferred to separate glass<br />
tubes to be kept frozen until analysis.<br />
-Analysis <strong>of</strong> Omeprazole Plasma Level: Plasma<br />
samples were analyzed for <strong>omeprazole</strong> concentration by<br />
[10]<br />
using a validated HPLC assay with some<br />
modifications. The HPLC system consisted <strong>of</strong> a<br />
Shimadzu LC- <strong>20</strong> AT Liquid Chromatograph using C18<br />
ODS column (150 X 3.9 mm) Phenomenex, USA and<br />
a model SPD-<strong>20</strong>A/ Prominence UV-VIS detector<br />
(Shimadzu, Japan) equipped with a Rheodyne injector<br />
(Model 7161, Catati, California, USA equipped with 25<br />
µl injector loop). Peak areas were determined with a C-<br />
R6A Chromatopac Shimadzu integrator. The<br />
wavelength was set at 302 nm. The mobile phase<br />
consisted <strong>of</strong> 45% methanol and 55% <strong>of</strong> 0.1 M<br />
dipotassium hydrogen phosphate, pH 7.8. The mobile<br />
phase was prepared daily and degassed by a DGU-<strong>20</strong><br />
A3 prominence degasser. Analysis was run at a flow<br />
2<br />
rate <strong>of</strong> 0.5 ml/min. the assay was linear (r > 0.987)<br />
over the tested concentrations (10 – 1000 ng/ml).<br />
-Standard Solutions: Standard solutions <strong>of</strong> <strong>omeprazole</strong><br />
and internal standard (Doxazosin, Sigma) were prepared<br />
by dissolving 10 <strong>mg</strong> <strong>of</strong> each in 100 ml <strong>of</strong> methanol.<br />
The working standard solution for each was prepared<br />
by taking 10 ml from the above solutions in 100 ml<br />
methanol (10 µg/ ml).<br />
-Calibration Curve: Standard samples were prepared<br />
by transferring aliquots <strong>of</strong> standard solution into<br />
centrifuge tubes provided with tight sealing<br />
polyethylene caps, containing 1 ml <strong>of</strong> blank plasma to<br />
yield final <strong>omeprazole</strong> concentrations <strong>of</strong> 10, <strong>20</strong>, 50,<br />
100, <strong>20</strong>0, 300, 500 and 1000 ng/ml. Internal standard<br />
solution was added to each tube to yield a<br />
concentration <strong>of</strong> 10 µg/ml. The final volume in each<br />
tube was completed to 6 ml with ether. After mixing<br />
by vortex for <strong>20</strong> seconds, the mixture centrifuged for<br />
10 minutes at 3000 rpm. The upper layer was<br />
transferred to another tube filtered through 0.45 µm<br />
millipore filter, evaporated to dryness under nitrogen<br />
stream at ambient temperature and the residue was<br />
reconstituted in 1 ml <strong>of</strong> the mobile phase, 50 µl were<br />
injected on the column for analysis. Typical<br />
chromatograms obtained from blank plasma and blank<br />
plasma spiked with <strong>omeprazole</strong> are represented in
figure 1 and indicating non-interfering peaks. Under the<br />
conditions described, the retention times <strong>of</strong> <strong>omeprazole</strong><br />
and internal standard were 5.58 and 8.35 min.,<br />
respectively (Figure 1). A standard curve was<br />
constructed by plotting the peak area ratio <strong>of</strong><br />
omepraole to internal standard versus <strong>omeprazole</strong><br />
concentration in plasma. All assays were performed in<br />
triplicate.<br />
-Plasma Analysis: One ml <strong>of</strong> the different plasma<br />
samples obtained from the volunteers were assayed as<br />
described above without the addition <strong>of</strong> <strong>omeprazole</strong>.<br />
-Pharmacokinetic Analysis: Omeprazole<br />
pharmacokinetics parameters were determined by non-<br />
[11]<br />
compartmental kinetics . The elimination rate<br />
constant (K el)<br />
was estimated by least square regression<br />
<strong>of</strong> plasma concentration- time data points in the<br />
terminal log-linear region <strong>of</strong> the curves. Half life (t 1/2)<br />
was calculated as 0.693 divided by K el.<br />
The area under<br />
the plasma concentration-time curve from zero to the<br />
last measurable plasma concentration at time t (AUC 0-t)<br />
was calculated using linear trapezoidal rule. The area<br />
under the curve from zero to infinity, AUC 0–� was<br />
calculated as AUC 0–� = (AUC 0-t ) + C t/ K el, where C t is<br />
the last measured concentration at the time. Peak<br />
plasma concentration (C max ) and the time to peak<br />
concentration (T max)<br />
were obtained directly from the<br />
individual plasma concentration versus time curve.<br />
Statistical Analysis: For the purpose <strong>of</strong> bioequivalence<br />
analysis C max , AUC 0-10 and AUC 0-� were considered as<br />
primary variables. After logarithmic transformation<br />
C max, AUC 0-10 and AUC 0-� values were analyzed<br />
[12]<br />
according to the FDA guidelines . <strong>Bioequivalence</strong><br />
was assessed by means <strong>of</strong> an analysis <strong>of</strong> variance<br />
TM<br />
(ANOVA) using (SigmaStat ) for crossover design<br />
and calculating standard 90% confidence intervals [13-15]<br />
<strong>of</strong> the ratio test/reference. The products were<br />
considered bioequivalent if the difference between two<br />
compared parameters was found statistically<br />
insignificant (P > 0.05) and 90% confidence intervals<br />
for these parameters fell within 80 - 125%.<br />
RESULTS AND DISCUSSION<br />
In Vitro Dissolution Studies: After pre-exposure in<br />
simulated gastric fluid without enzymes, at pH 1.2 over<br />
2 hours, the gelatin <strong>capsules</strong> <strong>of</strong> both products were<br />
dissolved and the pellets content in both products<br />
remained intact and the solution un-coloured. Moreover,<br />
no <strong>omeprazole</strong> was detected in the acidic medium<br />
when analyzed spectrophotometrically at 302 nm. These<br />
findings reflect the stability <strong>of</strong> both products in the<br />
gastric pH 1.2.<br />
After 15, 30 and 45 min in the phosphate buffer<br />
J. App. Sci. Res., 5(9): 1190-1194, <strong>20</strong>09<br />
1192<br />
solution (pH 6.8), the percentage <strong>omeprazole</strong> released<br />
in the medium from the reference product were 87.43,<br />
97.<strong>20</strong> and 100 %, respectively. While the test <strong>capsules</strong><br />
showed 75.54, 94.19 and 100 % release respectively<br />
(Table 1). The results pointed that, after 30 minutes in<br />
simulated intestinal medium, more than 75 % <strong>of</strong> the<br />
labeled amount <strong>of</strong> <strong>omeprazole</strong> were released and after<br />
45 minutes a complete <strong>omeprazole</strong> release was<br />
established by the two enteric coated formulations.<br />
Therefore, both formulations met the requirements<br />
specified by the United States pharmacopoeia for<br />
<strong>omeprazole</strong> delayed release from <strong>capsules</strong> labeled <strong>20</strong><br />
<strong>mg</strong>, where not less than 75% <strong>of</strong> the labeled amount <strong>of</strong><br />
[16]<br />
<strong>omeprazole</strong> is dissolved in 30 min .<br />
In Vivo Studies: The mean plasma <strong>omeprazole</strong><br />
concentration-time pr<strong>of</strong>ile following administration <strong>of</strong><br />
a single <strong>20</strong> <strong>mg</strong> <strong>omeprazole</strong> oral dose <strong>of</strong> either the test<br />
or reference products are shown in figure 2. It can be<br />
seen from figure 2 that the two pr<strong>of</strong>iles were quite<br />
comparable.<br />
Pharmacokinetic parameters (C max, T max, AUC0-10<br />
and AUC 0-�, and t 1/2)<br />
are calculated individually on the<br />
basis <strong>of</strong> concentration-time data. From individual<br />
pharmacokinetic parameters, their mean values ± S.D,<br />
were obtained and are shown in Table (2) for both test<br />
and reference formulations <strong>of</strong> <strong>omeprazole</strong>. All<br />
calculated pharmacokinetic parameters values were in<br />
[9]<br />
good agreement with the previously reported values .<br />
The mean T max values for test and reference were<br />
2.08 ± 0.<strong>20</strong> hr and 2.25 ± 0.27 hr, respectively, being<br />
in good agreement with those reported in the literature<br />
[17]<br />
. The mean time to attain maximum plasma<br />
concentrations (T max)<br />
<strong>of</strong> <strong>omeprazole</strong> is highly<br />
[18]<br />
formulation dependent . The slight difference<br />
between the mean T max was not found to be statistically<br />
significant statistically (P = 0.5) when analyzed with<br />
Wilcoxon signed rank test.<br />
Statistical analysis <strong>of</strong> the bioequivalence<br />
pharmacokinetic parameters using ANOVA, shows no<br />
statistically significant difference between the<br />
logarithmic transformed C ma values (P = 0.332), as well<br />
as the logarithmically transformed values <strong>of</strong> AUC 0-10<br />
and AUC 0-� (P = 0.635 and 0.633, respectively) <strong>of</strong> the<br />
two <strong>omeprazole</strong> products (Table 2). Moreover, the 90%<br />
confidence interval for the ratio <strong>of</strong> C max , AUC 0-10 and<br />
AUC 0-� <strong>of</strong> the test over those <strong>of</strong> reference were found<br />
to lie between 1.14 – 0.98 , 1.10 – 0.97 and 1.10 -<br />
0.98, respectively, all being within the FDA acceptable<br />
bioequivalence limits <strong>of</strong> 0.8 – 1.25 (Table 2).<br />
Conclusion: The statistical comparison <strong>of</strong> C max, AUC0-10<br />
and AUC 0-� clearly indicated no significant difference<br />
in the two brands <strong>of</strong> <strong>omeprazole</strong> <strong>20</strong>-<strong>mg</strong> <strong>capsules</strong>. 90%
J. App. Sci. Res., 5(9): 1190-1194, <strong>20</strong>09<br />
Table 1: Cumulative release % in phosphate buffer solution (pH 6.8) after pre-exposure to acidic medium <strong>of</strong> pH 1.2 over 2 hours.<br />
Parameters Cumulative <strong>omeprazole</strong> release (% <strong>of</strong> label amount) Mean ± SD (n = 3)<br />
-------------------------------------------------------------------------------------------------------------<br />
Time minutes Test Reference<br />
15 75.54 ± 4.78 87.43 ± 3.31<br />
--------------------------------------------------------------------------------------------------------------------------------------------------------------------------------<br />
30 94.19 ± 0.68 97.2 ± 2.34<br />
--------------------------------------------------------------------------------------------------------------------------------------------------------------------------------<br />
45 100 ± 0.35 100 ± 0.01<br />
Table 2: Pharmacokinetic parameters <strong>of</strong> <strong>omeprazole</strong> in 12 volunteers (mean ±SD)<br />
Parameters C max(ng/ml) AUC 0-10 (ng.hr/ml) AUC 0-�(ng.h/ml) T max (h) t ½(h)<br />
Test 255.83±37.47 653.80±76.95 672.03±75.37 2.08±0.<strong>20</strong> 1.75 ±0.28<br />
--------------------------------------------------------------------------------------------------------------------------------------------------------------------------------<br />
Reference 240.87±98.36 617.81±<strong>20</strong>4.41 632.89±<strong>20</strong>4.<strong>20</strong> 2.25±0.27 1.62±0.29<br />
--------------------------------------------------------------------------------------------------------------------------------------------------------------------------------<br />
P value<br />
a<br />
0.332<br />
a<br />
0.635<br />
a<br />
0.633<br />
b<br />
0.5<br />
a<br />
0.26<br />
--------------------------------------------------------------------------------------------------------------------------------------------------------------------------------<br />
90% CI 0.98 -1.14 0.97 -1.10 0.98 - 1.10 0.88 - 0.97 NR<br />
a<br />
Statistical insignificant difference between test and reference, P > 0.05 based on ANOVA for crossover design.<br />
b<br />
Statistical insignificant difference between test and reference, P > 0.05 based on Wilcoxon signed rank test. 90 % CI = 90 % confidence<br />
interval; NR =Not Required<br />
Fig. 1: Representative HPLC chromatograms <strong>of</strong> blank human plasma (A), <strong>omeprazole</strong> and internal standard in<br />
human plasma sample (B) (Retention times 5.588 min and 8.351 min respectively).<br />
confidence intervals for the mean ratio <strong>of</strong> C max, AUC0-10<br />
and AUC 0-� <strong>of</strong> the test over those <strong>of</strong> reference were<br />
entirely within the Food and Drug Administration<br />
acceptance range. Based on the pharmacokinetic and<br />
statistical results <strong>of</strong> this study, we can conclude that<br />
1193<br />
®<br />
Omez <strong>20</strong>-<strong>mg</strong> <strong>capsules</strong> (Pharonia, Egypt) is<br />
®<br />
bioequivalent to Losec <strong>20</strong>-<strong>mg</strong> <strong>capsules</strong> (Astra Zenica,<br />
Sweden) and that the two products can be considered<br />
interchangeable in medical practice.
J. App. Sci. Res., 5(9): 1190-1194, <strong>20</strong>09<br />
Fig. 2: Mean plasma concentrations <strong>of</strong> <strong>omeprazole</strong> in 12 healthy volunteers, after a single oral dose administration<br />
(<strong>20</strong> <strong>mg</strong>) <strong>of</strong> Losec® and Omez® capsule.<br />
REFERENCES<br />
1. Schulz, H.U. and V.W. Steinijans, 1992. Striving<br />
for standards in bioequivalence assessment: a<br />
review, Int. J. Clin. Pharmacol. Ther. Toxicol.,<br />
30(1): S1-S6.<br />
2. Hauschke, D. and V.W. Steinijans, 1990. A<br />
Distribution-Free procedure for the statistical<br />
Analysis <strong>of</strong> <strong>Bioequivalence</strong> Studies. Int. J. Clin.<br />
Pharmacol. Ther. Toxicol., 28: 72-78.<br />
3. Schuirmann D.J., 1987. A comparison <strong>of</strong> the two<br />
one-sided tests procedure and the power approach<br />
for assessing the equivalence <strong>of</strong> average<br />
bioavailability. J Pharmacokinet Biopharm., 15:<br />
657-80.<br />
4. Barrett, J.S., V. Batra, A. Chow, A.L. Gould, A.H.<br />
Heller, M.W. Lo, S.D. Patterson, B.P. Smith, J.A.<br />
Stritar, J.M. Vega and N. Zariffa, <strong>20</strong>00. PhRMA<br />
perspective on population and individual<br />
bioequivalence. J. Clin. Pharmacol., 40(6): 561-71.<br />
5. Colin, W.H., 1991. Clinical pharmacology <strong>of</strong><br />
<strong>omeprazole</strong>. Clin Pharmacokinet., <strong>20</strong>: 38-49.<br />
6. Mctavish, D., M.T. Buckley and R.C. Heel, 1991.<br />
Omeprazole. Drugs, 42: 138-170.<br />
7. Farinha, A., A. Bica and J.P. Pais, 1999.<br />
<strong>Bioequivalence</strong> <strong>evaluation</strong> <strong>of</strong> two <strong>omeprazole</strong><br />
enteric-coated formulations in humans. Eur. J.<br />
Pharm. Sci., 7(4): 311-5.<br />
8. Bloor, J.R., P.V. McAuley, N. Thakore and J.A.<br />
Stead, 1989. The in vitro and in vivo performance<br />
<strong>of</strong> aqueous based enteric coats <strong>of</strong> neutralized<br />
hydroxypropyl methyl cellulose phthalate. Drug<br />
Dev. Ind. Pharm., 15(14-16): 2227- 2243.<br />
1194<br />
9. Zeev, E., B. Dan, M. Alex, T. Igor and D.<br />
Abraham, <strong>20</strong>02. Multiple-Dose Studies Can Be a<br />
More Sensitive Assessment for <strong>Bioequivalence</strong><br />
Than Single-Dose Studies. Clin. Drug Invest.,<br />
22(9): 585-592.<br />
10. Macek, J., P. Ptácek and J. Klíma, 1997.<br />
Determination <strong>of</strong> <strong>omeprazole</strong> in human plasma by<br />
high-performance liquid chromatography. J.<br />
Chromatogr. B, 689: 239 -243.<br />
11. Gilbaldi, M. and D. Perrier, 1982.<br />
Pharmacokinetics 2nd ed. Marcel Dekker, Inc.,<br />
New York, 409-417.<br />
12. FDA guidelines, 1992. <strong>Bioequivalence</strong> Food and<br />
Drug Administration, Division <strong>of</strong> <strong>Bioequivalence</strong><br />
Office <strong>of</strong> Generic Drugs: Rockville, MD, 1992<br />
Guidelines.<br />
13. Westlake, W.F., 1972. Use <strong>of</strong> confidence interval<br />
in analysis <strong>of</strong> comparative bioavailability trials. J<br />
Pharm Sci., 61: 1340-1341.<br />
14. Mandallaz, D. and J. Mau, 1981, Comparison <strong>of</strong><br />
different methods <strong>of</strong> decision making in<br />
bioequivalence assessments. Biometrics, 37: 213-<br />
222.<br />
15. Locke, S., 1984. An exact confidence interval from<br />
untransformed data for the ratio <strong>of</strong> two<br />
formulations means, J. Pharmacokin. Biopharm.,<br />
12(6): 649 - 655.<br />
16. USP Pharmacopoeia XXIII, 1995. Rockville (MD).<br />
17. Regardh, G., Gabrielsson, M. H<strong>of</strong>fma, K.J.<br />
L<strong>of</strong>berg, I. and Skanberg, I. 1985:<br />
Pharmacokinetics and metabolism <strong>of</strong> <strong>omeprazole</strong> in<br />
animals and man, an overview. Scand. J.<br />
Gastroenterol suppl., 108: 79-94.<br />
18. Watanabe, K., K. Furuno, K. Eto, R. Oishi and Y.<br />
Gomit, 1994. First-Pass metabolism <strong>of</strong> <strong>omeprazole</strong><br />
in rats. J. Pharm. Sci., 83: 1131-1134.