Virginia Beach Police Department 2009 Annual Report - City of ...
Virginia Beach Police Department 2009 Annual Report - City of ...
Virginia Beach Police Department 2009 Annual Report - City of ...

Create successful ePaper yourself
Turn your PDF publications into a flip-book with our unique Google optimized e-Paper software.
<strong>Report</strong>ed Crimes<br />
<strong>Virginia</strong> <strong>Beach</strong> <strong>Police</strong> <strong>Department</strong> - <strong>2009</strong> <strong>Annual</strong> <strong>Report</strong><br />
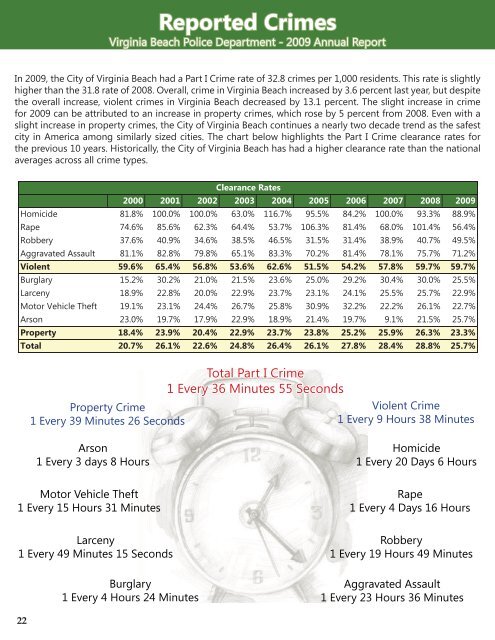
In <strong>2009</strong>, the <strong>City</strong> <strong>of</strong> <strong>Virginia</strong> <strong>Beach</strong> had a Part I Crime rate <strong>of</strong> 32.8 crimes per 1,000 residents. This rate is slightly<br />
higher than the 31.8 rate <strong>of</strong> 2008. Overall, crime in <strong>Virginia</strong> <strong>Beach</strong> increased by 3.6 percent last year, but despite<br />
the overall increase, violent crimes in <strong>Virginia</strong> <strong>Beach</strong> decreased by 13.1 percent. The slight increase in crime<br />
for <strong>2009</strong> can be attributed to an increase in property crimes, which rose by 5 percent from 2008. Even with a<br />
slight increase in property crimes, the <strong>City</strong> <strong>of</strong> <strong>Virginia</strong> <strong>Beach</strong> continues a nearly two decade trend as the safest<br />
city in America among similarly sized cities. The chart below highlights the Part I Crime clearance rates for<br />
the previous 10 years. Historically, the <strong>City</strong> <strong>of</strong> <strong>Virginia</strong> <strong>Beach</strong> has had a higher clearance rate than the national<br />
averages across all crime types.<br />
Clearance Rates<br />
2000 2001 2002 2003 2004 2005 2006 2007 2008 <strong>2009</strong><br />
Homicide 81.8% 100.0% 100.0% 63.0% 116.7% 95.5% 84.2% 100.0% 93.3% 88.9%<br />
Rape 74.6% 85.6% 62.3% 64.4% 53.7% 106.3% 81.4% 68.0% 101.4% 56.4%<br />
Robbery 37.6% 40.9% 34.6% 38.5% 46.5% 31.5% 31.4% 38.9% 40.7% 49.5%<br />
Aggravated Assault 81.1% 82.8% 79.8% 65.1% 83.3% 70.2% 81.4% 78.1% 75.7% 71.2%<br />
Violent 59.6% 65.4% 56.8% 53.6% 62.6% 51.5% 54.2% 57.8% 59.7% 59.7%<br />
Burglary 15.2% 30.2% 21.0% 21.5% 23.6% 25.0% 29.2% 30.4% 30.0% 25.5%<br />
Larceny 18.9% 22.8% 20.0% 22.9% 23.7% 23.1% 24.1% 25.5% 25.7% 22.9%<br />
Motor Vehicle Theft 19.1% 23.1% 24.4% 26.7% 25.8% 30.9% 32.2% 22.2% 26.1% 22.7%<br />
Arson 23.0% 19.7% 17.9% 22.9% 18.9% 21.4% 19.7% 9.1% 21.5% 25.7%<br />
Property 18.4% 23.9% 20.4% 22.9% 23.7% 23.8% 25.2% 25.9% 26.3% 23.3%<br />
Total 20.7% 26.1% 22.6% 24.8% 26.4% 26.1% 27.8% 28.4% 28.8% 25.7%<br />
Property Crime<br />
1 Every 39 Minutes 26 Seconds<br />
Total Part I Crime<br />
1 Every 36 Minutes 55 Seconds<br />
Violent Crime<br />
1 Every 9 Hours 38 Minutes<br />
Arson<br />
1 Every 3 days 8 Hours<br />
Motor Vehicle Theft<br />
1 Every 15 Hours 31 Minutes<br />
Larceny<br />
1 Every 49 Minutes 15 Seconds<br />
Burglary<br />
1 Every 4 Hours 24 Minutes<br />
Homicide<br />
1 Every 20 Days 6 Hours<br />
Rape<br />
1 Every 4 Days 16 Hours<br />
Robbery<br />
1 Every 19 Hours 49 Minutes<br />
Aggravated Assault<br />
1 Every 23 Hours 36 Minutes<br />
22