<strong>Virginia</strong> <strong>Beach</strong> vs. Other U.S. Cities <strong>Virginia</strong> <strong>Beach</strong> <strong>Police</strong> <strong>Department</strong> - <strong>2009</strong> <strong>Annual</strong> <strong>Report</strong> Comparsions <strong>of</strong> Crimes in U.S. Cities <strong>Virginia</strong> <strong>Beach</strong> vs. Other Cities With Populations 350,000 to 900,000 Offenses Known to <strong>Police</strong> in 2008 Ranked by Crime Rate per 1,000 Residents Lowest to Highest 34 Crimes per 1,000 Rank <strong>City</strong> By State State Population Residents Modified Violent Property Crimes per Crimes per Modified 1,000 Residents 1,000 Residents Violent Crimes Property Crimes Total Crimes <strong>Report</strong>ed 1 <strong>Virginia</strong> <strong>Beach</strong> VA 432,696 31.9 2.4 29.5 1,043 12,744 13,787 2 Long <strong>Beach</strong> CA 467,055 34.9 6.8 28.1 3,158 13,121 16,279 3 El Paso TX 612,374 37.0 4.6 32.4 2,825 19,820 22,645 4 Honolulu HI 906,349 38.3 2.8 35.5 2,575 32,146 34,721 5 Denver CO 592,881 38.5 5.7 32.8 3,361 19,463 22,824 6 Raleigh NC 388,661 40.0 5.8 34.2 2,245 13,288 15,533 7 Mesa AZ 456,821 43.5 5.0 38.5 2,289 17,589 19,878 8 Colorado Springs CO 378,403 48.0 5.3 42.7 1,999 16,175 18,174 9 Fresno CA 475,723 52.7 5.8 46.8 2,782 22,280 25,062 10 Louisville Metro KY 629,679 53.9 6.8 47.1 4,306 29,642 33,948 11 San Francisco CA 798,144 54.2 8.4 45.8 6,744 36,536 43,280 12 Fort Worth TX 701,345 57.2 6.6 50.7 4,601 35,541 40,142 13 Sacramento CA 467,065 58.6 10.0 48.6 4,660 22,709 27,369 14 Portland OR 553,023 59.7 6.2 53.4 3,445 29,546 32,991 15 Arlington TX 375,836 59.8 6.0 53.8 2,262 20,212 22,474 16 Seattle WA 598,077 60.8 5.8 55.0 3,447 32,899 36,346 17 Washington DC 591,833 62.4 13.7 48.7 8,135 28,810 36,945 18 Wichita KS 362,602 64.3 8.5 55.8 3,091 20,221 23,312 19 Baltimore MD 634,549 64.7 15.9 48.9 10,080 31,000 41,080 20 Austin TX 753,535 64.8 5.2 59.6 3,935 44,888 48,823 21 Miami FL 427,740 65.7 13.3 52.4 5,709 22,394 28,103 22 Jacksonville FL 806,080 67.4 10.0 57.5 8,032 46,320 54,352 23 Nashville TN 602,181 67.9 14.0 53.9 8,404 32,463 40,867 24 Minneapolis MN 376,753 68.3 12.7 55.6 4,779 20,937 25,716 25 Oklahoma <strong>City</strong> OK 552,452 68.9 9.8 59.2 5,400 32,688 38,088 26 Albuquerque NM 527,464 69.9 8.9 60.9 4,718 32,126 36,844 27 Charlotte-Mecklenburg NC 758,769 71.6 9.3 62.3 7,070 47,270 54,340 28 Columbus OH 751,887 72.6 7.7 64.8 5,821 48,752 54,573 29 Tulsa OK 382,954 73.0 12.9 60.1 4,922 23,019 27,941 30 Indianapolis IN 808,329 73.3 12.0 61.3 9,735 49,544 59,279 31 Cleveland OH 433,452 73.4 14.3 59.1 6,193 25,603 31,796 32 Milwaukee WI 602,131 73.4 12.2 61.2 7,339 36,879 44,218 33 Oakland CA 401,587 73.9 19.7 54.3 7,905 21,787 29,692 34 Kansas <strong>City</strong> MO 451,454 77.2 13.9 63.3 6,269 28,576 34,845 35 Atlanta GA 533,016 87.3 13.9 73.4 7,403 39,125 46,528 36 Memphis TN 672,046 99.6 19.3 80.4 12,937 54,029 66,966 37 St. Louis MO 356,204 107.1 20.7 86.4 7,383 30,768 38,151 Source: FBI Crime in the United States 2008. The FBI's Crime in the United States 2008 is the source for all population figures and all reported crime contained in the report, with the exception <strong>of</strong> <strong>Virginia</strong> <strong>Beach</strong>. Population figures for <strong>Virginia</strong> <strong>Beach</strong> were adjusted to match Weldon Cooper Center for Public Service at the University <strong>of</strong> <strong>Virginia</strong>. <strong>Virginia</strong> <strong>Beach</strong> crime figures differ somewhat from <strong>of</strong>ficial figures released by the <strong>Virginia</strong> <strong>Beach</strong> <strong>Police</strong> <strong>Department</strong>. The above chart provides a quick comparison <strong>of</strong> cities with similar populations only. The FBI cautions against ranking cities due to the unique attributes that may impact crime in any specific city. Refer to http://www.fbi.gov/ucr/ucr.htm for more information.
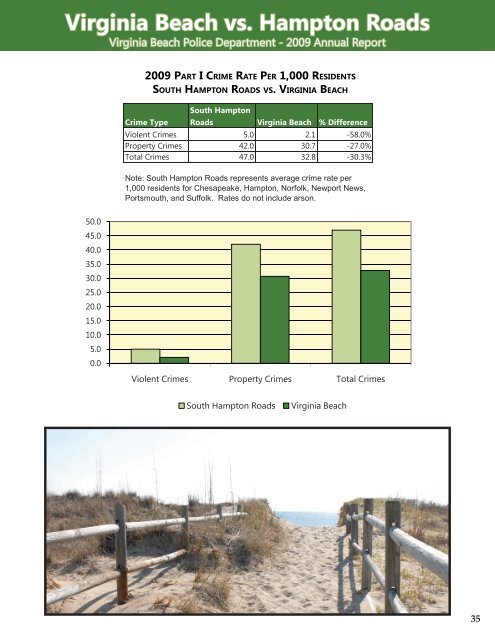
<strong>Virginia</strong> <strong>Beach</strong> vs. Hampton Roads <strong>Virginia</strong> <strong>Beach</strong> <strong>Police</strong> <strong>Department</strong> - <strong>2009</strong> <strong>Annual</strong> <strong>Report</strong> <strong>2009</strong> PART I CRIME RATE PER 1,000 RESIDENTS SOUTH HAMPTON ROADS VS. VIRGINIA BEACH South Hampton Crime Type Roads <strong>Virginia</strong> <strong>Beach</strong> % Difference Violent Crimes 5.0 2.1 -58.0% Property Crimes 42.0 30.7 -27.0% Total Crimes 47.0 32.8 -30.3% Note: South Hampton Roads represents average crime rate per 1,000 residents for Chesapeake, Hampton, Norfolk, Newport News, Portsmouth, and Suffolk. Rates do not include arson. 50.00 45.0 40.0 35.0 30.00 25.0 20.0 15.0 10.0 50 5.0 0.0 Violent Crimes Property Crimes Total Crimes South Hampton Roads <strong>Virginia</strong> <strong>Beach</strong> 35